† Corresponding author. E-mail:
Project supported by the National Natural Science Foundation of China (Grant Nos. 11434012, 41561144006, and 11125420).
Ocean noise recorded during a typhoon can be used to monitor the typhoon and investigate the mechanism of the wind-generated noise. An analytical expression for the typhoon-generated noise intensity is derived as a function of wind speed. A “bi-peak” structure was observed in an experiment during which typhoon-generated noise was recorded. Wind speed dependence and frequency dependence were also observed in the frequency range of 100 Hz–1000 Hz. The model/data comparison shows that results of the present model of 500 Hz and 1000 Hz are in reasonable agreement with the experimental data, and the typhoon-generated noise intensity has a dependence on frequency and a power-law dependence on wind speed.
Tropical cyclones are one of the most common weather conditions that occur over the tropical oceans. When the sustained wind speed reaches at least 34 meters per second, a tropical cyclone is called “typhoon” in the Northwestern Pacific or “hurricane” in the North Atlantic or Northeastern Pacific. Typhoons are one of the most destructive natural disasters. Although satellites can effectively detect and track typhoons, it is difficult to measure the wind speed accurately. An alternative approach is to use the reconnaissance aircraft. However, this approach is severely limited due to the expense of these aircraft. Hence, it is urgent to develop new methods to monitor typhoons accurately and inexpensively.
Ocean noise provides a practical means to study typhoons. Previous works[1–3] show that the summation of noise intensity within a circularity area above the receiver dominates the noise intensity, and hence we can roughly estimate the power of typhoons safely and inexpensively by measuring underwater noise intensity. However, we need experimental data to support the theory. In addition, it is presented in the literature that the local (within a few kilometers) wind speed is the dominant factor for the noise intensity, but this claim still needs to be further verified.
Basic concepts and characteristics of ocean noise should be understood before it is applied to monitor typhoons. Ocean noise is an important research area in underwater acoustics. It is well known that ocean noise originates from multiple sources, including wind-generated sources, biological sources, shipping sources, etc., and no one type of sources dominates the received field in most situations.[4] Wenz curve published in 1962 is one of the most important works on ambient noise, which presents the feature of noise spectral intensity for sources such as earthquakes, ships, and winds in a broad frequency band in the deep ocean.[5] The noise summary curve is the basis of many prediction systems. An overview and perspective on the subject of underwater ambient noise was provided by Dahl,[4] which discussed particularly the approximate magnitude and frequency dependence of underwater ambient noise and a partial inventory of its primary sources.
Wind-generated noise is an essential component of underwater ambient noise.[6] A number of wind-generated noise models have been proposed based on different physical mechanism assumptions. One prediction model for ambient noise levels is developed by Tkalich and Chan under the assumption that the acoustic power is radiated by a bubble cloud under breaking wind waves.[7] Deane and Stokes presented a model for the underwater noise of whitecaps by assuming that the noise from a few hundred hertz to 80 kHz is due to the pulses of sound radiated by bubbles formed within a breaking wave crest.[8] Another theory proposed by Wilson is that the physical mechanism of the wind-induced noise should involve the impact of water droplets from ocean spray, streaks, and whitecaps, which largely depends on the wind speed.[9] He also developed a wind-generated noise model based on the “whitecap index,” a function describing the coverage degree of “whitecaps” due to different wind speeds. This model allows for a separate estimate of distant storm noise and local wind noise.[10,11] Kuperman and Ingenito proposed a widely used noise model based on the normal mode theory to calculate the ocean noise field with a uniform ocean noise source distribution.[12]
The above-mentioned models have been verified by lots of experimental data in different environments. Ferguson and Wylline calculated the theoretical response of a conventional beamformer using various noise models which take into account distributions of surface or volume sources. The theoretical response is then compared with the observed response for noise generated by winds and waves at the ocean surface. Good agreement is obtained when the wind-generated noise is modeled as a uniform distribution of dipole sources.[13] High correlation between the wind speed and the ambient noise intensity is observed at both low frequencies (tens of hertz) and higher frequencies (hundreds of hertz) by using correlation techniques.[14–18] Low frequency ambient noise at deep ocean sites are measured and the power-law wind speed dependence is summarized by Chapman and Cornish.[19] However, when investigating the relationship between the local winds and the noise intensity experimentally, it is difficult to eliminate the effects of local contaminating (non-surface wind-generated) noise sources.
In the frequency range of interest in this paper, which is in the range of 100 Hz–1000 Hz, shipping and winds are considered as two major sources of ocean noise. Usually, the high shipping density nearby makes it difficult to observe the effect of winds in experiments with a single omnidirectional hydrophone. However, during a typhoon, wind-generated sea surface agitation provides the dominant contribution to the ambient noise field due to the low shipping density within the storm region. Even more fortunately, the wind speed changes dramatically during a quite short period of time (usually two or three days), which is a desirable situation to investigate the wind-generated noise.
Very few papers have been published on data/model comparison about the typhoon-generated noise. In this paper, a model is developed for the noise intensity due to a typhoon in an ocean waveguide. Experimental data are then analyzed with this model. The results show the potential to study typhoons by ocean noise.
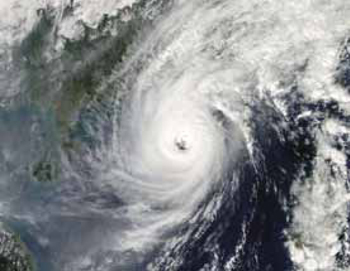
A typhoon is a mature tropical cyclone that develops in the northwest Pacific ocean. The near-surface wind field of a typhoon is nearly axisymmetric. The wind speed is low at the center, but it increases rapidly with range to its maximum value, and then decays gradually with range, as shown in Fig. eye: the center of the typhoon, where the wind speed is low; eye wall: the cloudy outer edge of the eye, where the greatest wind speeds are observed; out eye: the region where the wind speed decays slowly with range.
 | Fig. 1. Satellite image of typhoon “Krosa” (2013/11/02 03:00 (UTC)). This figure is from the Digital Typhoon Web page of National Institute of Informatics (NII), Japan. |
The wind speed of a mature typhoon is described by a parametric cyclone model developed by Holland,[20] which is expressed as

| Table 1. Simulation parameters. . |
In the frequency range of 100 Hz–1000 Hz, shipping and wind noises are two major components of the noise field. Fortunately, the ship density during a typhoon is small such that the contribution of shipping noise is almost negligible.
The geometry of the typhoon-generated noise model is shown in Fig.


In a range-independent waveguide, the Green’s function can be expressed as the summation of normal modes,

By substituting Eq. (

Equation (


If the typhoon eye is far away from the receiver, the wind speeds within a disc centered at the receiver vary little with spatial position, so equation (

Equations (
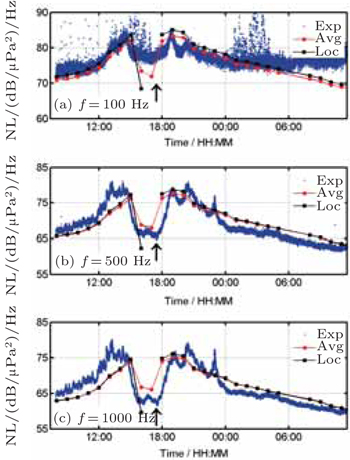
To verify the feasibility of the theory model, typhoon-generated noise data collected during an experiment are analyzed in the 100 Hz–1000 Hz frequency band as typhoon “Krosa” passed over a hydrophone from October 31, 2013 to November 2, 2013. The hydrophone was deployed at 1030m with a water depth of around 3.8 km. Figure
 | Fig. 4. (a) Distance from the typhoon center to the receiver; (b) NL at 100 Hz, 500 Hz, and 1000 Hz. |
Typhoon “Krosa” passes the receiver almost overhead, only 3 km away from the receiver, and the eye wall of the typhoon passes over the receiver and cuts a swash through the whole storm. The measured acoustic intensity at 100 Hz, 500 Hz, and 1000 Hz as shown in Fig.
Predictions from both two approximations(the average wind speed approximation and the local wind speed approximation) are compared with measured noise intensities in Fig.
Figure
Statistic analysis of intensities at peaks and off-peaks is carried out to demonstrate the wind and frequency dependence.
The logarithm of noise intensity for experimental data versus 10log10f at the peak and the off-peak point is exhibited in Fig.
In Ref. [23], there is a power law relationship between the local wind speed and the underwater noise intensity, written as

Figure
In summary, an analytical typhoon-generated noise model is developed in this paper. It is concluded that when the eye is far away from the receiver, the local wind speed is the dominant factor for the typhoon-generated noise intensity; however, when the eye is near the receiver, the average wind speed becomes dominant. Experimental data gathered during a typhoon were processed to validate the present model. The data/model comparison indicates that the typhoon has a greater impact on the noise spectral level at high frequencies than at low frequencies in the frequency range of 100 Hz–1000 Hz. The “bi-peak” structure is observed from experimental data, and is explained by the present model. Experimental data analysis supports the frequency dependence assumption, with the index p = −0.85. The power-law wind speed dependence is also verified by comparing experimental data and predicted data with n = 3. The preliminary evaluation of 500 Hz and 1000 Hz shows reasonable agreement between the model and experimental data. However, much more extensive prediction evaluations for more experimental data sets are required to verify the present model.
| 1 | |
| 2 | |
| 3 | |
| 4 | |
| 5 | |
| 6 | |
| 7 | |
| 8 | |
| 9 | |
| 10 | |
| 11 | |
| 12 | |
| 13 | |
| 14 | |
| 15 | |
| 16 | |
| 17 | |
| 18 | |
| 19 | |
| 20 | |
| 21 | |
| 22 | |
| 23 |


