Model/data comparison of typhoon-generated noise
Wang Jing-Yan, Li Feng-Hua†, 
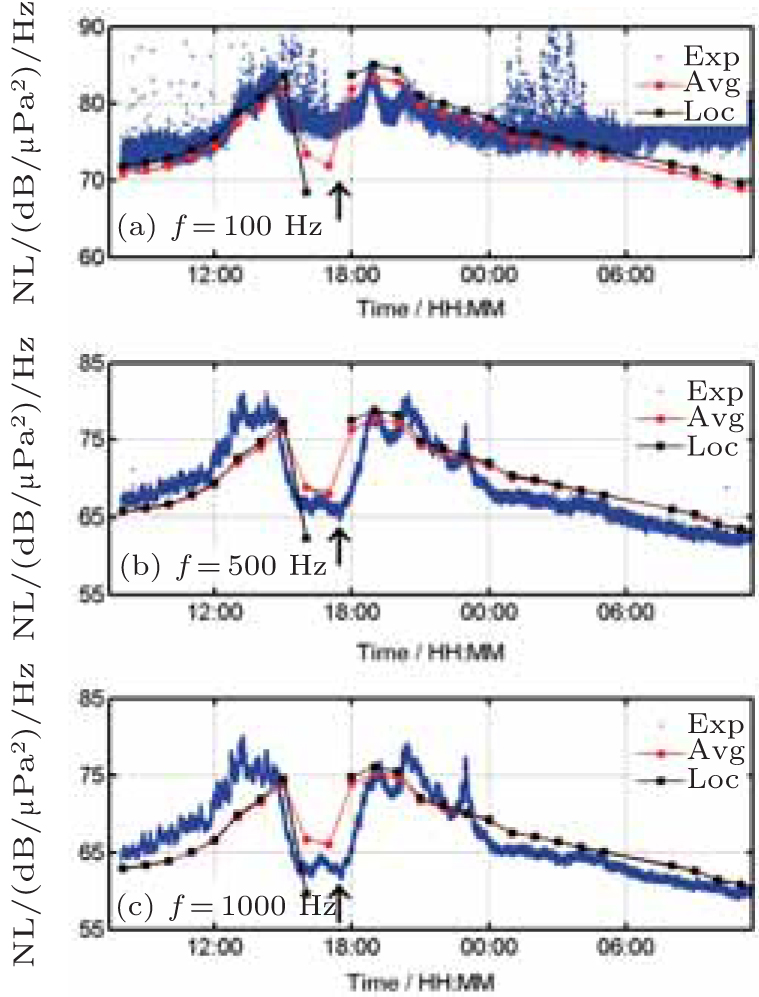
Noise spectral intensity levels at (a) 100 Hz, (b) 500 Hz, and (c) 1000 Hz. The dash lines with circles and squares correspond to Eqs. (
Model/data comparison of typhoon-generated noise |
|
Wang Jing-Yan, Li Feng-Hua†,
|
Noise spectral intensity levels at (a) 100 Hz, (b) 500 Hz, and (c) 1000 Hz. The dash lines with circles and squares correspond to Eqs. ( |
| |