Liang Chenliang, Liu Weili, Li Shasha, Kong Hui, Zhang Zefang, Song Zhitang. A nano-scale mirror-like surface of Ti–6Al–4V attained by chemical mechanical polishing. Chinese Physics B, 2016, 25(5): 058301
Permissions
A nano-scale mirror-like surface of Ti–6Al–4V attained by chemical mechanical polishing
Liang Chenliang1, 2, Liu Weili1, †, , Li Shasha1, 2, Kong Hui1, 2, Zhang Zefang1, Song Zhitang1
State Key Laboratory of Functional Materials for Informatics, Shanghai Institute of Micro-system and Information Technology, Chinese Academy of Sciences, Shanghai 200050, China
University of the Chinese Academy of Sciences, Beijing 100049, China
Project supported by the National Major Scientific and Technological Special Project during the Twelfth Five-year Plan Period of China (Grant No. 2009ZX02030-1), the National Natural Science Foundation of China (Grant No. 51205387), the Support by Science and Technology Commission of Shanghai City, China (Grant No. 11nm0500300), and the Science and Technology Commission of Shanghai City, China (Grant No. 14XD1425300).
Abstract
Abstract
Metal Ti and its alloys have been widely utilized in the fields of aviation, medical science, and micro-electro-mechanical systems, for its excellent specific strength, resistance to corrosion, and biological compatibility. As the application of Ti moves to the micro or nano scale, however, traditional methods of planarization have shown their short slabs. Thus, we introduce the method of chemical mechanical polishing (CMP) to provide a new way for the nano-scale planarization method of Ti alloys. We obtain a mirror-like surface, whose flatness is of nano-scale, via the CMP method. We test the basic mechanical behavior of Ti–6Al–4V (Ti64) in the CMP process, and optimize the composition of CMP slurry. Furthermore, the possible reactions that may take place in the CMP process have been studied by electrochemical methods combined with x-ray photoelectron spectroscopy (XPS). An equivalent circuit has been built to interpret the dynamic of oxidation. Finally, a model has been established to explain the synergy of chemical and mechanical effects in the CMP of Ti–6Al–4V.
The metal titanium (Ti) and its alloys have been utilized since the 1950s. Owing much to less density and much stronger specific strength than steel, titanium alloys are becoming more and more important as load-bearing materials especially in an extreme environment like aviation.[1–3] In medical science, titanium alloys work as man-made teeth and joint thanks to their excellent resistance to corrosion and biological compatibility.[4–12] The last decade has witnessed a flourishing of the introduction of titanium to microelectronics and micro-electro-mechanical systems (MEMS).[13–16]
The wide use of metal titanium and its alloys calls for an effective method to achieve surface planarization of the nano-scale. Many researchers have studied the relationship between surface roughness and the device performance of Ti alloys (especially Ti64).[17,18] These studies demonstrate that the device performance can be improved dramatically by a smoother surface. Traditionally, the planarization of metal Ti relies on mechanical polishing, chemical polishing, and electrochemical polishing. Mechanical polishing, an ancient metal process, has been used for thousands of years, while its machine accuracy cannot reach the nano-size and it often leaves surface defections on metal. Chemical and electrochemical polishing do well in machine accuracy, however, the chemical matters used in these processes (like cyanide) are always poisonous to people and the environment. Chemical mechanical polishing (CMP), an amazing combination of mechanical polishing and chemical polishing, shows its potential in nano-size metal planarization. Up to now, it is the only method to provide a global nano-scaled planarization.
In this study, we discuss the basic behavior in CMP process of Ti64 alloy, which is the most widely used Ti alloy.[19–21] The mechanical and chemical aspects are both involved in our study. Finally, we propose a possible mechanism in the CMP of Ti64, focusing on the rate controlling step in CMP.
2. Experimental procedures
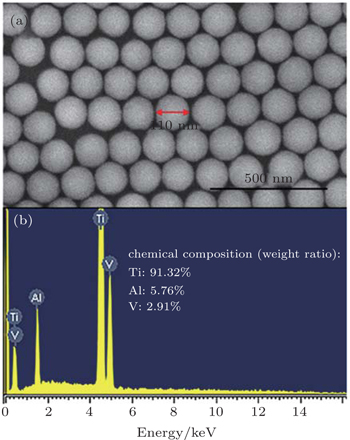
Polishing slurries were prepared by first adding ethylenediaminetetraacetic acid disodium (EDTA-2Na) to deionized (DI) water until dissolved, immediately followed by the mixture with colloidal silica under successive stirring. EDTA-2Na was used as the chelating agent to capture free metal cations in solution so that the bulk concentration of metal cations could keep a low level. The colloidal silica has a diameter of about 110 nm (Fig. 1(a)), which was made by an ion-exchange method. Next, hydrogen peroxide (H2O2) of 30 wt.% was added in as the oxidant. The amount of H2O2 was precisely calculated and controlled. Finally, DI water was added to dilute the slurries to the desired concentration, and a small amount of sodium hydroxide solution was used as a pH adjustion. The final compositions of the slurries are listed in Table 1.
Fig. 1. (a) The colloidal silica particles used as abrasive particles in this study; (b) the chemical composition measured by the EDS.
Table 1.
Table 1.
Table 1.
The compositions of slurries used in the polishing experiments.
.
Solid content (SiO2/slurry)
pH
EDTA-2Na
Oxidant
Others
20 wt.%
9.5
0.1 wt.%
0–5 wt.%
DI water
Table 1.
The compositions of slurries used in the polishing experiments.
.
The Ti64 alloy was cut into circular pieces of 1 inch in radius. The element composition was analyzed using energy dispersive spectroscopy (EDS, see Fig. 1(b)). Polishing experiments were performed on the polishing machine of CP-4 (Bruker). All polishing experiments lasted for enough time (10 minutes). During the polishing process, the pressure and rotation speed were varied to test the mechanical response. The mass of the alloy was measured before and after polishing, utilizing a balance (MettlerToledo-XS205DU, 0.01 mg precision). The material removal rate (MRR) was calculated by
Here, A is the nominal contacting area, T is the polishing time, and ρ is the bulk density of the polished alloy, which was attained by the Archimedes buoyancy principle. Every polishing experiment was repeated three times, and the mean value was calculated. Meanwhile, the surface morphologies of the post-polished alloy were observed by optical microscopy (Nikon-LV150), scanning electron microscopy (Hitachi-S4700), and atomic force microscopy (AFM, Park XE 150).
To probe the possible oxidation mechanism of Ti64 during CMP, electrochemical impedance spectroscopy (EIS) combined with linear polarization (LP) was used. The measurement was accomplished by an Autolab electrochemical workstation, with a three-electrode cell. An Ag/AgCl (in 3M KCl) electrode worked as the reference electrode, and a piece of platinum foil (1.5 × 1.5 cm2) worked as the counter electrode. The exposed area of metal to electrolyte is confined within unit area. The EIS measurements were applied at open circuit potential (OCP) of Ti64. A sine wave (±5 mV around OCP) as the perturbation signal was put into the measured system and the output signal was recorded by the computer. The frequency of input signal varied from 1 kHz to 0.1 Hz. Nyquist plots as results were shown to obtain an equivalent circuit which simulated the dynamic model of oxidation. Following the EIS test, LP was applied to obtain the message of corrosion potential (Ecorr) and corrosion current (Icorr). The scan was from −0.4 to 0.4 V (around OCP), with the scan rate being 1 mV/s.
Finally, the XPS (Axis Ultra DLD) was applied to analyze the valence state of metal atom as a support evidence to deduce the possible chemical reaction during CMP and the composition of oxide film.
3. Results and discussion
3.1. Mechanical aspect
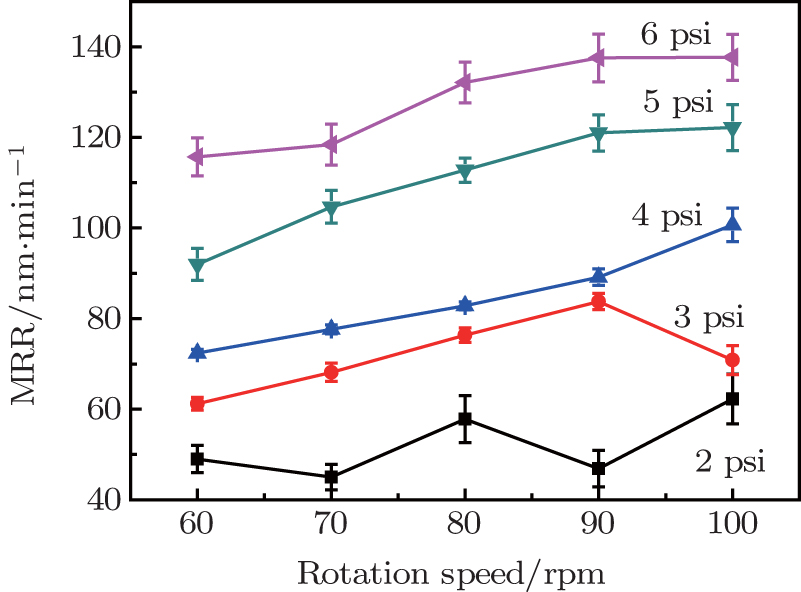
The mechanical response of Ti64 during the CMP is diagramed in Fig. 2. The mechanical response is linear under rather wide ranges of pressure and rotation speed, while under low pressure like 2 psi (1 psi = 6.895 kPa), the polishing machine cannot hold the metal so well that a fluctuation is shown as the rotation speed increases from 60 rpm to 100 rpm. Under extremely high pressure like 6 psi, however, the polishing machine began to quiver regularly, which indicates that the pressure may be beyond the tolerance of the machine. As a result, moderate pressure and rotation speed (4 psi and 80 rpm) were chosen in successive experiments.
Fig. 2. The mechanical response of Ti64 during CMP.
The linear mechanical response in CMP can be well described by Preston’s law, which is
Here, P is the normal pressure applied on the wafer, and V is the relative velocity between the wafer and the pad. The most complex factor in Eq. (2) is the Preston coefficient Kp, which is determined by the chemical composition of slurry, the size and hardness of abrasive particles, the surface equality of the polishing pad, and so on.[22–25] Fortunately, in our case, Kp is independent of P and dV, for the lines in Fig. 2 are almost straight and parallel to each other (4–6 psi, 60–90 rpm).
3.2. Chemical aspect: Effects of oxidant
The chemical reactions are even more important in CMP than mechanical interaction. To have a basic understanding of the chemical mechanism in the CMP of Ti64, we restricted the possible reactions to be only the oxidation process and H2O2 was chosen as the oxidation agent. The effect of concentration of H2O2 on the MRR was studied, as shown in Fig. 3.
Fig. 3. The effect of oxidant on MRR in the CMP of Ti64.
It is obvious that H2O2 plays an important role in the CMP of Ti. When the slurry contains no oxidation agent, the MRR is neglectable. As H2O2 is added in the slurry, however, the MRR dramatically increases, and reaches its peak value of 83.05 nm/min when c[H2O2] is 1.25 wt.%. The curve shows a plateau when c[H2O2] is higher than 1.25 wt.%, which means that the oxidation effect has come to its maximum and there is an equilibrium between growth and removal of the oxide layer. Thus, we can assume that the oxidation layer is the main object removed by SiO2 particles during the CMP.
3.3. Electrochemical aspect
To probe the possible chemical reactions that possibly occur on the surface of Ti64 during the CMP, electrochemical tests were applied. The experimental details have been described in the experimental section. It is important to note that all the solutions under test are without abrasive particles so that the mechanical effects from those particles can be excluded. The other chemical properties of the solutions like the concentration of oxidant, pH, and ionic strength were adjusted to simulate the slurries used in the CMP. The EIS tests were performed under the OCP. For clarity, only five curves are illustrated (c[H2O2] = 0, 0.25 wt.%, 1 wt.%, 2 wt.%, and 3 wt.%). Before analyzing, we have applied K–K transform test on the data. As is clearly shown in Fig. 4, the Nyquist diagram is a single semi-circle above the Z′ axis which indicates that there is an oxide layer between the bulk metal and the solution acting as a capacitor.[26] The typical response frequency of the oxide layer is about 0.25 Hz. The equivalent circuit deduced from the result of EIS has also been pictured in Fig. 4. The detailed values of each element in the equivalent circuit are listed in Table 2.
Fig. 4. The EIS of Ti64 in different concentrations of H2O2 and the proposed equivalent circuit.
Table 2.
Table 2.
Table 2.
The values of each element in the equivalent circuit in Fig. 4.
.
c[H2O2]/%
Rs/Ω·cm−2
Rct/Ω·cm−2
QOX/μ Ω−1·cm−2·s−α
α
χ2/10−3
0
386.1
18943
40.108
0.92239
2.847
0.25
739.1
20676
37.92
0.91825
3.309
0.5
857.3
9346
40.913
0.92620
4.131
0.75
1087.6
11554
39.82
0.92025
2.894
1.0
1057.1
10481
40.974
0.92257
2.462
1.25
874.8
6617.2
47.699
0.92464
2.859
1.5
825.5
5324.4
48.904
0.92374
2.879
2.0
802
4560.7
47.293
0.92018
1.567
2.5
751.5
2922.9
48.913
0.92283
2.095
3.0
717.6
2663.9
48.762
0.92261
2.179
Table 2.
The values of each element in the equivalent circuit in Fig. 4.
.
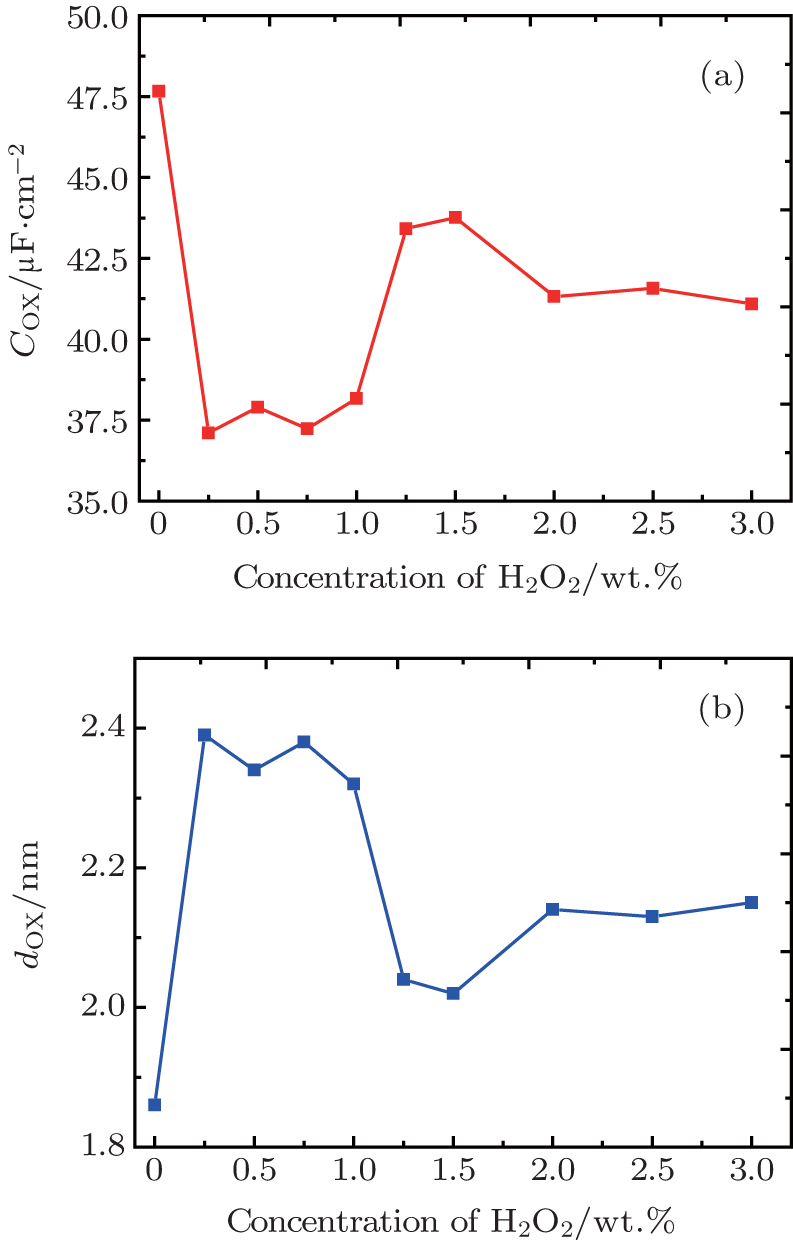
It is obvious that the oxide layer acts as a constant-phase-element (CPE) more than an ideal plate capacitor. The α values in Table 2 are all around 0.92, which clearly shows the deviation. The CPE behavior is, according to Orazem,[26] generally attributed to a distribution of time constants in the direction normal to the electrode surface due to varying oxide composition. In terms of many other reports concerning the oxide films on titanium (for both metal and alloys), the passive film of this kind of valve metal appears as a very “capricious” formation. Different from the deemed impacted passive film consisting of pure TiO2, the real oxide film consists of two parts: a TiO2 layer adjoining solution and intermediate oxide layer (mainly composed of Ti2O3) close to the metal side.[27–31] It is easy to calculate the capacities in each concentration of H2O2 from the data in Table 2 by using Brug’s formula,[32] and the results are diagramed in Fig. 5(a). The stoichiometric variation in the direction normal to the electrode surface makes it difficult to precisely calculate the thickness of the oxide film. However, to the first approximation, the dielectric constant ε of the oxide film can be considered to be a constant (∼ 100),[26] thus we can estimate the thickness d by using d = εε0/C, in which ε0 is the permittivity of a vacuum (8.854 × 10⁻¹⁴ μF·cm−1). Figure 5(b) shows the thickness d as a function of the concentration of H2O2 in solution. The thickness obtains its peak value when the concentration of H2O2 is between 0.25 wt.% and 1 wt.%, but it is virtually constant within the range of 1.8–2.4 nm. This is a rather thin depth that one abrasive particle can easily penetrate under pressure. Thus, the MRR should be independent of c[H2O2] if the reformation rate of the oxide film is independent of c[H2O2]. Note that the MRR increases with c[H2O2] in Fig. 3, which cannot be interpreted by the results from the EIS, one may predict that the reformation rate of passive film increases with c[H2O2]. To verify this hypothesis, LP tests were applied.
Fig. 5. (a) The capacity of the oxide layer as a function of c[H2O2]; (b) the calculated thickness of the oxide layer as a function of c[H2O2].
The LP results are pictured as Fig. 6(a). It is clear that the Tafel curve of Ti64 successively moves to bottom right when c[H2O2] increases from 0 to 3 wt.%. Corrosion potentials (Ecorr) and corrosion currents (Icorr) derived from Fig. 6(a) are pictured in Fig. 6(b). As is shown in Fig. 6(b), with increasing concentration of H2O2, Ecorr first sharply jumps to −25 mV, then slowly becomes more negative (the absolute value becomes larger), and finally remains approximately constant at −115 mV, still smaller than the origin value of −250 mV. Considering the role of H2O2 as an oxidant in the reaction, it is not difficult to realize that the metal is anodized by H2O2 and oxide film is formed. The oxide film between metal and solution, separates metal from the attack of oxidant and suppresses deep-going oxidization, so the Ecorr remains at a constant value. As is clearly shown in Fig. 6(b), Icorr increases with the amount of oxidant in electrolyte. In opposition to Ecorr, which describes the thermodynamic stability, Icorr describes the kinetic equilibrium of passivation–depassivation. The reformation rate of passive film, which can be described by the reaction rate r, is directly proportional to Icorr, which is
(a) The Tafel curves of Ti64, with the scanning rate being 1 mV·s−1; (b) the corrosion potential and corrosion current deduced from the data above.
Here, n is the number of electrons transferred and F is the Faraday constant. Larger value of Icorr indicates faster formation of passive film (faster depassivation as well), which means that the passive film can reform as soon as it is removed by abrasive particles. Along with the results from EIS, the LP results explains why the increasing tendency of MRR with c[H2O2] in Fig. 3. A detailed explanation will be given after the results of XPS.
3.4. XPS results
XPS can track the target element and show its valance state. Figure 7 shows the results of XPS experiments. Figures 7(a) and 7(b) are the survey spectra of post-polishing Ti64, on the surface and in the depth of 10 nm, respectively. It is clear that on the surface, the strength of O 1s characteristic peak is much stronger than the Ti 2p, while in the depth of 10 nm this relationship reverses. This indicates that the overwhelming majority of the O element on the surface is the result of the oxidation reaction. Figures 7(c)–7(e) show the spectrums of Ti, Al, and V on the surface. The Ti 2p spectrum represents a rather complex peak which can be divided into several parts: the majority is TiO2 at about 458.8 eV, while small amounts of Ti2O3 (456.7 eV) and Ti (453.9 eV) still exist.[33–35] This is back-up evidence that the oxide film on Ti64 alloy deviates from stoichiometric TiO2 as has been already pointed out in the EIS results. However, things occuring to Al and V are comparatively much simpler. The Al 2p spectrum in Fig. 7(d) is at 74.3 eV, which is the characteristic peak of Al2O3. [33] The V atoms seem to be inert, for the spectrum in Fig. 7(e) stays at 512.8 eV, the characteristic peak of pure element adsorption V.[33] Figure 7(f) shows the O1s spectrum, divided into three parts: O in −OH (H), adsorption (A) and lattice (L).[34,35] It is clear from Fig. 7(f) that L is minority compared with H and A, again indicating that the surface oxide layer is at an amorphous, disorder, and nonstoichiometric status. The amount ratio of the three kinds of O element can be calculated by integration of the three peaks, which is H : A : L = 0.61: 0.29 : 0.1.
Fig. 7. The XPS spectra of (a) wide-range scanning on surface; (b) wide-range scanning in 10 nm depth; (c) Ti on surface; (d) Al on surface; (e) V on surface; and (f) O on surface.
3.5. The synergy of chemical and mechanical effects
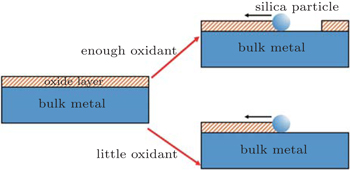
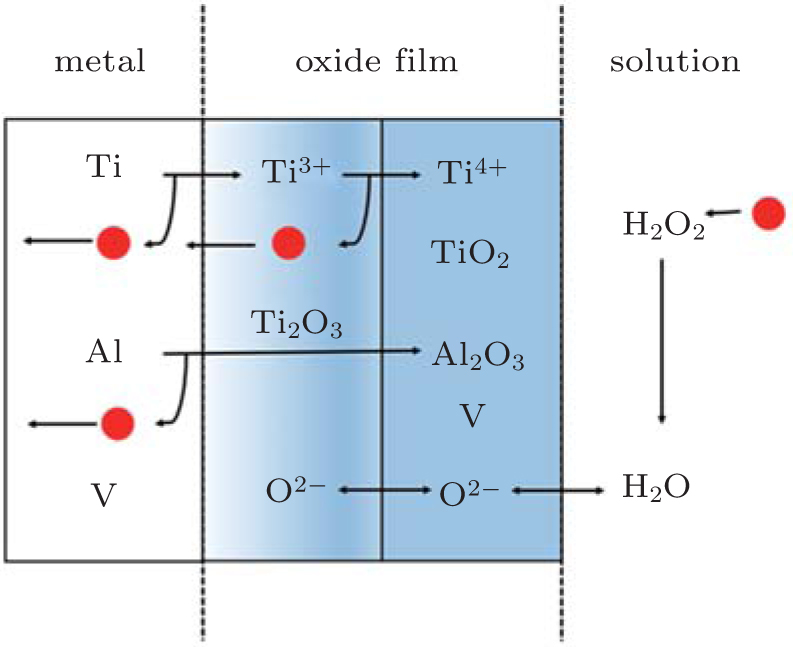
From the analysis above we can get a whole perspective of the CMP process of Ti64. Understanding the rate controlling step in CMP is the key point to combining the polishing results and electrochemical results together. The oxidation agent H2O2 plays an important role in CMP. It is the acceptor of electrons released by metal atoms, and leaves anamorphous, disorder, and nonstoichiometric oxide layer (Fig. 8). Then the abrasive particles intrude on the oxidation layer under the applied pressure and plow to remove it until the fresh, un-oxidized metal layer is exposed. The fresh metal then meets H2O2 and becomes oxidized. The thickness of oxide film is almost independent of the amount of oxidant in the solution (Fig. 5(b)). Noticing that the reformation rate of the oxide layer is sufficiently slow in low concentration of H2O2 (Fig. 6(b)), it is not difficult to understand why MRR is small in low c[H2O2]. Oppositely, when there is more H2O2 in the solution, the oxide layer can reform as fast as it is removed, so the MRR increases with c[H2O2]. Roughly speaking, the chemical reaction is the rate controlling step in the CMP of Ti64 when c[H2O2] < 1 wt.%. When there is enough H2O2 in the solution, the mechanical remove effect becomes the rate controlling step. Here the rotation speed is fixed, which means the number of abrasive particles plowing through the substrate does not change too much. Also, the fixed applied pressure ensures a fixed depth so that each particle can intrude into the substrate. As a result, the maximum amount of substance removed by the abrasive particles is fixed so that the MRR keeps constant as shown in Fig. 3. To enhance MRR, one has to speed up the rotation or apply higher pressure, just like Fig. 2. These processes have been illustrated in Fig. 9. Generally speaking, which of the chemical reactions and mechanical removal is the rate controlling step, is the key question throughout the whole CMP process.
Fig. 9. The model of synergy of chemical and mechanical effects. An oxide layer forms on the metal surface, then it is removed by abrasive particles. When there is enough oxidant in solution, the oxide layer can reform as soon as possible, so the MRR is high. However, when the amount of H2O2 is little in solution, the oxide layer cannot form again on time when the fresh metal is exposed.
3.6. Surface morphology and roughness of polished Ti64
On the basis of the results above, we optimized the polishing parameters (4 psi, 80 rpm, and c[H2O2] is 1.25 wt.%) and applied them on Ti64. Figure 10 depicts the final information of surface morphology and roughness under optimized conditions. Figure 10(a) is a photograph of Ti64 after polishing. It has an almost perfect mirror surface as the reflection of objects is clearly recognized. Figure 10(b) shows the surface morphologies of polished Ti64 given by optical microscopic. Few defections can be found even at the magnification of 60.0 K. The roughness of polished Ti64 is measured by AFM and the result is shown in Fig. 10(c). The root mean square roughness RMS is not higher than 1.899 nm, which signifies that the flatness is nano-scale.
Fig. 10. The surface morphology of polished Ti64 by (a) photograph; (b) optical microscope; and (c) AFM result, with the root mean square roughness RMS not exceeding 1.899 nm.
4. Conclusion and perspectives
We have achieved a mirror-like surface of Ti64 by chemical mechanical polishing, which was in flatness of nano-scale. The CMP of Ti64 was studied in both mechanical and chemical aspects, and the parameters in the CMP process have been optimized. MRR increases with pressure, rotation speed, and the concentration of oxidant in slurry, and it can reach 100 nm/min. Meanwhile, the roughness was rather low. The chemical reactions during the CMP were studied by the electrochemical method. We have found that the thickness of the oxide layer is independent of c[H2O2] by utilizing EIS. The faster MRR is attributed to the fast reformation rate of oxide layer in enough concentration of H2O2 with the aid of LP. The composition of oxide layer is obtained by XPS, whose result coincides with EIS. Finally, we have proposed a possible model focusing on the rate controlling step during the CMP of Ti64.


 , Li Shasha1, 2, Kong Hui1, 2, Zhang Zefang1, Song Zhitang1]