

Field-induced phase transitions in chiral smectic liquid crystals studied by the constant current method
[Dhaouadi H†,  , Zgueb R, Riahi O, Trabelsi F, Othman T]
, Zgueb R, Riahi O, Trabelsi F, Othman T]
|
|


† Corresponding author. E-mail:
In ferroelectric liquid crystals, phase transitions can be induced by an electric field. The current constant method allows these transition to be quickly localized and thus the (E,T) phase diagram of the studied product can be obtained. In this work, we make a slight modification to the measurement principles based on this method. This modification allows the characteristic parameters of ferroelectric liquid crystal to be quantitatively measured. The use of a current square signal highlights a phenomenon of ferroelectric hysteresis with remnant polarization at null field, which points out an effect of memory in this compound.
Chiral smectic liquid crystal product is organized in layers and has a helical structure. Because of the chirality and the molecular tilt with respect to the layer normal, the compound presents for some of its mesophases a ferroelectric character. The use of an SSFLC cell makes it possible to highlight this ferroelectric character.[1] During cooling, an increasing tilt angle θ is observed. One can also observe a subset of the following subphases: the SmA with θ = 0; the 


In such compounds, the phase transitions can be induced as well by changing temperature by applying an electric field. A rise in the module of the applied field induces always a transition towards a SmC* state where the helix is completely unwound.[6,7]
The applications of chiral smectic liquid crystals to several fields of technology imperatively require the knowledge of the field thresholds and the temperatures of the transitions. Consequently, a chart must be drawn in plan (E,T) in order to locate various domains of the phases and the lines which separate them. Several experimental methods are used to carry out this work, such as electro-optical method,[8,9] the dielectric spectroscopy method,[10–12] and finally the constant current method that was announced first by Marcerou.[13]
The complexity and the richness of the phase sequences of a chiral smectic liquid crystal support the appearance of several phenomena accompanying the phase transitions. Hysteresis phenomenon was observed each time and the optics or electric answers following an electric excitation were studied.[8,14,15] Metastable states were observed in mixtures[16] and recently a phenomenon of coexistence was highlighted.[17,18]
In this work we make a slight modification to the measurement principles based on the constant current method. This modification allows certain characteristic parameters of chiral smectic liquid crystals like the dielectric permittivity and the spontaneous polarization to be quantitatively measured. According to these new principles, measurements of these last parameters are conducted on two chiral smectic liquid crystal compounds belonging to a series of fluorinated compound CnF3 (n = 10; 12)[19,20] and on a reference product (MHPOBC[21]). A comparison of the measurements obtained by the constant current method with those obtained by the electro-optical one is carried out.[21,22]
Initially, we detail the principle of the constant current method. For that we introduce the thermodynamic considerations which lead to the development of this technique. A new rule of phase must be considered, making it possible to explain the appearance of coexistence of phases in the samples during a transition under electric field. Then we present the new measurement principles of the effective permittivity and the spontaneous polarization. With a square current signal, a ferroelectric hysteresis phenomenon is revealed. A remnant polarization, at null field, is observed.
Before presenting the principle of the constant current method, we review the results of mean-field theory of the para-ferroelectric phase transition. Polarization P of the sample constitutes the order parameter of this transition. The Landau free energy is expressed according to P as


One can notice easily that ε diverges at Tc. Then, to locate these phase transitions one can either measure polarization P according to the temperature (P vanishes at Tc) or observe the variation of the dielectric permittivity ε according to the temperature (ε shows divergence at Tc).
The useful thermodynamic parameters of a system are in practice the pressure P, the volume V, the temperature T, and the entropy S. For studying the chiral smectic liquid crystals, one must consider two other parameters: the electric field E (intensive variable), with which one associates the electric excitation D (extensive variable brought back to the unit of volume). The qualitative description of a chiral smectic liquid crystal is thus made with the three intensive variables P, T, and E. The presence of these three intensive variables P, T, and E leads to changing of the rule of phase which gives the variance of the system ϑ,

If one crosses at constant temperature, in the (E,T) diagram, a curve separates two different phases of a chiral smectic liquid crystal and the two phases coexist if the transition is of first order (ϑ = 2). As one works at constant temperature and pressure, one will have δE = 0. During the transition the electric field remains constant. This study constitutes the guiding principle of the constant current method that we will discuss in the following.
One deals with a phase transition between two tilted smectic phases with a different value of the polarization which are confined and aligned in the planar geometry in a capacitor of thickness e in order to apply an electric field parallel with the layer planes. If this capacitor is connected to a generator delivering a constant current of intensity
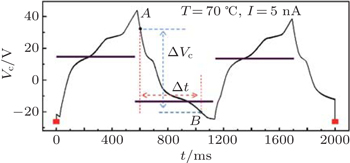
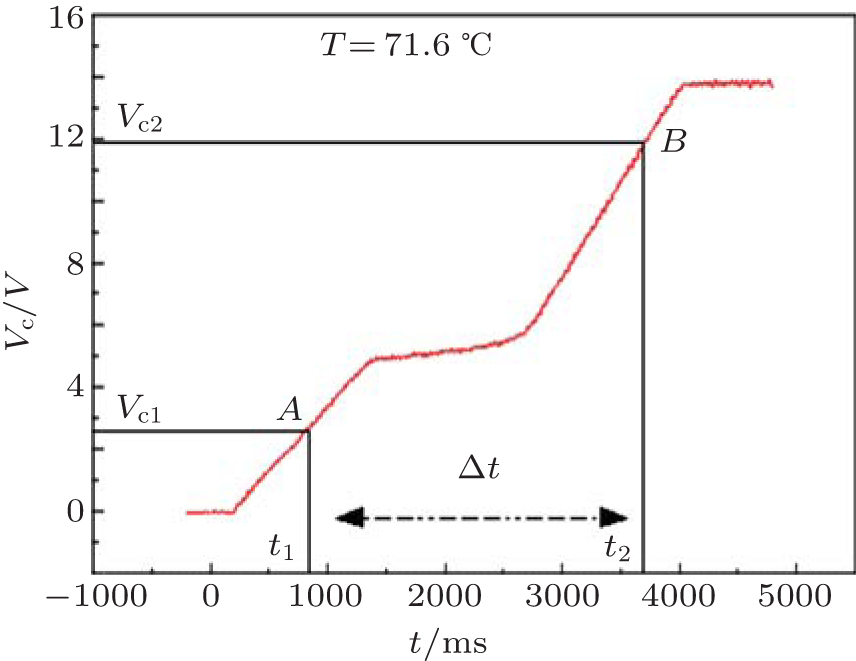 | Fig. 1. Time dependence of Vc (constant current signal) for product C10F3 with a cell thickness of 5 μm and a constant current intensity of 5 nA. The slopes of the linear parts allow the values of εeff before and after the transition to be measured. The measurements of Δt and ΔVc on both sides of a plateau make it possible to measure ΔPs. |
The values of slope τ of the linear parts of the curve depend on the static permittivity εeff as given below[13]

The width of the plateau Δt is directly related to the variation of spontaneous polarization ΔPs before and after the transition.
At any time, problems during measuring εeff and ΔPs are met. Indeed, because of the dependence of εeff on the electric field and the influence of a possible weak conduction of the cell in addition to surface effects, the linear parts become increasingly curved for increasing strong fields and it is not always possible to identify the beginning and the end of a plateau. Moreover, in the majority of cases, this plateau is not horizontal
Now, we present the principle of a measurement of εeff as well as a slight modification in the formula which allows the deduction of ΔPs. The measurements of the slopes τ of the linear parts of the curves presented in Fig.


To make an acceptable measurement of the permittivity in the unrolled SmC* phase, obtained at strong field, one uses a generator of current which delivers a periodic square signal of weak frequency. The answer that one obtains is a rectangular signal distorted by the plateaus corresponding to the phase transitions (Fig.


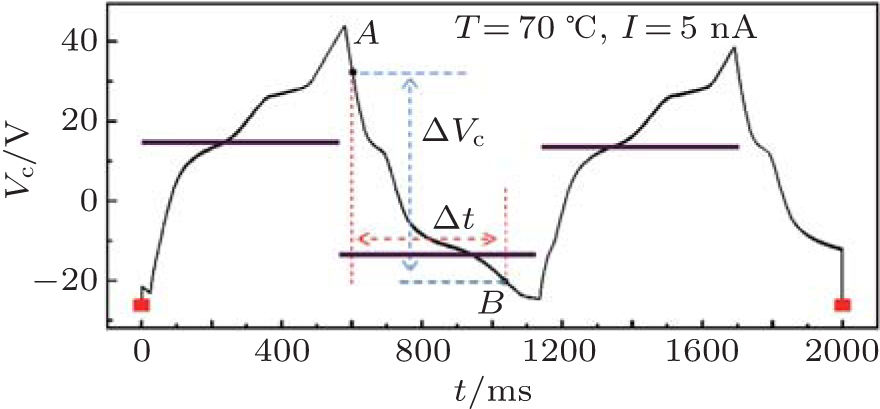 | Fig. 2. Time dependence of cell voltage Vc (product C10F3 with a cell thickness of 5 μm and a current square signal of ±5 nA). The slope of the linear part at the beginning of the rise allows a measurement of εeff in the unrolled SmC* phase. The measurements of Δt and ΔVc on both unspecified points (A and B) make it possible to determine ΔP. Colored lines represent the square current signal. |
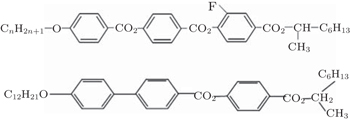
The liquid crystals studied were chiral smectic compounds named C10F3 and C12F3 belonging to the series of fluorinated products, CnF3 (n = 10,12), synthesized by Essid et al.[19] and Manai.[20] For comparison, an experiment on a reference product (MHPOBC[21]) was carried out. The molecular structures of these compounds are shown in Fig.
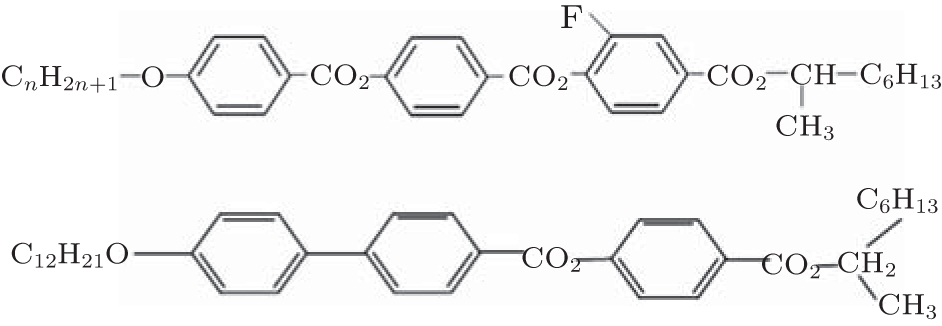 | Fig. 3. Molecular structures of liquid crystals (CnF3), n = 10, 12; MHPOBC. |
For these compounds, the zero field phase sequences are as follows: For the product C10F3,

A polarizing microscope (Leitz Model Laborlux 12 Pols) was used to observe different liquid crystalline mesophases. Measurements were carried out on commercial cells (EHC, Japan) coated with a conductive layer of indium-tin oxide (ITO) and treated by polyvinyl alcohol (PVA) indirectly rubbed to ensure a planar alignment. The active area is 25 mm2. At the isotropic phase, the liquid crystal was introduced by capillarity into the cell. The 5-μm and 8-μm cells were used for measurements. The sample cell was placed between crossed polarizers, with the smectic layer normal being parallel to one of the polarizers. The sample texture was automatically monitored with a digital camera mounted on the microscope. The temperature regulator was provided by a programmable DC power supply (HP E3632A), a programmable multimeter (Keithley Model 2000) and an oven developed in our laboratory. The temperature was controlled to be within ±0.01 °C.
A generator of current (Keithley 6200) delivers a constant current
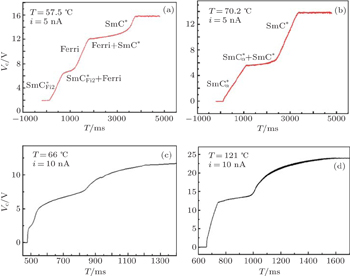
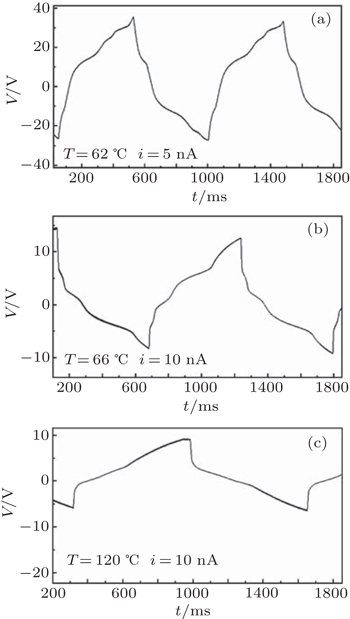
Here we present some curves showing the evolutions of the cell voltage with time under a constant current, for product C10F with a cell thickness of 5 μm and i = 5 nA (Figs. 
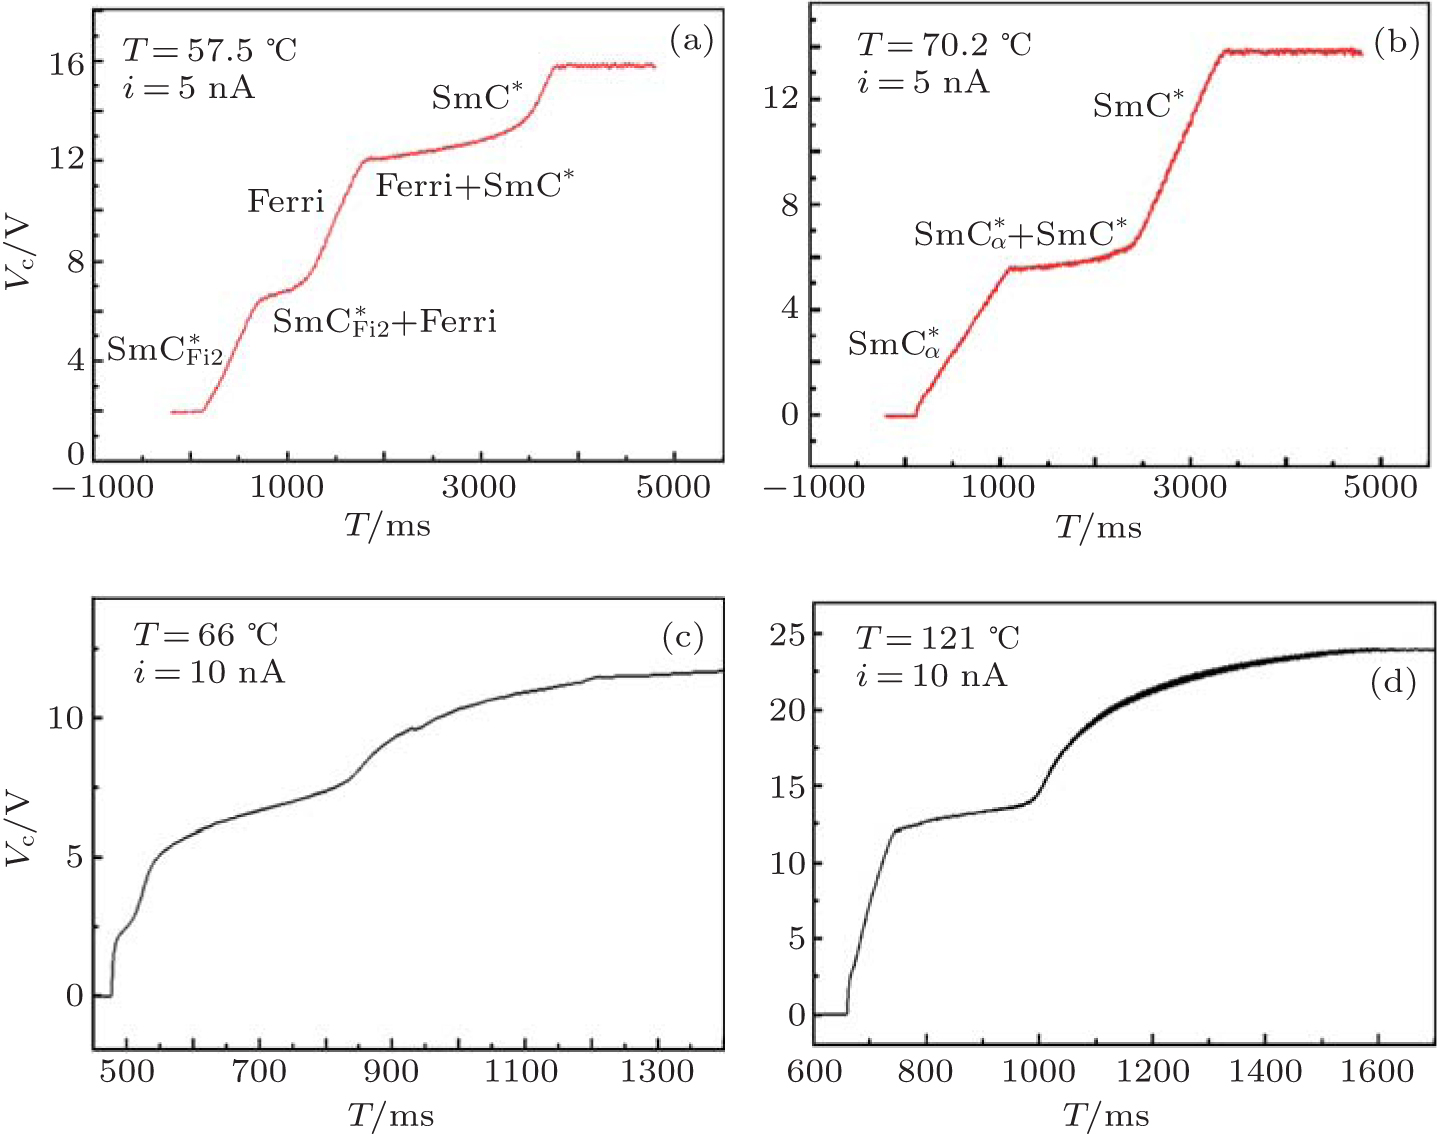 | Fig. 4. Time dependences of cell voltage Vc (constant current signal) for (a) and (b) product C10F3 with a cell thickness of 5 μm and i = 5 nA, (c) product C12F3 with a cell thickness of 8 μm and i = 10 nA, and (d) product MHPOB with a cell thickness of 5 μm and i = 10 nA. |
Monotonic increase at the initial phase with a slope being inversely proportional to the dielectric constant is due mainly to the charge of the capacitor. Plateaus correspond to the first order transitions. At these places the electric charges are used to compensate for the static polarization whose value changes. When the local field reaches its value
For the compound C10F3, figures
Because of the weak conductivity in the cells, the linear parts become increasingly curved for increasing strong field. This is clearly observed in Figs.
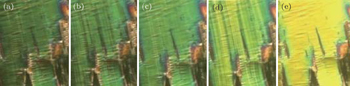
We need to record the evolution of the texture of the sample during a slow triangular variation of the cell voltage (Fig.
 | Fig. 5. Evolutions of the texture which have the C10F3 compound at temperature 60 °C, followed by a linear variation of the electric field, for (a) phase   |
The intermediate phase is the subject of a lot of research works to understand the origin and determine its structure. Jarad et al.[23] have measured the resonant x-ray diffraction and have shown that this phase is composed of three layers but the average orientation differs from that of common 
We present in Figs.
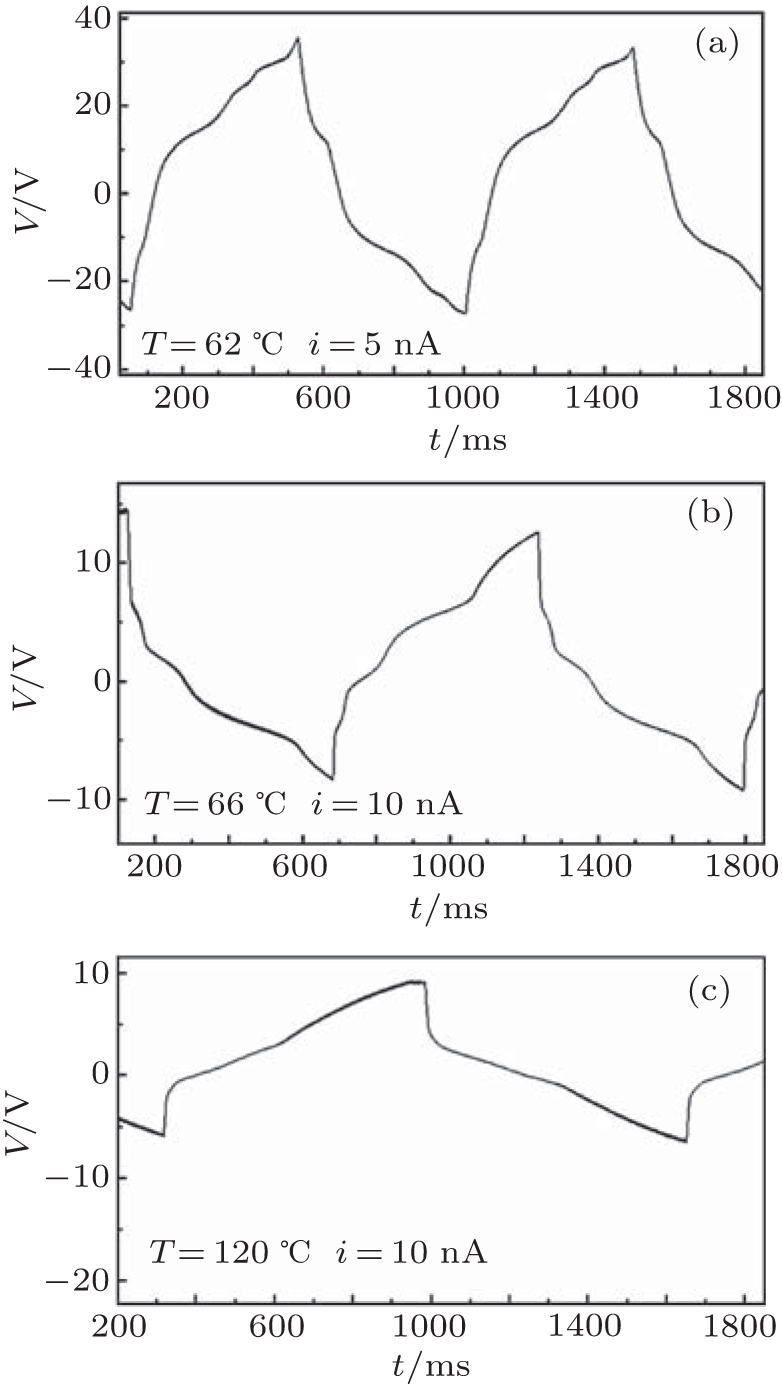 | Fig. 6. Time dependences of cell voltage (square current signal). Panel (a) is for product C10F3 with a cell thickness of 5 μm and i = 5 nA, panel (b) for product C12F3 with a cell thickness of 8 μm and i = 10 nA and panel (c) for product MHPOB with a cell thickness of 5 μm and i = 10 nA. |
The response of the sample to a periodic square current signal is a triangular signal distorted by the plateaus corresponding to the phase transitions. A delay with the transition between the rise part, corresponding to a positive current +i0 and the descent one, corresponding to a negative current −i0 are observed. Further, we will study this hysteresis phenomenon in more detail.
The curves of Fig.
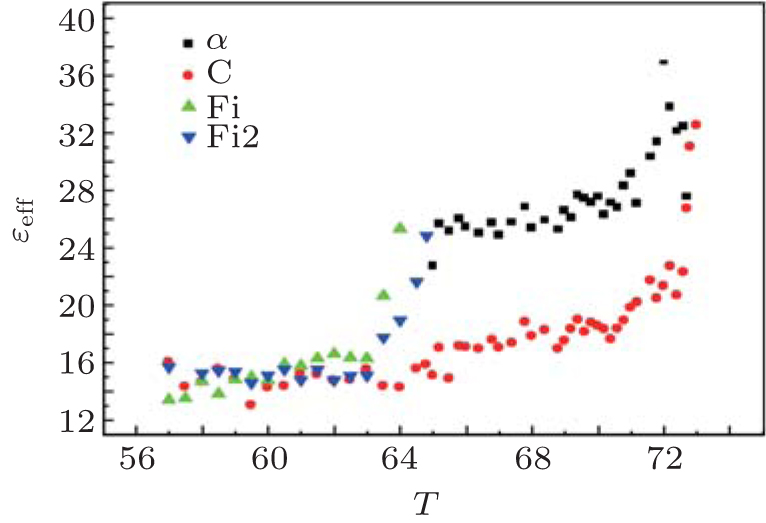 | Fig. 7. Temperature dependences of the relative permittivity εeff (Product C10F3) for the SmCα phase (black square), unwounded SmC* (red solid circle),   |
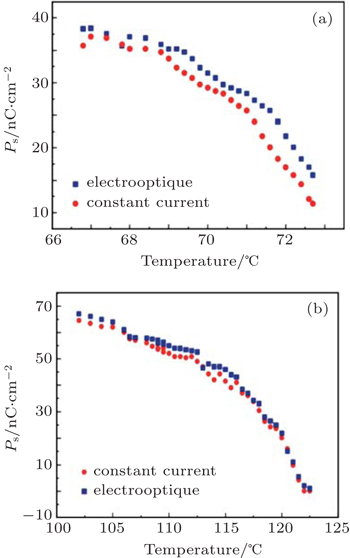
As is well known, the susceptibility of the polarization P diverges at the second-order transition temperature (Eq. (
 | Fig. 8. Temperature dependences of the spontaneous polarization PS for (a) product C10F3 and (b) product MHPOBC. Red solid circles represent the measurements by the method of constant current, and blue solid squares refer to the measurements by the electro-optical method. |
The response of the sample to a periodic square current signal points out that the cell voltage Vc is a triangular signal distorted by the plateaus corresponding to the phase transitions (Fig.

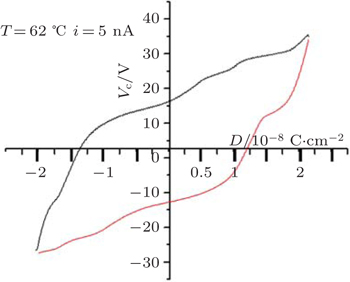
Figure
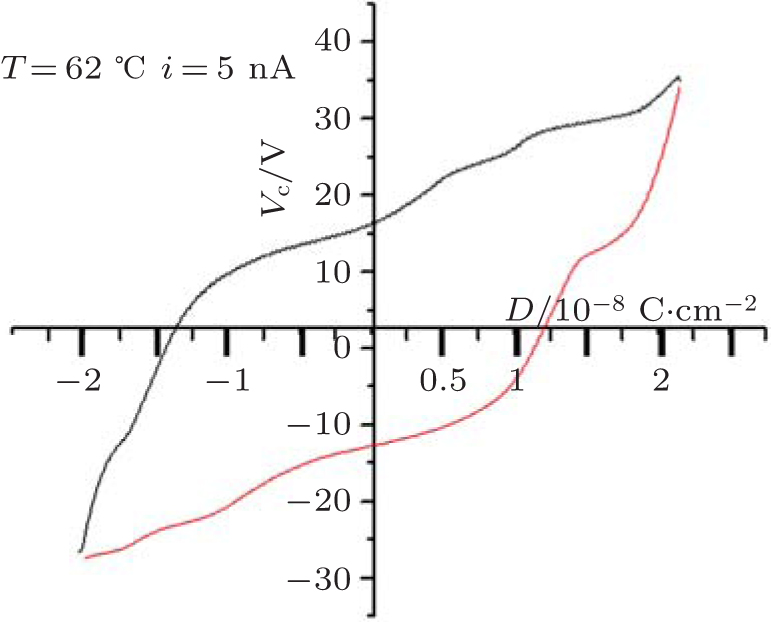 | Fig. 9. Hysteresis loop obtained by current square signal i0 = 5 nA for compound C10F3 at T = 62 °C. |
All the observed cycles are characteristic of ferroelectric products with only one loop, which shows a phenomenon of ferroelectric hysteresis, accompanied by the phase transitions. A remnant polarization at null field points out an effect of memory in these compounds.
The constant current method allows the rapid determination of the (E,T) phase diagram of a given chiral smectic liquid crystal compound, but the weak precision of measurements reduces its utility. We improve the precision of measurements by adopting the new principles which give results comparable to those obtained by the traditional method.
Precisely measuring the spontaneous polarization and the dielectric permittivity can be a means of determining the natures or structures of phases.
The use of a square current signal shows reversibility in the appearance of the phases. The phases which appear in the rising part are the same as those which appear in the falling part, which means the stabilities of these phases obtained under field. A delay with the transition between the rising part and the falling part is observed, which highlights phenomena of ferroelectric hysteresis in these compounds.
All the transitions observed under field are first order, and both phases coexist in the sample all along the transition. The new rule of phase, introduced at the beginning, makes it possible to envisage such coexistence. Indeed, the variance calculated for a pure substance is equal to 2 where two phases coexist.
In conclusion, the improvements made in the principles of measurement of the characteristic parameters of a ferroelectric liquid crystal will make the constant current method a routine investigation method which allows relevant explanations of the structures and the nature of the phases.
| 1 | |
| 2 | |
| 3 | |
| 4 | |
| 5 | |
| 6 | |
| 7 | |
| 8 | |
| 9 | |
| 10 | |
| 11 | |
| 12 | |
| 13 | |
| 14 | |
| 15 | |
| 16 | |
| 17 | |
| 18 | |
| 19 | |
| 20 | |
| 21 | |
| 22 | |
| 23 |