

Spectral distortion of dual-comb spectrometry due to repetition rate fluctuation
[Yang Hong-Lei, Wei Hao-Yun, Li Yan†,  ]
]
]
|
|


† Corresponding author. E-mail:
Project supported by the State Key Laboratory of Precision Measurement Technology & Instruments of Tsinghua University and the Young Scientists Fund of the National Natural Science Foundation of China (Grant No. 61205147).
Dual-comb spectrometry suffers the fluctuations of parameters in combs. We demonstrate that the repetition rate is more important than any other parameter, since the fluctuation of the repetition rate leads to a change of difference in the repetition rate between both combs, consequently causing the conversion factor variation and spectral frequency misalignment. The measured frequency noise power spectral density of the repetition rate exhibits an integrated residual frequency modulation of 1.4 Hz from 1 Hz to 100 kHz in our system. This value corresponds to the absorption peak fluctuation within a root mean square value of 0.19 cm−1 that is verified by both simulation and experimental result. Further, we can also simulate spectrum degradation as the fluctuation varies. After modifying misaligned spectra and averaging, the measured result agrees well with the simulated spectrum based on the GEISA database.
An optical frequency comb,[1] providing hundreds of thousands of even spaced and mutual coherent longitudinal modes which are traced to frequency standard, pushes laser metrology forward by a tremendous step including molecular spectroscopy.[2] Based on multi-heterodyne detection that is similar to conventional Fourier transform spectrometry,[3] a dual-comb spectrometer employs two comb lasers with slightly different repetition rates to mimic scanning sampling. In this scenario, detuned pulse trains act as asynchronous optical sampling probes for each other.[4,5] Thus, a dual-comb system can also be applied to monitor instantaneous phenomenon[6] or remote, fast sensing.[7] Because of the unique measurement principle, it has many advantages, such as high-speed acquisition, high resolution, and high-frequency accuracy.
To a remarkable extent, the three ‘High’ advantages are confined by comb laser performance. In one comb, there are two freedoms, i.e., repetition rate (frep) and carrier-envelope offset frequency (fceo). The stabilities of frep and fceo directly affect the performance of the measurement system. In order to record non-distorted interferograms by a dual-comb spectrometer, one method is to use highly stabilized laser combs via phase-locking both freedoms to optical frequency standards.[8,9] Owing to the precise control of laser combs, the radio frequency (RF) beats generated by pairs of nearby comb modes are fixed. Alternatively, a raw distorted interferogram of free-running laser combs can be corrected by mixing adaptive signals which contain phase error information on real-time compensation hardware[10] or by a posteriori correction algorithm.[11,12] No frequency standards in these systems cause a little trouble in mapping spectral features along the horizontal axis. However, these studies show the solution of laser fluctuation, but they do not include how the spectrum degrades since laser performance deteriorates.
In this paper, the frequency stabilities of frep and fceo are evaluated. According to the principle, the repetition rate fluctuation is the main reason that causes spectral frequency misalignment compared with carrier-envelope offset frequency variation. By establishing a dual-comb system traced to a Rubidium clock, we measure the P branch in the 2v3 rotational–vibrational band of hydrogen cyanide (H13C14N). The measured spectra show absorption peak jitter that is in agreement with unstable pulse interference simulation. The signal-to-noise ratio of the absorption spectrum is effectively improved by averaging modified spectra in the frequency domain. Finally, discussion and further improvement are presented.
A well-stabilized mode-locked laser provides a train of ultrafast pulses at a constant repetition rate and with equal carrier-envelope phase shift in the time domain. In the optical domain, the comb structure of laser modes extends hundreds of nanometers in the optical domain. The output field can be described as


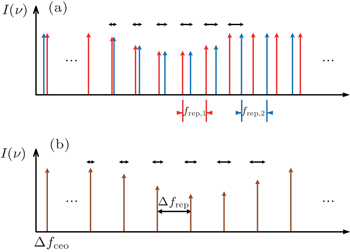
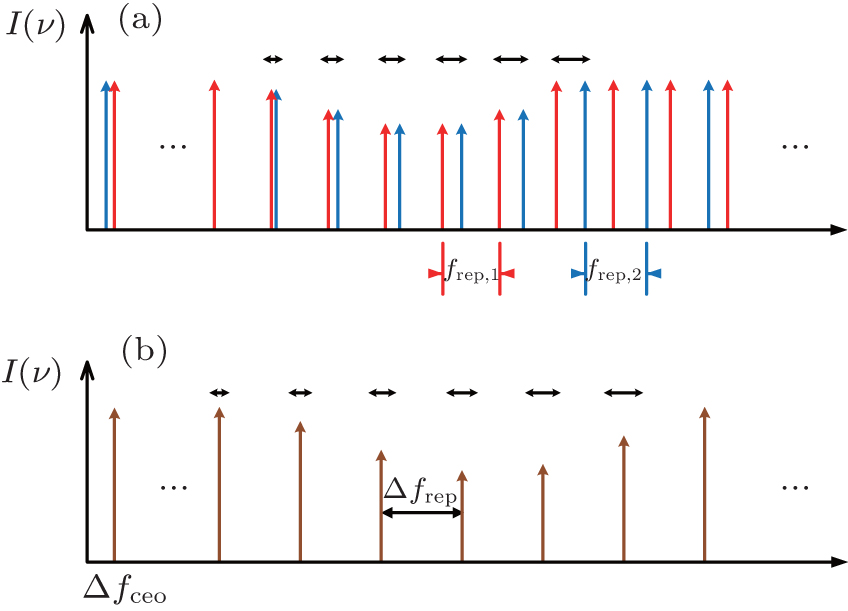 | Fig. 1. Principle of dual-comb spectrometry. A two-frequency comb generates an RF beat comb according to multi-heterodyne detection. The double-sided arrow denotes laser mode fluctuation. As n goes up, the fluctuation becomes more and more considerable. (a) Optical domain, (b) RF domain. |
Equation (
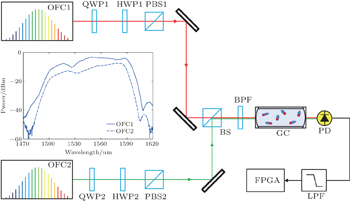
The schematic of the experimental setup is illustrated in Fig.
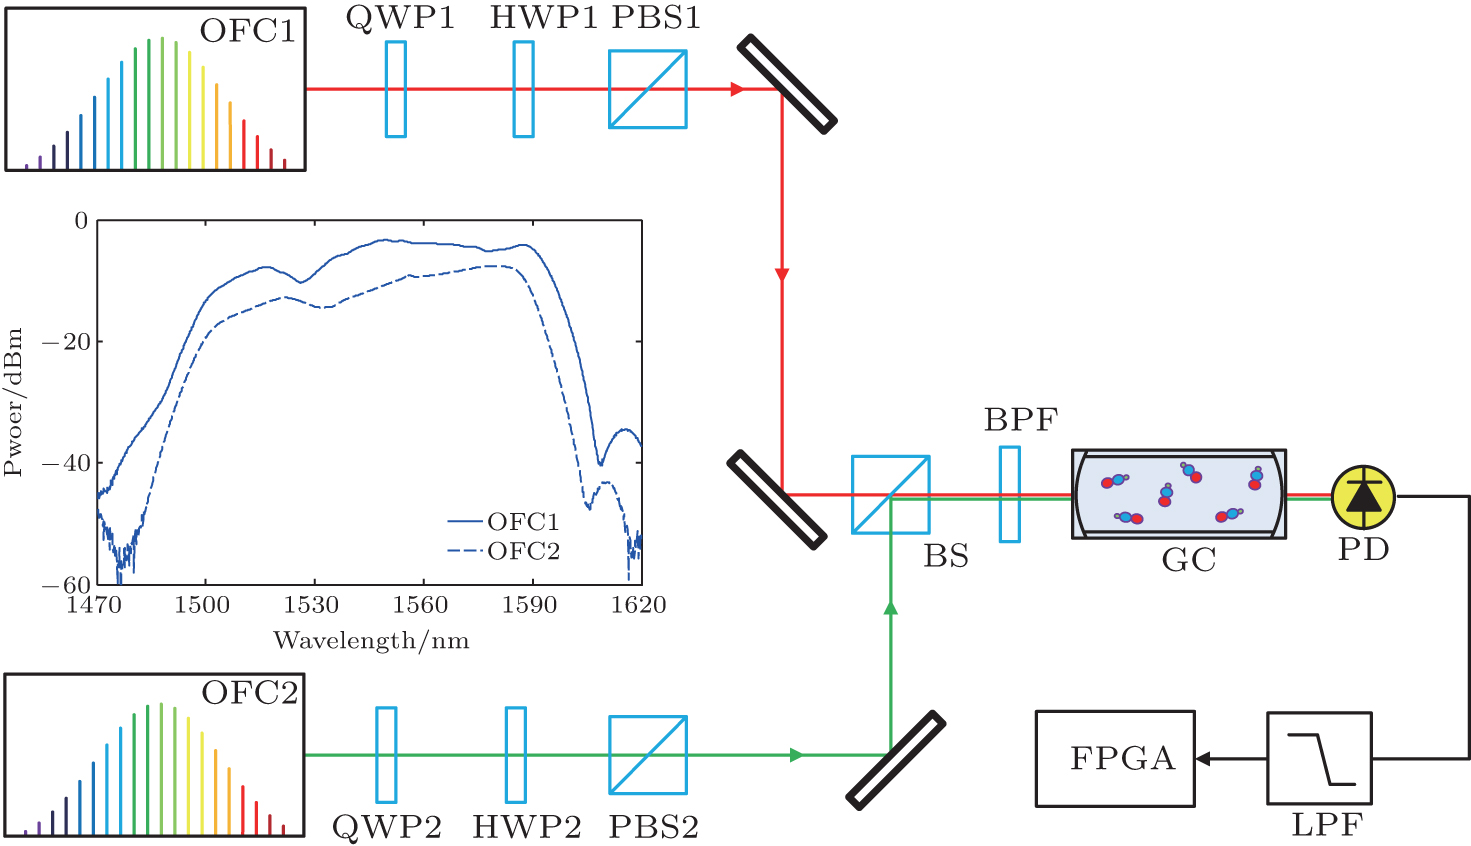 | Fig. 2. Dual-comb spectrometer. The inset shows the output spectra of the frequency combs. Colorful lines represent optical beams, while black lines are electric cables. OFC: optical frequency comb; QWP: quarter waveplate; HWP: half waveplate; PBS: polarized beam splitter; BS: non-polarized beam splitter; BPF: optical band-pass filter; GC: gas cell; PD: photodetector; LPF: electronic low-pass filter. |
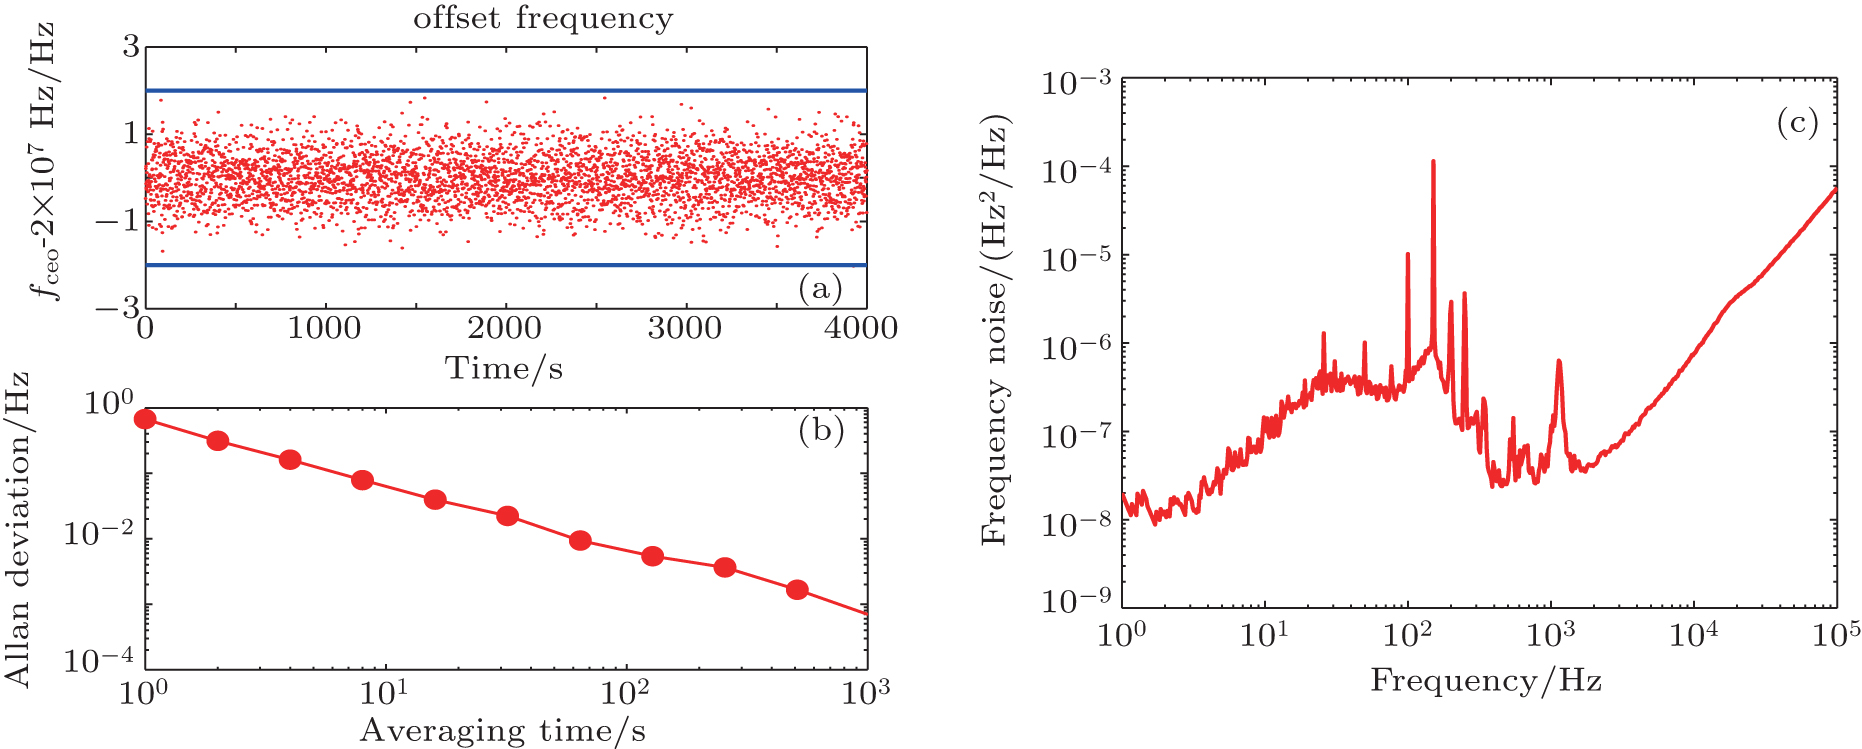 | Fig. 3. Stabilities of locked fceo and frep. (a) Locked fceo with a gate time of 1 s. (b) The Allan deviation of locked fceo as a function of average time. (c) The frequency noise of locked frep derived from the power spectral density of phase noise. |
The stabilities of fceo and frep are evaluated first. Achieved by a sequence of amplification, nonlinear spectrum boardening and second harmonic generation, the linewidth of fceo is on the order of several hundred kHz. It is better to evaluate this parameter via Allan deviation. We use a Π-type frequency counter with no dead time at a gate time of 1 s to record locked fceo for 4000 s. The result is shown in Fig.
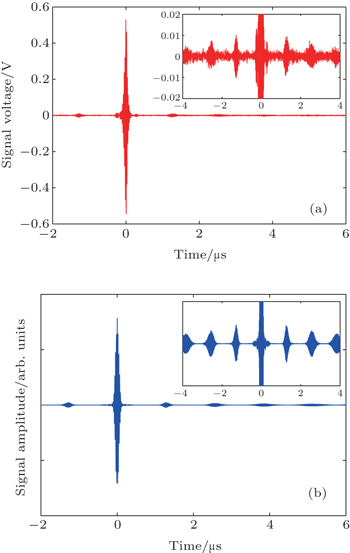
To obtain the interferometric signal, laser combs are locked at different repetition rates, frep,1 = 250.000 MHz and frep,2 = 250.002 MHz. Thus, the difference Δfrep is 2 kHz, and interferograms are repeatedly generated with a time interval of 0.5 ms. 25 interferograms are recorded within 12.5 ms. Figure
 | Fig. 4. (a) Interferometric signal of asynchronous dual laser combs. Inset: partial magnified free-induction decay (FID) signal. (b) Simulated interferometric signal. |
Figure
The nominal conversion factor β is 1.25× 10⁵. As indicated in the previous analysis, a small fluctuation in frep leads to a considerable change in β, which further causes significant misalignment in up-conversion to the optical domain. With the parameters of the experimental setup, the RF comb is located around 46 MHz. Therefore, the RMS spectral frequency jitter is estimated from

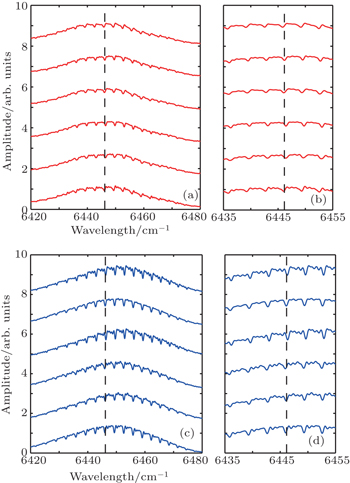
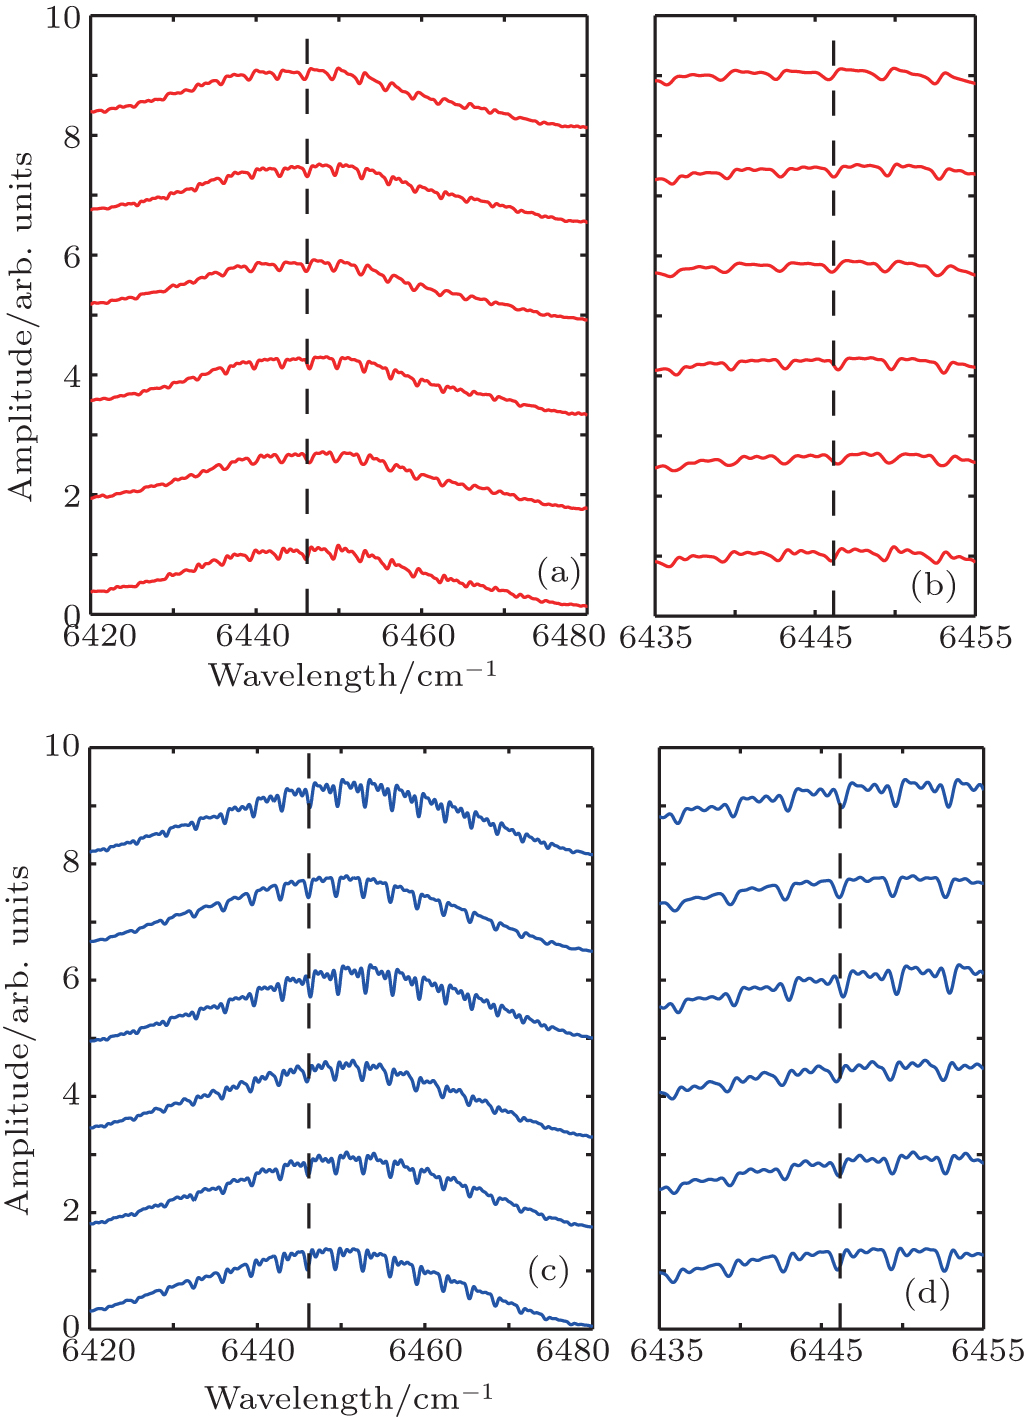 | Fig. 5. Six spectra obtained from measurement (a) and simulation (c) are offset for viewing clarity. Panels (b) and (d) show the partially expanded curves in panels (a) and (c), respectively. The dashed line denotes the absorption peak at 6446.16 cm−1 from GEISA database. |
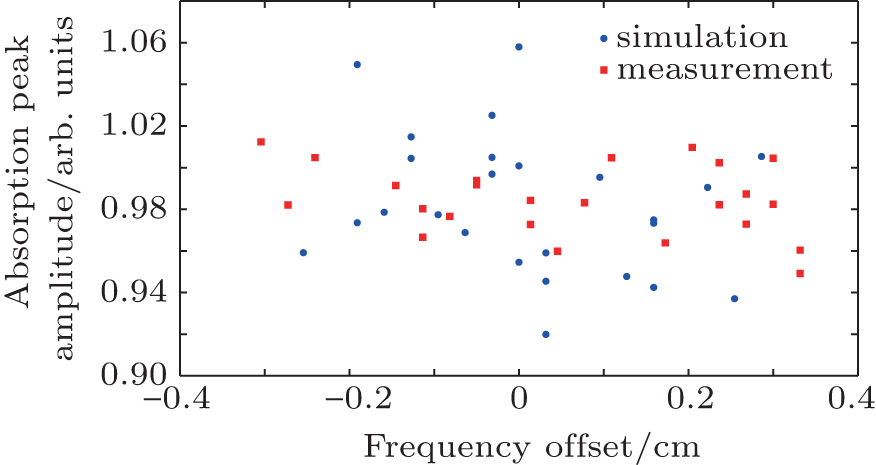 | Fig. 6. Amplitude and frequency offset distributions of the absorption peak near 6446.16 cm−1 in the measured and simulated results. |
Focusing on a narrow region of interest, the frequency jitter of each absorption peak in one spectrum could be approximately treated as a constant. Therefore, the measured spectra are dynamically modified one by one with respect to the absorption peak at 6446.16 cm−1. In Fig.
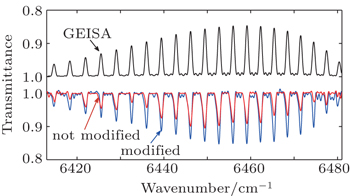
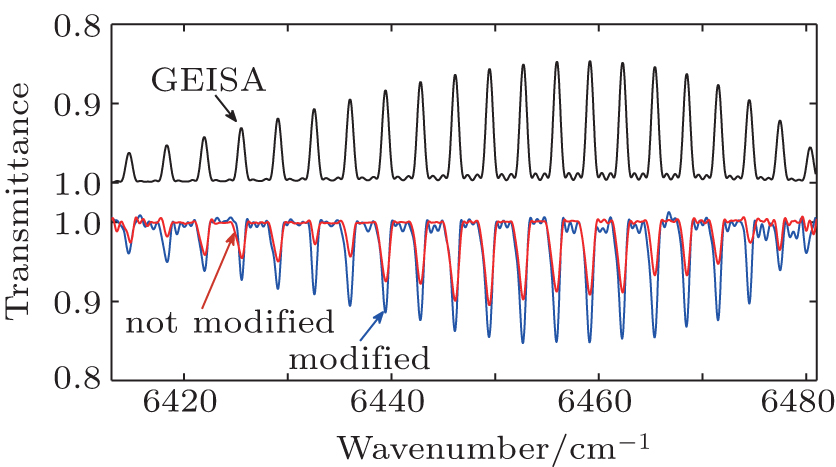 | Fig. 7. Comparison between the averaged spetrum with and without modification and the simulation based on GEISA. |
In this study, we demonstrate that the repetition rate fluctuation has a significant effect on spectral frequency misalignment by considering the inevitable phenomenon of laser fluctuation. By measuring the frequency noise of the repetition rate, the RMS residual frequency modulation of locked frep is 1.4 Hz in our system. According to the experimental setup, we simulate absorption peak jitter which is proven experimentally. By modifying the spectra with respect to the reference peak and averaging in the frequency domain, the signal-to-noise ratio is effectively improved. The averaged spectrum agrees well with the simulation result. However, this kind of modification is limited to the case of a low-resolution spectrometer. When it comes to high-resolution, more attention should be paid to the phase noises of both laser combs.
Further, the relative linewidth between laser combs is the most important parameter that seriously restricts the application of interferometric spectrometry. Next, a narrow linewidth cw laser is expected. By utilizing a phase-lock loop with a large control bandwidth, the phase noise of the comb mode that is offset-locked to the cw laser could be suppressed.[15,16] It will benefit the coherent averaging in the time domain.
| 1 | |
| 2 | |
| 3 | |
| 4 | |
| 5 | |
| 6 | |
| 7 | |
| 8 | |
| 9 | |
| 10 | |
| 11 | |
| 12 | |
| 13 | |
| 14 | |
| 15 | |
| 16 |