Spectral distortion of dual-comb spectrometry due to repetition rate fluctuation
Yang Hong-Lei, Wei Hao-Yun, Li Yan†, 
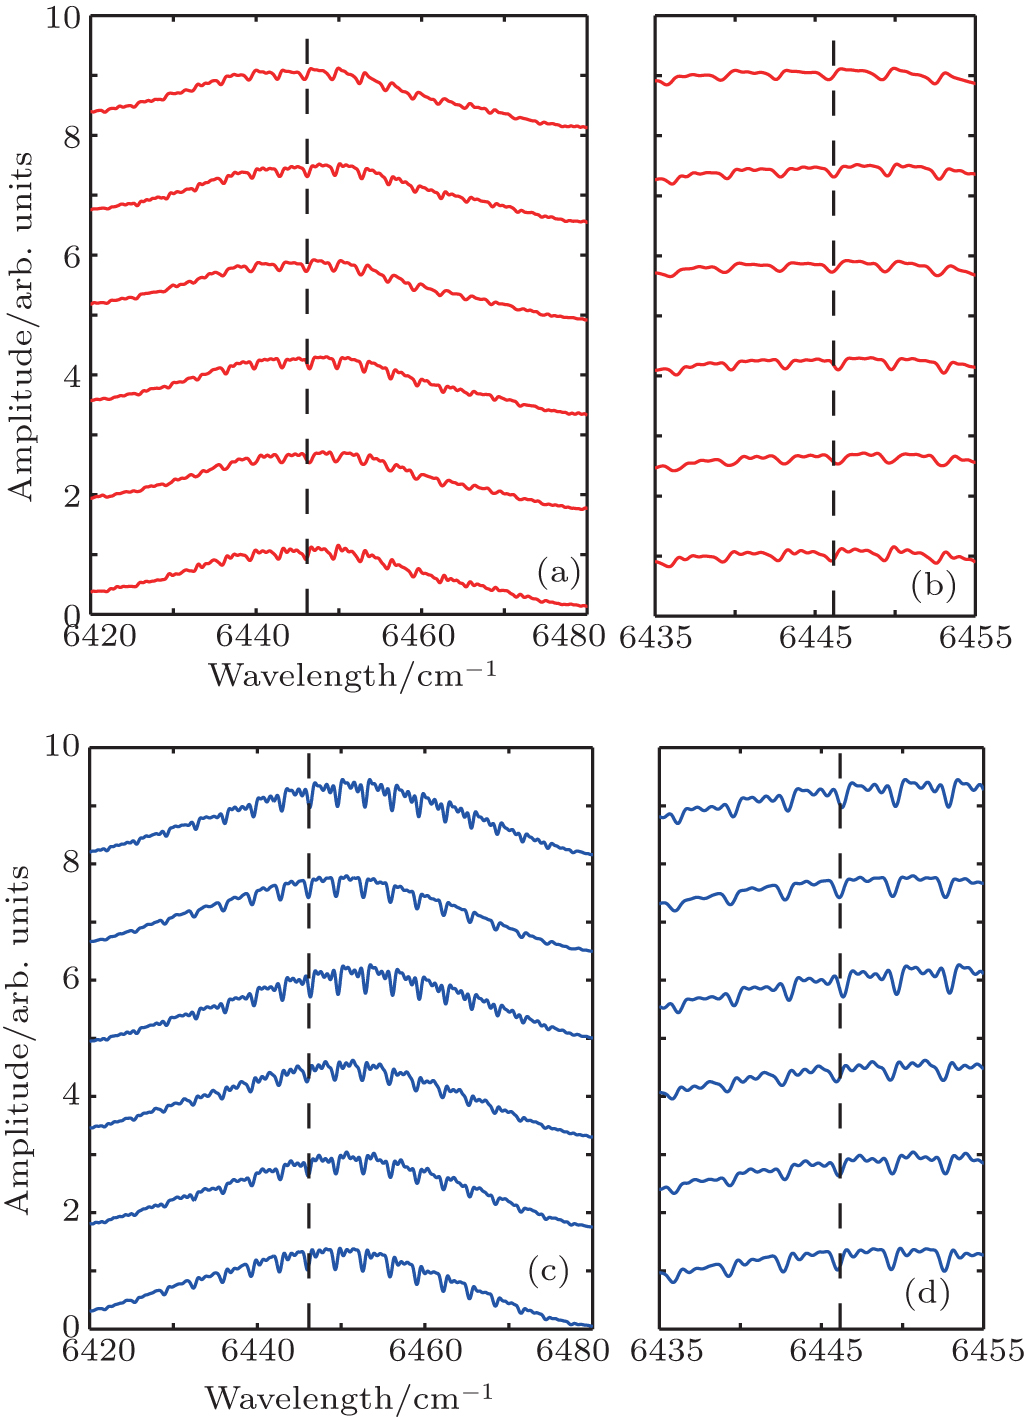
Six spectra obtained from measurement (a) and simulation (c) are offset for viewing clarity. Panels (b) and (d) show the partially expanded curves in panels (a) and (c), respectively. The dashed line denotes the absorption peak at 6446.16 cm−1 from GEISA database.