


High-temperature Raman spectroscopic study of vanadoborate Na3 VO2 B6 O11
[Zhang Ji1, †,  , Zhang De-Ming2, Zhang Qing-Li2, Yin Shao-Tang2]
, Zhang De-Ming2, Zhang Qing-Li2, Yin Shao-Tang2]
|
|


† Corresponding author. E-mail:
Project supported by the National Natural Science Foundation of China (Grant Nos. 51302268 and 51102239) and the Natural Science Foundation of Anhui Province, China (Grant No. KJ2015A339).
Raman spectra of a vanadoborate (Na3VO2B6O11) crystal from room temperature up to the melting point have been recorded. The main internal vibrational modes of the crystal have been assigned. It was found that all the Raman bands exhibit decreases in frequency and the widths of the Raman bands increase with the increase of temperature. However, no phase transition was observed under 525 °C. The micro-structure of its melt was studied by quantum chemistry ab initio calculation. The continuous three-dimensional network of the crystal collapsed and transformed into VO4 and VBO6 clusters during the melting process with an isomerization reaction from four-coordinated boron to a three-coordinated species.
Na3VO2B6O11 (NVBO) is a new nonlinear optical crystal as a result of the investigation of vanadoborate systems. In the past years, Na2B4O7–V2O5,[1] NaBO2–V2O5,[2] and H3BO3–NaVO3–HNO3–H2O[3] systems have been studied. More recently, Touboul et al.[4] further investigated the Na2CO3–H2O–V2O5–H3BO3 system to obtain vanadoborate compound Na3VO2B6O11 first. Then the NVBO crystal has been grown by the top-seeded solution growth method using Na2CO3–V2O5 flux.[5] It has a wide transparency range from 370 nm to 3000 nm with the shortest second harmonic generation (SHG) wavelength at 427 nm, which demonstrates that it has potential as optical SHG crystals for blue wavelength applications.
The investigation of the structure of NVBO crystal by x-ray diffraction techniques shows that the compound is orthorhombic, space group P212121,[4,5] with cell parameters a = 7.7359 Å, b = 10.1884 Å, c = 12.5697 Å, V = 990.7 Å, and Z = 4. It has a three-dimensional structure consisting of hexaborate groups connected by VO4 tetrahedra with the sodium atoms distributed in channels throughout the three-dimensional network. Such a hexaborate group made up of a tetrahedron and triangle by sharing one oxygen may form compact atom groups which have been described in several borates, such as Li2B4O7,[6] CsLiB6O10,[7] and LiB3O5[8] crystals. However, the structural stabilization at high temperature is important to the NLO crystal as an optical device. Temperature-dependent Raman scattering measurements are well suited to obtain the structural information of the sample at different temperatures because of the dependence of the phonon modes on temperature.[9,10] Furthermore, it is essential to investigate the micro-structure of both its crystal and molten phases for being able to achieve large-sized single crystals grown from the melt.[11] To the best of our knowledge, no studies on Raman scattering about the NVBO crystals have been reported until now, which contribute to a progressive understanding of the crystal structure[12] as well as more specific aspects of lattice dynamics.[13] Therefore, in this paper, we recorded the Raman spectra of NVBO single crystal from room temperature to melting point, and the calculation was carried out using quantum chemistry ab initio calculation to study the micro-structure of the solution.
The NVBO single crystal used in this study was grown by the flux method in Na2CO3–V2O5 flux system described by Fan et al.[5] Then the crystal was cut into slices with 2-mm thickness. The room- and high-temperature measurements were carried out using a home-made heating furnace. The temperature was monitored by a thermocouple attached to the metal sample holder and controlled by a temperature controller within 1 °C. The Raman spectra were collected with Horiba Jobin Y’von Raman spectrometer (LabRam800HR) with a backscattering configuration. The ultraviolet light pulse of 355 nm with a repetition frequency of 10 kHz from a coherent Innova ultra laser was focused onto the sample using a Raman microprobe with a 4× objective lens. An intensified charge coupled device (CCD) was used to collect the scattering light. The sample was steadily heated from room temperature to melting point in a platinum boat which was placed in the center of the chamber. The spectral acquisition, under the accumulated mode, was 10 s each time, the average power of the laser operation was fixed at 800 mW and the slit width was set as 300 nm for all the measurements under different temperatures.
The orthorhombic unit cell of the Na3VO2B6O11 crystal contains four formula units and belongs to the space groups P212121. According to the research of Touboul,[4] two groups of atoms can be marked out in the structure of this compound: VO4 and B6O13 groups which share common oxygen atoms to form a three-dimensional framework, as shown in Fig.
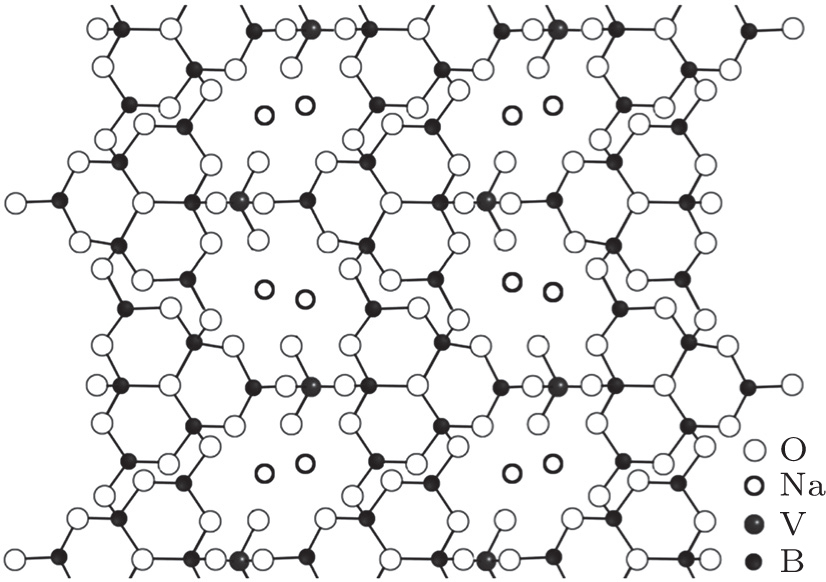 | Fig. 1. Projection of structure of Na3VO2B6O11 crystal in the (001) plane. |
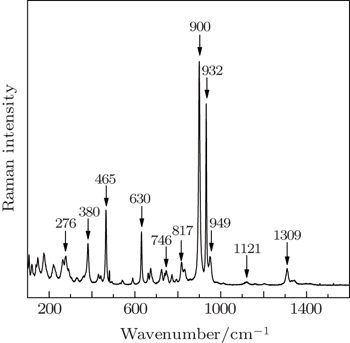
The Raman spectrum at room temperature (300 K) is illustrated in Fig.
 | Fig. 2. Raman spectrum of Na3VO2B6O11 crystal at room temperature. |
A planar equilateral triangle molecule BO3 with D3h symmetry in its free ion state has four normal vibrational modes. These normal modes are non-degenerate symmetric B–O stretching vibration (vs), non-degenerate out-of-plane B–O bending vibration (δ), doubly degenerate B–O stretching vibration (vas) and doubly degenerate in-plane O–B–O bending vibration (γ). It is known that the normal mode frequencies of the BO3 group in the vibrational spectra of the bismuth borate crystals are typically situated as follows:[14] vs∼ 900–1000 cm−1, δ ∼ 650–800 cm−1, vas∼ 1250–1450 cm−1, and γ ∼ 590–680 cm−1. Elbelrhiti et al.[15] reported the Raman spectra of Li2B4O7 crystal which contains a basic building block of two BO4 tetrahedra linked by a common oxygen atom, forming a B2O7 group joining two planar triangles BO3 using the common oxygen atoms. The Raman peaks at 976 cm−1 and 968 cm−1 are observed and assigned to symmetric stretch vibration of BO3 in the spectra of Li2B4O7 crystal. The 762 cm−1 and 739 cm−1 peaks are related to the BO3 symmetric deformation, 1447 cm−1 peaks to BO3 asymmetric stretch. These arguments make the following tentative assignments possible: the strong Raman peak located at 1309 cm−1 is due to vas vibration of B–O bonds in BO3 groups; the strong peak located at 932 cm−1 is related to the vs mode; and the peak at 773 cm−1 due to the non-degenerate B–O bending vibration mode (δ). Finally, the Raman peak located at 630 cm−1 is assigned to the O–B–O bending vibration (γ) in BO3 triangles, as listed in Table
| Table 1. Raman shift and assignment for the Na3VO2B6O11 crystal at room temperature. . |
In addition, the BO3 triangles are connected with BO4 tetrahedra by B–Ø–B bonds (Ø = bridge oxygen) to form boroxol rings. Such a group with six-numbered B–O rings has been described in several borates. According to Refs. [16] and [17], the nonplanar boroxygen ring can be equivalent to a planar six-membered ring B3O6, and the vibrational bands of the crystal with this kind of ring can be attributed to the vibrational modes of the B3O6 ring and BO4 tetrahedra. It is well known that 805 cm−1 band, characteristic of vitreous B2O3, is assigned to the symmetric breathing vibration of the six-numbered ring[18] which involves the motion of ring oxygen atoms only.[19] Meanwhile the phenomenon of frequency shift toward low wavenumber with the increase of the number of BO4 tetrahedron in the rings has also been observed recently in studies on boron-oxygen glasses.[20] The structure of CsLiB6O10 (CLBO) crystal, reported by Wang,[17] comprises the basic structure unit (B3O7) group which is a six-numbered ring in which two of the B atoms are three-fold coordinated and the third B atom is four-fold coordinated by O atoms. The Raman bands in the range of 782–785 cm−1 observed in the spectra of CLBO crystal are assigned the ring-breathing vibrational mode of the six-numbered ring. The frequency of this mode shifts to 765 cm−1 observed in the Raman spectrum of LiB3O5 (LBO) crystal[21,22] consisting of boroxygen rings with one BO4 tetrahedron. Therefore, the vibrational band at 746 cm−1 in the Raman spectra of NVBO crystal may be related to the breathing vibration of the boroxygen ring which consists of two BO4 tetrahedra. It is worth noting that its frequency of Raman vibration is lower than those of LBO and CLBO crystals with the same triborate group. On the other hand, the two BO4 tetrahedra connect together with B–O–B bonds in the boroxygen ring. A tetrahedron molecule BO4 with symmetry Td has four normal vibrational modes: v1 (symmetric stretching mode), v2 (bending mode), v3 (asymmetric stretching mode), and v4 (bending mode). The normal mode frequencies for a BO4 tetrahedron may be approximated by Murray and Lockwood:[23] v1 ∼ 400 cm,−1, v2 ∼ 200 cm−1, v3 ∼ 1100 cm−1, and v4 ∼ 260 cm−1. Here, the weak band located at 1119 cm−1 (A1 mode) is related to BO4 asymmetric stretching mode vibration which is observed in the range of 1143–1166 cm−1 in the spectra of LiNaB4O7 as reported by Maczka;[24] the middle intense band at 465 cm−1 is caused by the symmetric stretching mode vibration.
In the structure of the NVBO crystal, a three-dimensional framework is formed by VO4 tetrahedra which, with V–O–B bonds, link sheets made up of polyborate [B6O13] groups. The VO4 tetrahedra have four normal vibrational modes. Ross[25] reported the infrared and Raman spectra of the free VO4 ion. There are four vibrations for VO4, namely, the v1 (A1) symmetric stretching mode located at around 874 cm−1, the v2 (E) bending mode in the region between 340 cm−1 and 345 cm−1, the v3 (F2) asymmetric stretching mode at 855 cm−1 and the v4 (F2) bending mode at 345 cm−1. Ross also reported the v3 modes of vanadinites at 800 cm−1 and 736 cm−1 and the v4 modes around 419 cm−1, 380 cm−1 and 322 cm−1. Moreover, according to the analysis of the spectra of Pb5(VO4)Cl, Ray et al.[26] reported that the Raman bands located at 879 cm−1 and 827 cm−1 are assigned to the ν1 symmetric stretching vibration of the VO4 ion and the Raman bands at 815 and 790 cm−1 to the ν3 mode. In this work we assigned the intense band 900 cm−1 as relative to the v1 symmetric stretching vibration. The band located at 817 cm−1 is related to the ν3 mode. In addition, the middle intense band located at 380 cm−1 is due to O–V–O bending vibration mode. This assignment is in agreement with that proposed by Ray (v4 in the range of 380–395 cm−1).
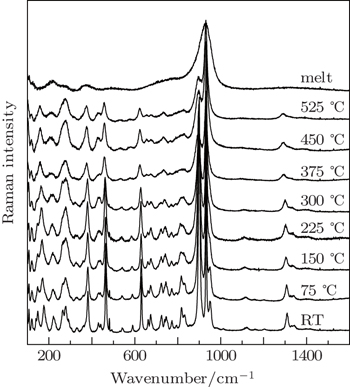
The temperature-dependent Raman spectra of an NVBO crystal in the wavenumber range of 100–1600 cm−1 were recorded with temperature increasing from room temperature to melting point, as shown in Fig.
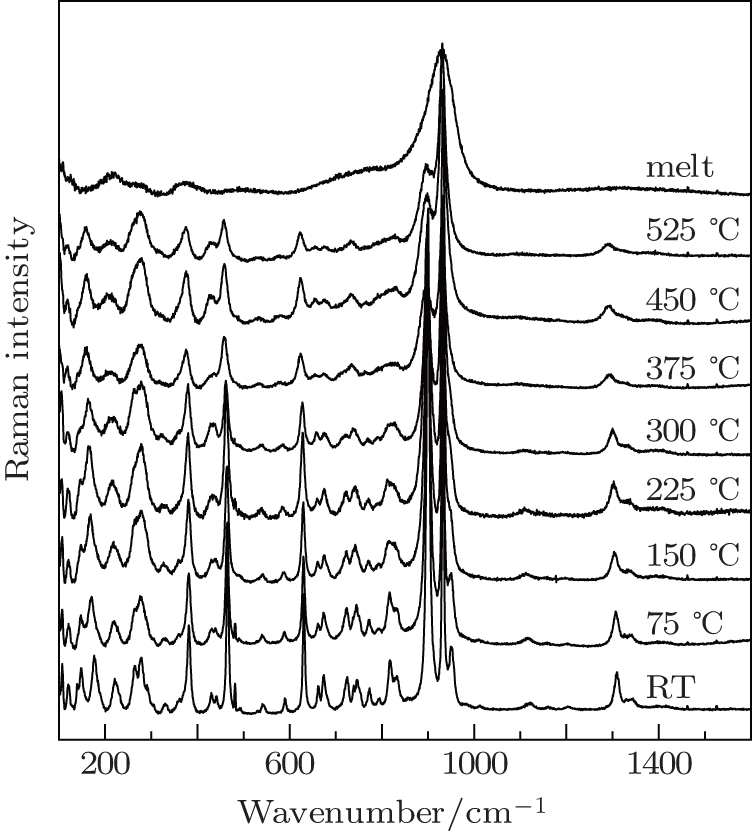 | Fig. 3. High-temperature Raman spectra of Na3VO2B6O11 crystal from room temperature to melting point. |
 | Fig. 4. The wavenumber shifts of Raman peaks with temperature increasing at different frequencies. The lines from top to bottom mean 380 cm−1, 276 cm−1, 220 cm−1, and 178 cm−1, respectively. |
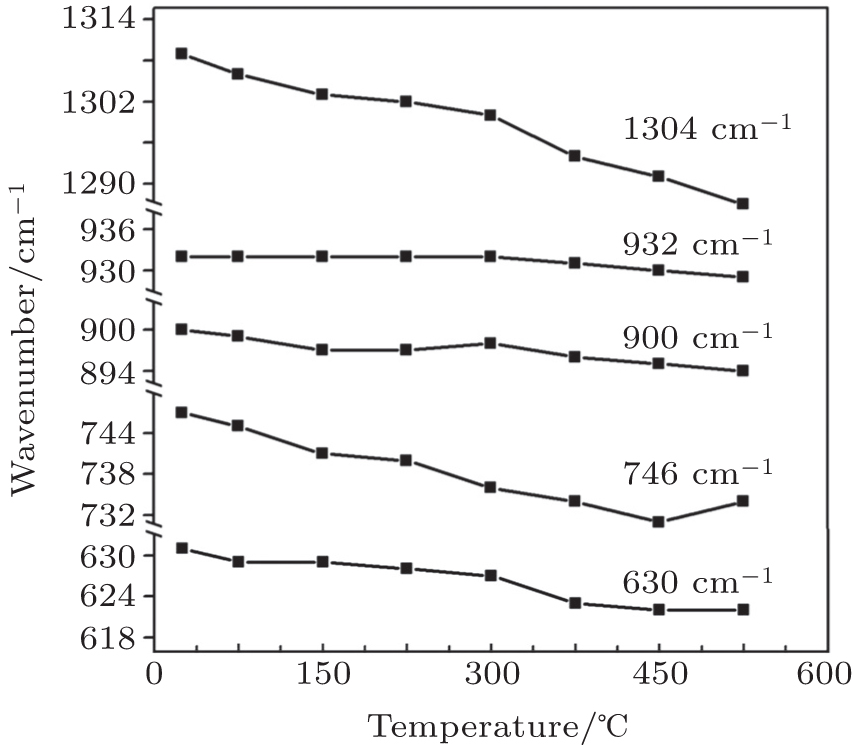 | Fig. 5. The wavenumber shifts of Raman peaks with temperature increasing at different frequencies. The lines from top to bottom mean 1304 cm−1, 932 cm−1, 900 cm−1, 746 cm−1 and 630 cm−1, respectively. |
The fitting results in the range of 600–1100 cm−1 are shown in Fig.
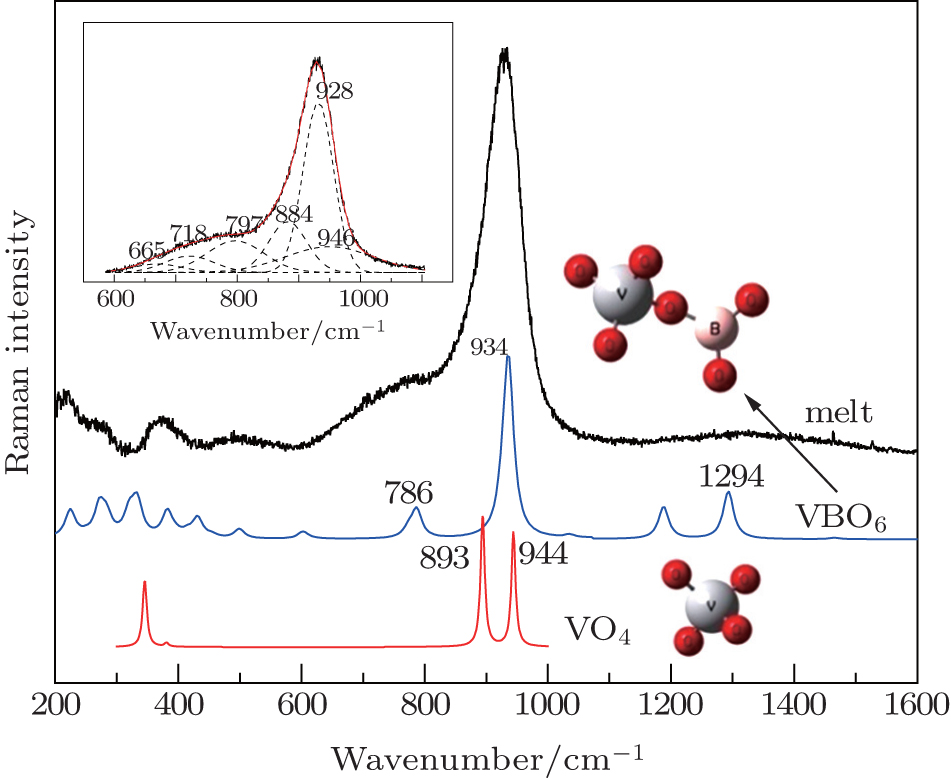 | Fig. 6. Raman spectra of melt of Na3VO2B6O11 crystal and calculation of VO4 and VBO6 groups; the fitting result in the shoulder picture. |
High-temperature Raman spectroscopy has been used to investigate the micro-structure of NVBO crystals and its melt. The obtained results coincided well with experimental results. Raman spectra of single crystal NVBO were recorded in the spectral range of 10–1600 cm−1 at room temperature first. Then the changes of the Raman peaks and the crystal structure were investigated at high temperature. It was found that all the Raman peaks exhibit decreases in frequency and the widths of the Raman peaks increase with temperature increasing. No phase transition was observed under 525 °C. Lastly, the micro-structure of its melt was studied by quantum chemistry ab initio method. The VO4 and VBO6 clusters exist in the melt.
| 1 | |
| 2 | |
| 3 | |
| 4 | |
| 5 | |
| 6 | |
| 7 | |
| 8 | |
| 9 | |
| 10 | |
| 11 | |
| 12 | |
| 13 | |
| 14 | |
| 15 | |
| 16 | |
| 17 | |
| 18 | |
| 19 | |
| 20 | |
| 21 | |
| 22 | |
| 23 | |
| 24 | |
| 25 | |
| 26 | |
| 27 | |
| 28 | |
| 29 | |
| 30 | |
| 31 | |
| 32 | |
| 33 | |
| 34 |