High-temperature Raman spectroscopic study of vanadoborate Na
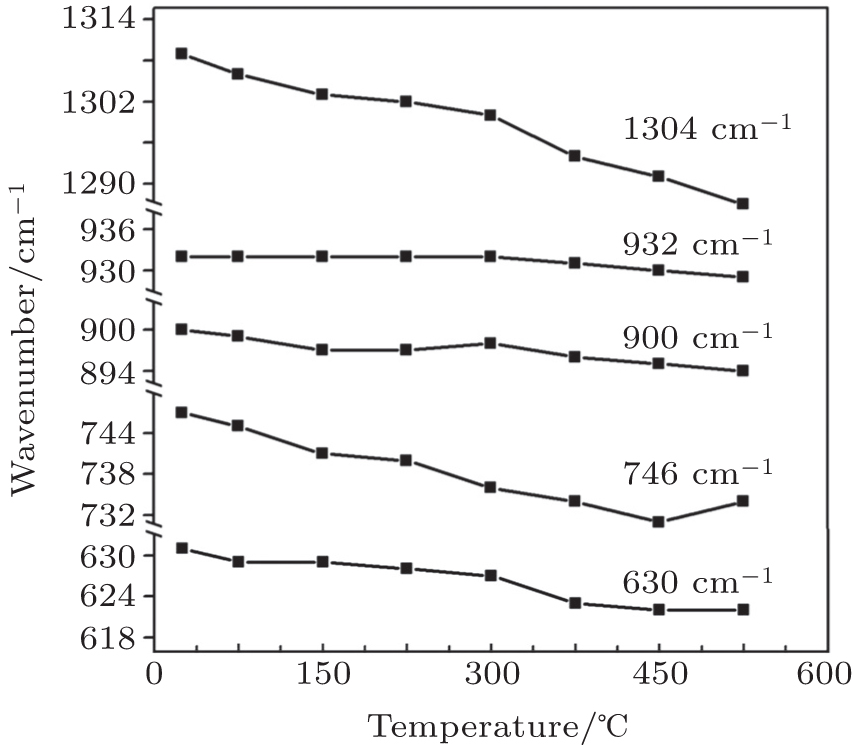
The wavenumber shifts of Raman peaks with temperature increasing at different frequencies. The lines from top to bottom mean 1304 cm−1, 932 cm−1, 900 cm−1, 746 cm−1 and 630 cm−1, respectively.

