


Spectral and ion emission features of laser-produced Sn and SnO2 plasmas
[Lan Hui1, 2, Wang Xin-Bing3, †,  , Zuo Du-Luo3]
, Zuo Du-Luo3]
|
|


† Corresponding author. E-mail:
Project supported by the National Natural Science Foundation of China (Grant No. 11304235) and the Director Fund of WNLO, China.
We have made a detailed comparison of the atomic and ionic debris, as well as the emission features of Sn and SnO2 plasmas under identical experimental conditions. Planar slabs of pure metal Sn and ceramic SnO2 are irradiated with 1.06 μm, 8 ns Nd:YAG laser pulses. Fast photography employing an intensified charge coupled device (ICCD), optical emission spectroscopy (OES), and optical time of flight emission spectroscopy are used as diagnostic tools. Our results show that the Sn plasma provides a higher extreme ultraviolet (EUV) conversion efficiency (CE) than the SnO2 plasma. However, the kinetic energies of Sn ions are relatively low compared with those of SnO2. OES studies show that the Sn plasma parameters (electron temperature and density) are lower compared to those of the SnO2 plasma. Furthermore, we also give the effects of the vacuum degree and the laser pulse energy on the plasma parameters.
Extreme ultraviolet (EUV) sources based on laser-produced plasma (LPP) are believed to be capable of meeting basic EUV lithography (EUVL) requirements, which are high EUV conversion efficiency (CE) and cleanliness of the source.[1–4] It is well known that the laser properties, the target material, as well as the buffer gas affect the LPP EUV radiation. The main mechanism of the absorption in laser–target interaction is the inverse bremsstrahlung (IB) absorption, which is inversely proportional to the laser wavelength. Due to the shorter wavelength of the Nd:YAG laser, more laser energy is absorbed by the plasma, and the critical density of the plasma is larger compared with that of the CO2 laser (∼1021 cm−3 for 1.06 μm and ∼1019 cm−3 for 10.6 μm). Nd:YAG laser produced plasma EUV sources can be used as metrology light sources,[5] while CO2 laser produced plasma EUV sources are used as high volume manufacturing (HVM) sources.[6] Moreover, the Nd:YAG laser has a better optical beam quality, which results in a higher power density than that of the CO2 laser and creates highly-ionized species. A number of different target materials are considered for EUV sources, including Li, F, Sn, and Xe.[7–11] Among these analyzed targets, Sn has been found to be the most promising target material for 13.5 nm wavelength with a high CE of > 2%.[12,13] To obtain a higher CE, researchers have come up with new ideas for the Sn target. Hayden et al.[14] used ceramic slab targets doped with 5% and 6% Sn and an Nd:YAG laser for the EUV source. The results showed that the 5% (i.e., low density) Sn doped ceramic target had a maximum EUV CE of over 2.5% at the laser pulse intensity of 1.91 × 10¹¹ W·cm−2, but the EUV CE of the Sn doped target was not always higher than that of pure Sn, because the EUV CE also varied with the laser power density. Xin et al.[15] compared the EUV radiation signals from Nd:YAG laser produced plasmas in Sn and low density SnO2/CNTs nano-composites using an AXUV-100 silicon photodiode. They found that the EUV radiation signal of the pure Sn target was quite strong at high laser pulse energy compared to that of the low density SnO2/CNTs nano-composites target, while the emitted EUV signals were approximately the same at low laser pulse energy. Tao et al.[16] also investigated the properties of EUV emission from pure Sn, 59% SnO2, and 23% SnO2 targets using an Nd:YAG laser. Their results showed that the EUV emission was increased with an increase in the fraction of Sn at a fixed laser intensity. Apart from high EUV CE, the ion and atom debris also affect the generated plasma emission. However, the plasma plume expansion and ion debris were not studied in detail.
To further study the Sn-based EUV source in this paper, we present a complete analysis of the parameters of the plasma generated from two planar slab LPP targets (metal Sn and ceramic SnO2) under identical experimental conditions. The Sn and SnO2 plasmas are generated by an Nd:YAG laser with a pulse width of 8 ns (FWHM) at the wavelength of 1.06 μm producing a maximum energy of 216 mJ in vacuum conditions. Time-integrated EUV image spectra are obtained and analyzed using a grazing incidence flat-field spectrograph coupled with an x-ray CCD camera. The EUV CE is deduced under different vacuum degrees. The plasma plume emission and expansion dynamics are estimated by means of fast gated photography using a fast gated intensified charge coupled device (ICCD) imaging system. Moreover, the Faraday cup (FC) measurements permit us to obtain the time of flight (TOF) signals. Optical emission spectroscopy (OES) measurements are performed in the visible range and reveal detailed information about the dynamics of spectral emission. Temporal evolution of the plasma parameters (electron temperature and density) has been determined by the Boltzmann plot method and Stark line broadening. In addition, the effects of the different vacuum degrees on the plasma parameters are studied.
The experimental apparatus is shown schematically in Fig.
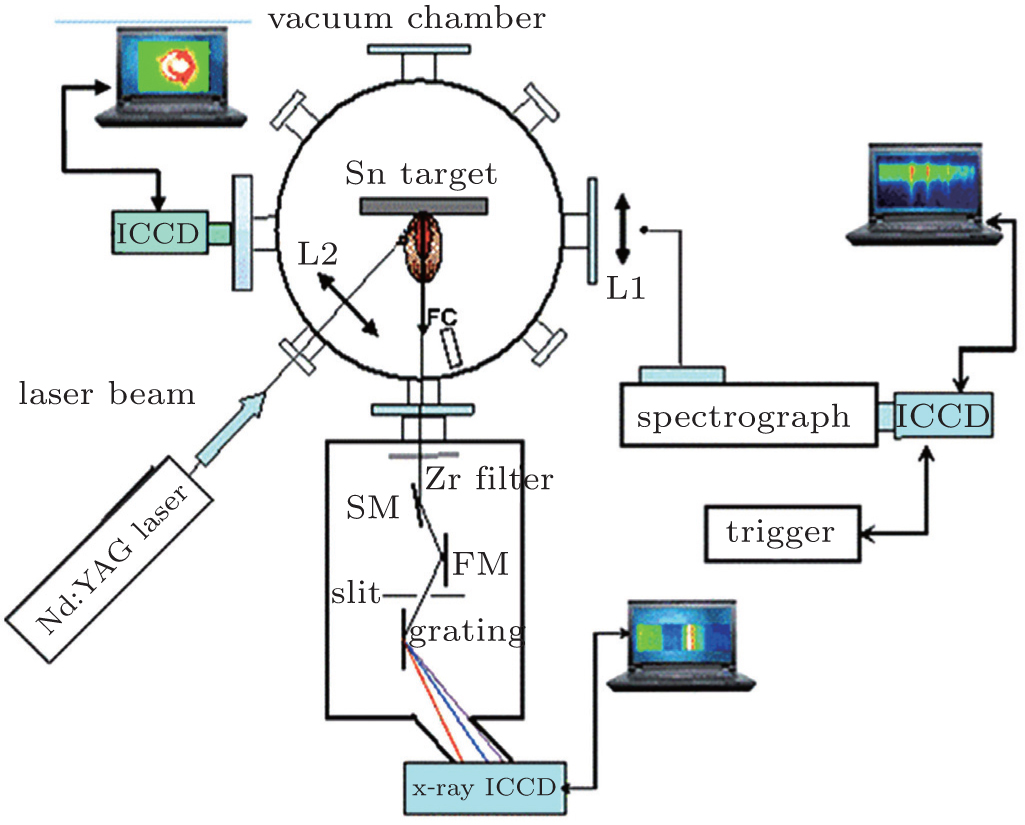 | Fig. 1. Schematic of the experimental setup (L1, L2: lens; SM: spherical mirror; FM: flat mirror). |
A grazing incidence flat-field spectrograph with a periodically ruled concave gold coated flat-field grating of radius 5649 mm (fabricated by Hitachi, Ltd.) was built to detect the EUV emission from LPP. The detector was a 1340×400 pixel array back-illumination-type x-ray CCD (Princeton Instruments), which recorded the EUV emission normal to the target surface. Zr film filters with a thickness of 500 nm were used to block visible light and pass EUV radiation for the spectrograph. The transmittance of the Zr filters at 13.5 nm was about 20%.
For fast-gated imaging, the integrated visible emission from the expanding plasma was collected through a quartz window normal to the direction of expansion using an ICCD (Princeton Instruments) camera. A Nikon lens (f = 105 mm, F/2.8 D) was used to image the plume region onto the camera to form a two-dimensional image of the plume intensity. The gate width was set at 7 ns. The temporal evolution of plasma could be tracked by the delay of the ICCD’s gate.
Ions from LPP were monitored by an FC placed at a distance of 160 mm from the target at an angle of 30° with respect to the normal. The FC consisted of two electrically isolated copper concentric cylinders and the aperture of the FC was 6 mm. To minimize the impact of the secondary electron current, the inner cylinder was negatively biased at −20 V with respect to the grounded outer cylinder. The IC output signal was acquired across a 50 Ω load resistor using a 350 MHz storage oscilloscope (Agilent, DSO-X 3034A).
The emission from the plasma was collected by an optical fiber normal to the direction of the plasma expansion. The optical fiber was connected to the entrance slit of a Princeton SP2750i spectrograph with a focal length of 750 mm equipped with a 300 grooves/mm grating. The spectrograph used in the experiment was an Acton SP2750i with a focus length of 750 mm. The optimum resolution was obtained at the slit width of 20 μm. The spectrograph and ICCD combination provided a maximum resolution of 0.012 nm. An ICCD (PI-MAX-1300) camera was installed at the exit of the spectrograph.
Laser pulses of 216 mJ and a fixed spot size of 100 μm are used to obtain the EUV emission from Sn and SnO2 plasmas. Figures
 | Fig. 2. EUV emission spectra from (a) metal Sn and (b) ceramic SnO2 targets measured by a flat-field grating spectrograph. |
The dependence of the in-band EUV CE on the vacuum degree is evaluated for both plasmas, as shown in Fig.

 | Fig. 3. EUV CE at 13.5 nm of plasmas formed from pure Sn target and ceramic SnO2 target varies with the vacuum degree. The smooth curves represent best fits obtained with exponentially saturating curve fitting. |
As can be seen from Fig.
In addition to radiating the 13.5 nm in-band light, numerous neutral particles are produced by the plasma expansion. We use fast gated imaging employing ICCD for capturing hydrodynamic expansion features of Sn and SnO2 plasma plumes at various vacuum degrees. Typical intensity normalized images obtained after the laser irradiation are shown in Fig.
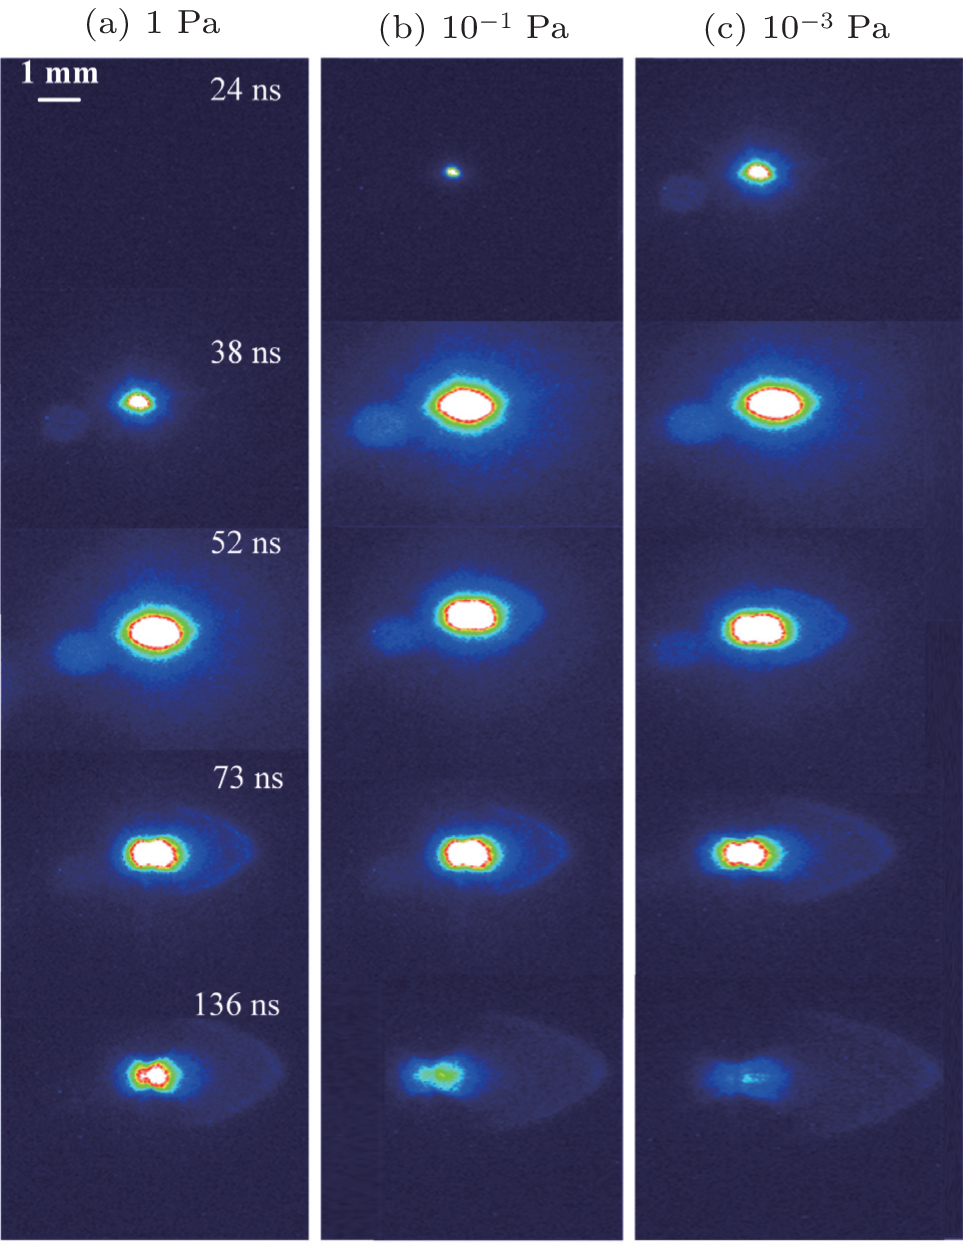 | Fig. 4. Raw ICCD images of Sn and SnO2 plasma plumes with different vacuum degrees ((a) 1 Pa, (b) 10−1 Pa, (c) 10−3 Pa) and laser pulse energy of 216 mJ. Timing starts when the laser reaches the targets. A gate width of 7 ns is used for obtaining these ICCD images. |
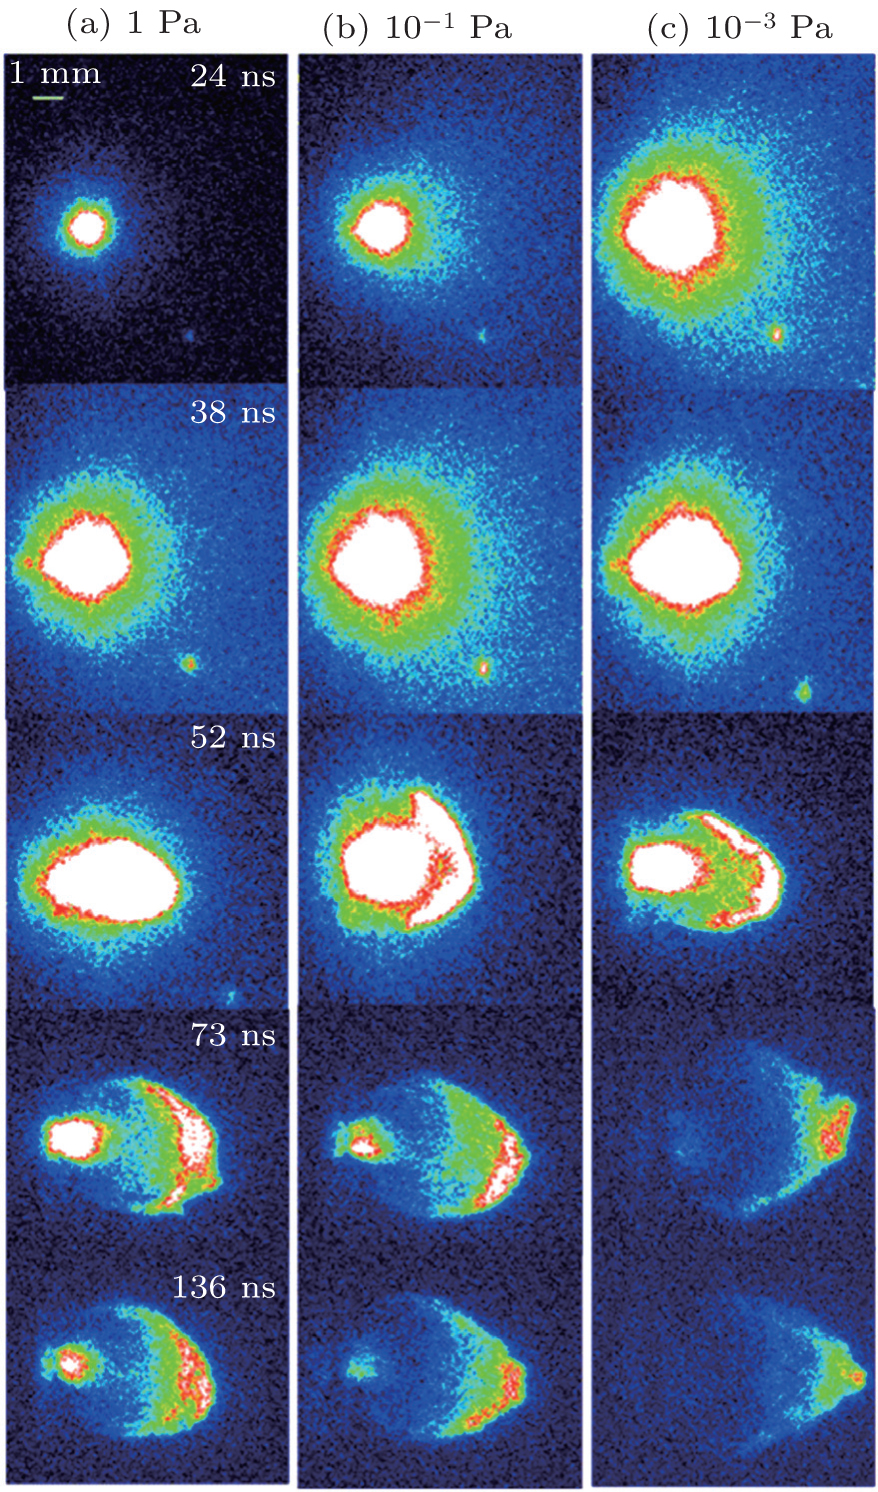 | Fig. 5. Raw ICCD images of SnO2 plasma plumes with different vacuum degrees ((a) 1 Pa, (b) 10−1 Pa, (c) 10−3 Pa) and laser pulse energy of 216 mJ. Timing starts when the laser reaches the targets. A gate width of 7 ns is used for obtaining these ICCD images. |
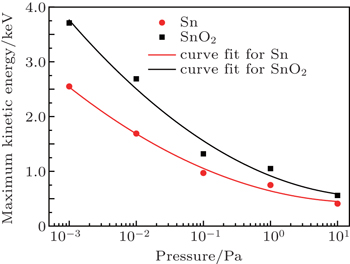
Figure
 | Fig. 6. KEs of Sn and SnO2 plasmas as a function of the vacuum degree. |
Similar results are observed in the ion debris analysis. We compare the ion emissions from Sn and SnO2 plasmas using an FC. TOF ion profiles obtained are shown in Fig.
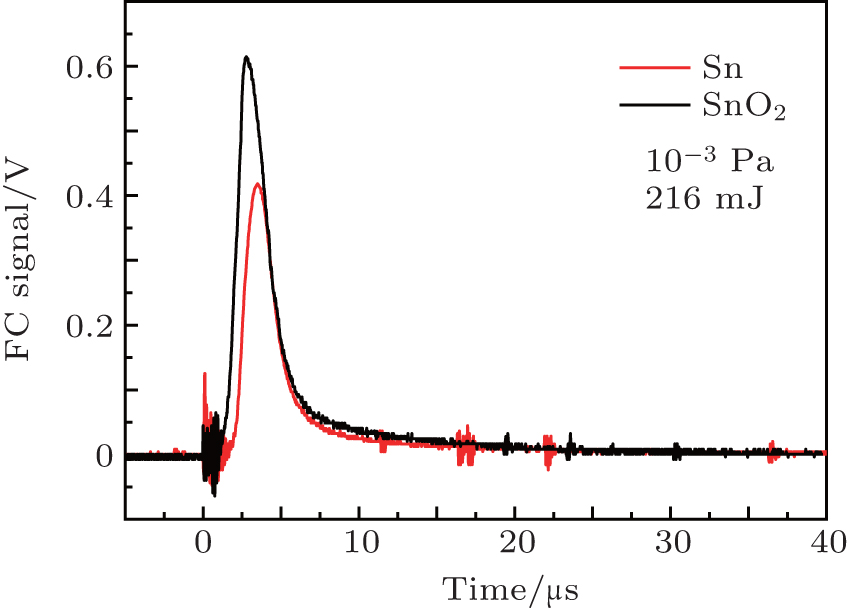 | Fig. 7. Typical ion TOF signals obtained from FC for various target materials (Sn and SnO2). |
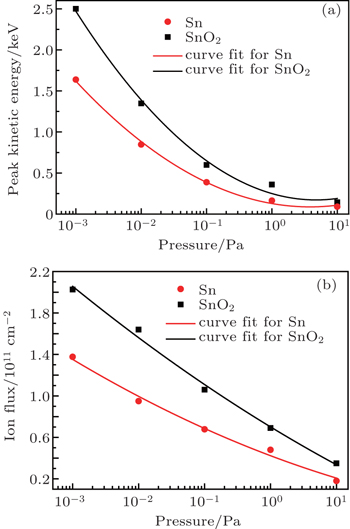
The maximum probable KEs as well as the ion fluxes of Sn and SnO2 plasmas at different vacuum degrees are shown in Fig.

 | Fig. 8. (a) The maximum probable KEs and (b) the ion fluxes of Sn and SnO2 plasmas as a function of the vacuum degree. The smooth curves represent best fits obtained with an exponentially saturating curve fitting. The ion flux is calculated assuming the same charge state for all ions. |
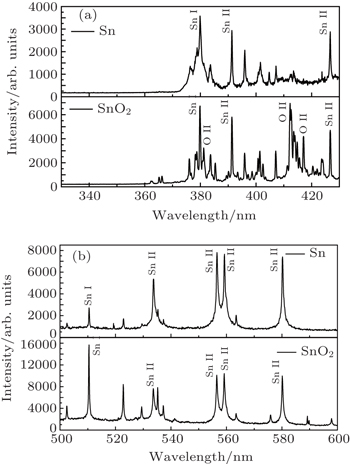
All the spectra in the wavelength region of 200–700‘nm are collected and the time evolution spectra from laser-produced Sn and SnO2 plasmas are observed in two spectral regions (330–430 nm and 500–600 nm), monitored at 100 ns delay with a fixed gate width time of 7 ns, as shown in Figs.
 | Fig. 9. Emission spectra of Sn and SnO2 plasmas generated by Nd:YAG laser at a delay time of 100 ns: (a) 330–430 nm spectral region, (b) 500–600 nm spectral region. |
Using OES, we estimate the electron temperature and density of laser ablation plumes. At early time, most of the emission is the continuous spectrum from plasma. As time evolves, the line spectrum dominates the whole spectrum, the temperature and density can be estimated for the entire duration of the expansion of the plume. The plasma electron temperature is obtained from singly ionized Sn emission lines by the Boltzmann plot method, while the electron density measurements are made using the Stark broadening method.[23] Figure
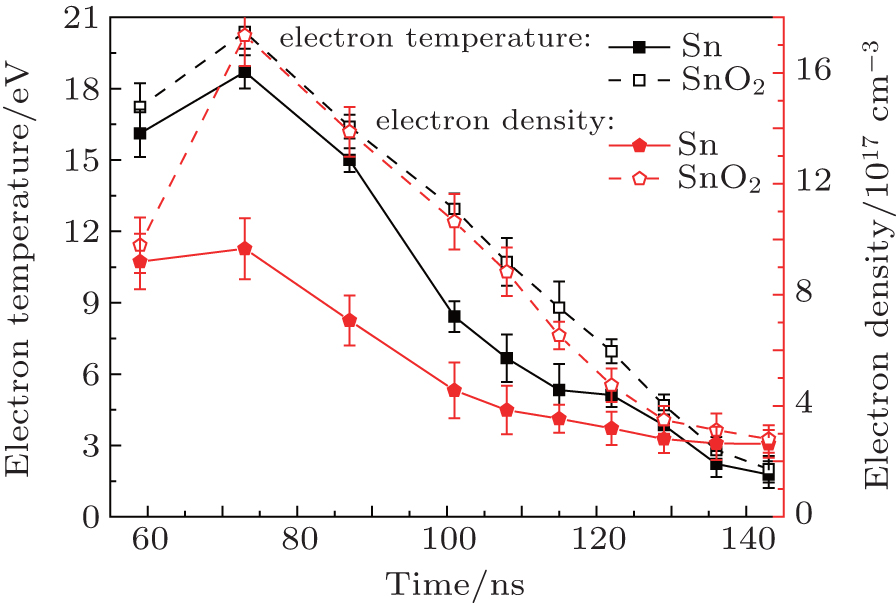 | Fig. 10. Temporal variation of the electron temperature and density of both plasmas produced by Nd:YAG laser of 216 mJ at 10−3 Pa. |
Moreover, the impacts of the vacuum degree on the plasma parameters are investigated. Figure
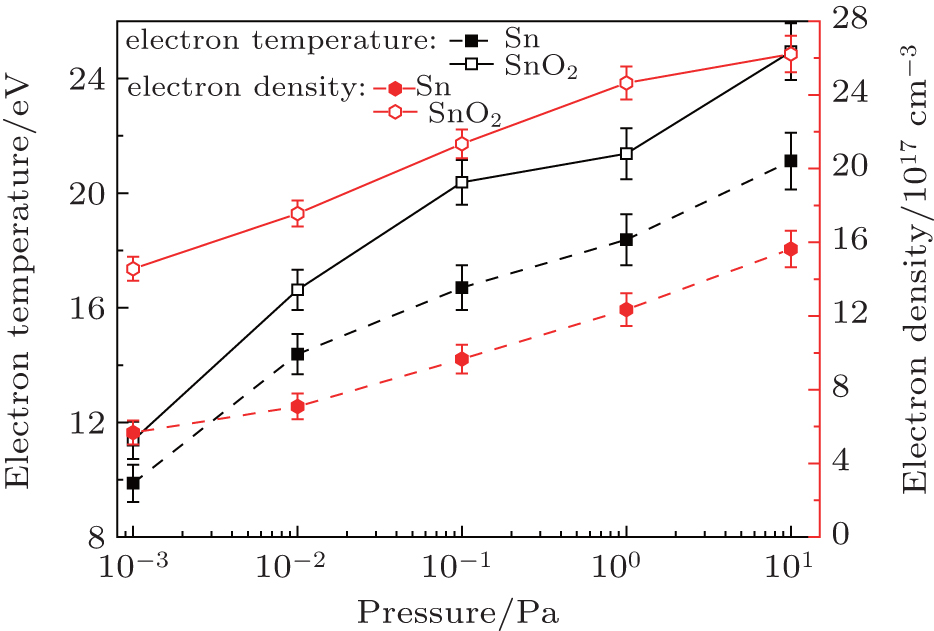 | Fig. 11. Variation of electron temperature and density with vacuum degree. The incident laser pulse energy is 216 mJ. |
The electron temperature and electron density are considered to be two of the most important parameters of plasma, as other parameters are highly dependent on them. So we also investigate the effect of the laser pulse energy on the electron temperature and density of both plasmas. The laser energy can be changed from 50 mJ to 216 mJ by adjusting the quartz attenuation. Figure
 | Fig. 12. Variation of maximum electron temperature and density with incident laser pulse energy. The pressure in the chamber is 10−3 Pa. |
We have conducted a comprehensive comparison of EUV emission, plume expansion, ion debris features, and optical spectrum of Nd:YAG laser produced metal Sn and ceramic SnO2 plasmas under identical experimental conditions. Moreover, the influence of the vacuum degree on both plasmas has been studied in the experiment.
The EUV spectra of Sn and SnO2 plasmas possess similar line structures with the peak emission occurring at about 13.5 nm, and a narrower spectral bandwidth is obtained from the ceramic SnO2 target compared to that from the pure Sn metal target. The intensity of the EUV spectrum decreases with increasing background gas pressure. For fixed laser pulse energy and pressure, the EUV radiation from the ceramic SnO2 target is lower than that from the metal Sn target, which is primarily due to the low density of Sn ions. The Sn plasma reaches a peak CE of 1.03%, the peak SnO2 CE is 0.69%, both at the pressure of 10−3 Pa, and both EUV CEs decrease with the increase of the gas pressure.
The hydrodynamic expansion features of the plasma plume under different vacuum degrees are investigated using ICCD imaging fast photography. The wave front boundaries and shapes of the plasma plumes are differet. Under the same delay and pressure, the SnO2 ion plasma plume has a much broader ion profile and an increased boundary distance compared to those of the Sn plasma plume. The calculation results show that the kinetic energies of both plasmas decrease with increasing background gas pressure and the ion kinetic energy of the SnO2 plasma is higher than that of the Sn plasma under the same pressure.
The total number of ions emitted from the SnO2 plasma is larger than that from the Sn plasma. The peak ion kinetic energies and ion fluxes of the Sn and SnO2 plasmas are observed to be dependent on the gas pressure, and display an exponentially saturating trend. The SnO2 plasma is found to have a larger kinetic energy and, as a result, larger ion debris when compared with the Sn plasma. The SnO2 plasma has been found to be more damaging to multilayer mirrors (MLMs) due to the higher peak KEs and greater ion fluences.
The optical emissions generated by the Nd:YAG laser with Sn and SnO2 have also been investigated using time-resolved OES measurements. Under the identical experiment condition, the emission lines of the SnO2 plasma are much stronger than those of the Sn plasma, which depend on the thermodynamic properties of the target material. The temporal variations of the plasma parameters (electron temperature and density) have also been investigated. It is observed that the electron temperature and density of the SnO2 plasma are higher than those of the Sn plasma. The difference in the SnO2 and Sn plasma temperatures may result from the power absorbed by the expanding plasma, and the ion density depends on the electron density of the plasma. Furthermore, strong enhancements of the plasma parameters with increasing pressure are observed. As the vacuum degree increases, the electron density and electron temperature increase. Furthermore, the effect of the laser pulse energy on the plasma parameters has also been investigated. The results show that the electron temperature and density of both plasmas increase with the increase of the laser pulse energy. Under the identical experiment condition, the plasma parameters of the SnO2 plasma are higher than those of the Sn plasma because of more energy being absorbed from the higher incident laser pulse.
In conclusion, both the total amount of ions and the kinetic energy are higher in the SnO2 plasma, while the EUV conversion efficiency is lower, compared with the Sn plasma.
| 1 | |
| 2 | |
| 3 | |
| 4 | |
| 5 | |
| 6 | |
| 7 | |
| 8 | |
| 9 | |
| 10 | |
| 11 | |
| 12 | |
| 13 | |
| 14 | |
| 15 | |
| 16 | |
| 17 | |
| 18 | |
| 19 | |
| 20 | |
| 21 | |
| 22 | |
| 23 |