Du Li-Jun, Chen Ting, Song Hong-Fang, Chen Shao-Long, Li Hai-Xia, Huang Yao, Tong Xin, Gao Ke-Lin, Guan Hua†. Compensating for excess micromotion of ion crystals* . Chinese Physics B, 24(8): 083702
Permissions
Compensating for excess micromotion of ion crystals*
Du Li-Juna),b),c), Chen Tinga),b),c), Song Hong-Fanga),b),c), Chen Shao-Longa),b),c), Li Hai-Xiaa),b),c), Huang Yaoa),b), Tong Xina),b), Gao Ke-Lina),b), Guan Hua†a),b)
State Key Laboratory of Magnetic Resonance and Atomic and Molecular Physics, Wuhan Institute of Physics and Mathematics, Chinese Academy of Sciences, Wuhan 430071, China
Key Laboratory of Atomic Frequency Standards, Wuhan Institute of Physics and Mathematics, Chinese Academy of Sciences, Wuhan 430071, China
University of Chinese Academy of Sciences, Beijing 100049, China
*Project supported by the National Basic Research Program of China (Grant Nos. 2012CB821301 and 2010CB832803), the National Natural Science Foundation of China (Grant Nos. 11004222 and 91121016), and the Fund from Chinese Academy of Sciences.
Abstract
A new method of compensating for the excess micromotion along two directions in three-dimensional Coulomb crystals is reported in this paper; this method is based on shape control and optical imaging of a Coulomb crystal in a sectioned linear ion trap. The characteristic parameters, such as the ion numbers, temperatures, and geometric factors of different ion crystals are extracted from the images and secular motion excitation spectra. The method of controlling the shape of the ion crystals can be used in cold ion experiments, such as sympathetically cooling, structural phase transitions, and selective-control of ions, etc.
PACS:
37.10.Ty; 37.10.Rs; 52.65.Yy; 64.70.kp
Keyword:
ion crystals; excess micromotion; secular motion exciting
Ion Coulomb crystals exhibit a series of solid-state properties originating from strongly coupled and confined non-neutral ion ensembles with the same type of charge. They are formed in ion traps when the nearest neighboring Coulomb potential energy is 170 times larger than the average kinetic energy of the ions.[1] Up to now, almost all the large ion Coulomb crystals have been cooled to a few millikelvin by laser cooling in linear traps.[1– 5] Such ion crystals are promising physical systems for studying phase transitions, [6– 8] quantum computer, [9, 10] quantum logic spectroscopy, [11, 12] precision spectroscopy, [13– 17] etc. The rapid motions, which trapped ions undergo in a time-dependent radio-frequency (RF) potential, are called micromotion. Usually, a residual static voltage existing in an ion trap displaces the ions from the nodal line of the RF field and results in excess micromotion.[18] The excess micromotion heats the ions, and causes the broadening and shift of the spectroscopic transitions. Therefore, the high-precision compensation for the ion excess micromotion plays an important role. For a single ion or a few ions in a linear ion crystal, the excess micromotion can be reduced by monitoring the photon-correlation spectrum. The weak modulation of the ion fluorescence correlates with the phase of the RF trapping voltage. A detailed description of the method can be found in Ref. [18]. In Coulomb crystals with a three-dimensional or zigzag structure, as a major portion of the ions stay away from the trap center, the RF-induced micromotions have opposed phases, and their modulated fluorescence signals cancel each other; thus, the photon-correlation spectrum becomes insensitive to the excess micromotion.
In this paper, the experimental method of compensating for the micromotion and controlling the shape control of large Coulomb crystals with micrometer-precision in a sectioned linear Paul trap is described. By varying the trapping parameters, the characteristic parameters of different ion crystals are achieved.
2. Experimental setup
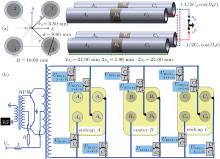
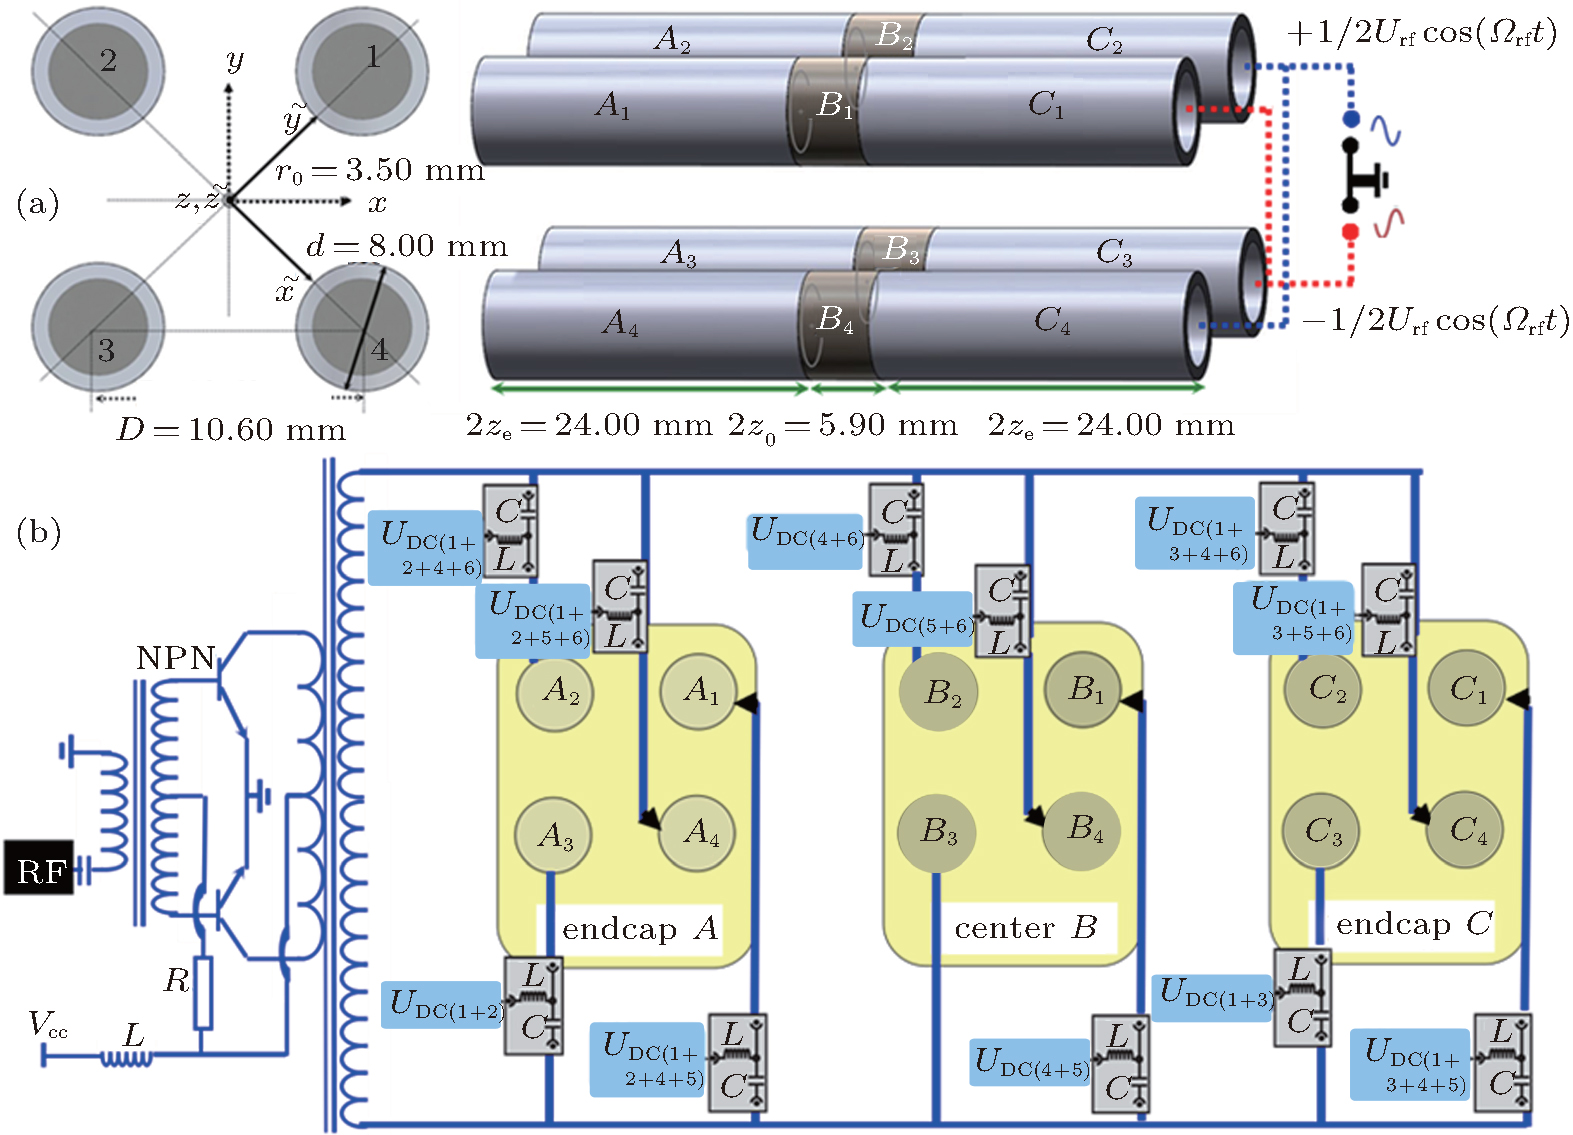
The linear Paul trap used in our experiments, shown in Fig. 1(a), consists of four parallel three-sectioned stainless-steel cylindrical electrode rods in a quadrupole configuration. The lengths of the center and end electrodes are 2z0 = 5.90 mm and 2ze = 24.00 mm, respectively. The electrode rod diameter and the minimum distance between the trap axis and the electrodes are d = 8.00 mm and r0 = 3.50 mm, respectively. The confinement of the ions in the radial plane is obtained by applying an RF field 1/2Urf cos (Ω rft) to the diagonal A1, B1, C1, and A3, B3, C3 electrode rods, and, at the same time, an RF field with opposite phase − 1/2Urf cos (Ω rft) to the diagonal A2, B2, C2, and A4, B4, C4 electrode rods. The RF voltage is generated by a frequency generator, then amplified and transferred to a pair of power triodes via two magnetism resonant circuits. A set of direct-current (DC) voltages are applied to all 12 electrodes by using six individual DC powers. The diagram of the applied electronic circuits is shown in Fig. 1(b). The RF frequency can be varied from 3.50 MHz to 4.50 MHz, and the output amplitude 1/2Urf can be adjusted from 40 V to 200 V. Three DC powers (DC1, DC2, and DC3) are used to supply the voltages to the eight end rod electrodes (A1, A2, A3, A4, and C1, C2, C3, C4) in a range of 0.010 V– 20.000 V to confine the ions in the axial direction. The DC4 is used to remove unwanted ions. The DC5 and DC6 are used to change the positions of the ions along the x and y directions, respectively.
Fig. 1. (a) Sketch of the linear Paul trap; (b) block diagram of the trap power electronics.
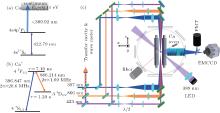
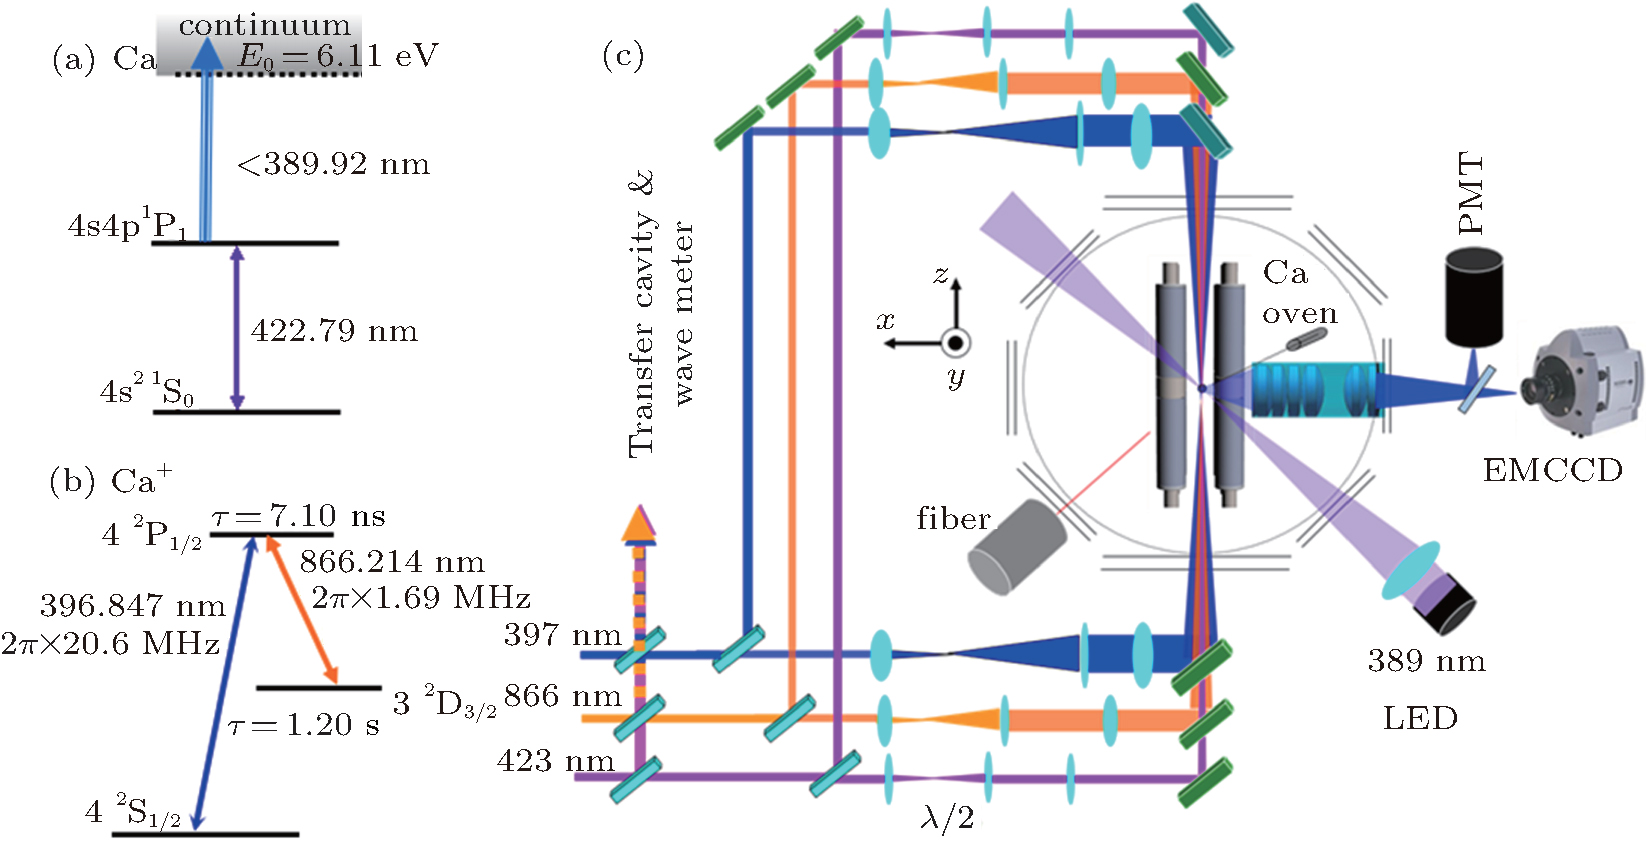
As shown in Fig. 2(a), the ions are loaded by two-photon photoionization.[19] An atomic beam is produced by evaporating natural abundant calcium atoms and intersected with a 423-nm laser and a 389-nm light emitting diode (LED) in the center of the trap. Figure 2(b) shows the relevant energy level scheme for Doppler cooling of 40Ca+ with wavelengths and partial decay rates for the dipole allowed transitions. The 40Ca+ ions are subsequently Doppler laser cooled[20– 22] to a crystalline state with a temperature of a few millikelvin by using a 397-nm cooling laser and a 866-nm repumping laser to excite the 42S1/2– 42P1/2 and 3d2D3/2– 4p2P1/2 transitions along the trap center (z) axis, respectively. The radial kinetic energy of the ions is reduced indirectly through the Coulomb interaction between the radial and axial degrees of freedom. Figure 2(c) shows an overview of the experimental setup. The detection of the ions is performed by an imaging system with 13– 15 times magnification, which collects spontaneously emitted light at 397 nm during the laser cooling cycles to a photo-multiplier tube (PMT) and an electron-multiplying coupled-charge device camera (EMCCD). Both of them are placed perpendicularly to the trap z axis, monitoring the fluorescence intensity and position of the ions projected onto the yz planes, respectively. Only the ions close to the yz plane of the Coulomb crystal are imaged without micromotion, as their micromotion direction is parallel to the view orientation of the detection system. The three-dimensional structure of the Coulomb crystal could be obtained from the rotational symmetry structure of the Coulomb crystal boundary around the trap axis. A 245-μ m diameter optical fiber is inserted in the trap center and imaged for an absolute calibration of the magnification of the microscopy lens at 13.31.
Fig. 2. Reduced level scheme for 40Ca atoms (a) and for Doppler cooling of 40Ca+ with wavelengths and partial decay rates for the dipole allowed transitions (b). Schematics of the laser, light emitting diode, and linear Paul trap setup (c).
3. Compensation for excess micromotion and realization of single-component crystal of 40Ca+ ions
The motion of a single confined ion near the center of the trap can be described by the motion in a harmonic pseudo-potential[23, 24]
where the stability trapping parameter q is considerably smaller than 1.[25] The axial frequency ω z and radial frequency ω r (r = x̃ , ỹ ) are given by
where Ω rf is the frequency of the applied RF potential (with amplitude 1/2Urf), η is a constant related to the trap geometry, 2z0 is the length of the axial trapping electrodes, r0 is the minimum distance between the trap axis and the electrodes. Q and M are the charge and mass of the ion, respectively.
The effective trap potential changes from a cylindrical symmetry to an elliptical symmetry by applying an additional quadrupole potential UDC4. The radial trap frequency ω r splits into two different transverse frequencies, ω x̃ and ω ỹ , which are given by
In the experiments, impurities with mass values larger than that of 40Ca+ can be removed from the trap by controlling ω x̃ and ω ỹ .
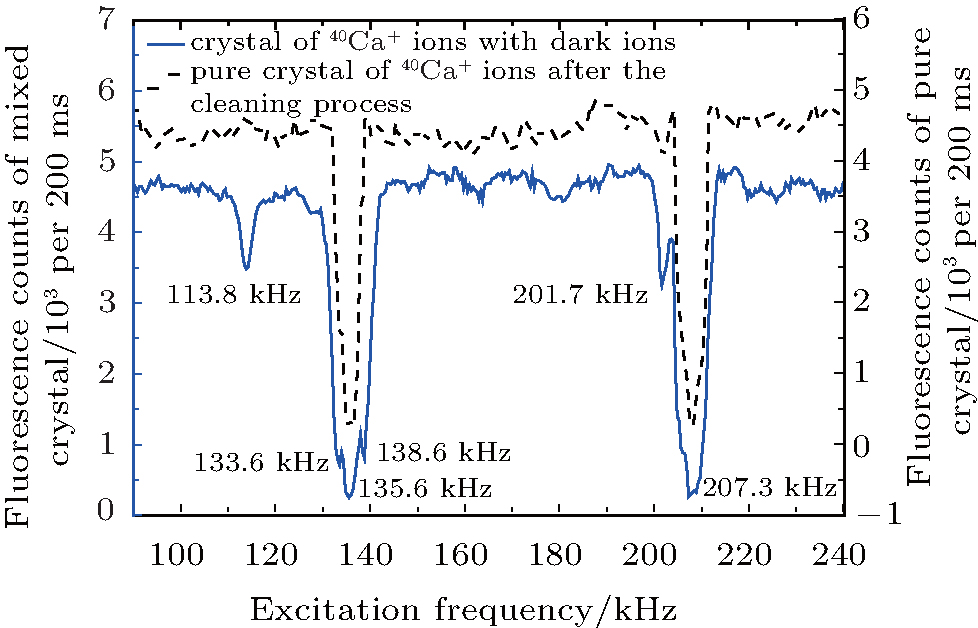
In the generation and laser cooling process of the 40Ca+ ions, a few impurity molecular ions, such as 40CaOH+ and 40CaH+ , are formed by chemical reactions between 40Ca+ ions and the residual gases of H2O and H2 in the vacuum chamber.[26] They are identified from the laser-induced fluorescence secular motion frequency spectrum as shown in Fig. 3. The resonant frequencies of 135.6 kHz and 207.3 kHz are the center-of-mass (COM) mode motion frequencies of 40Ca+ in the axial and radial directions, respectively. The resonant frequencies of 113.8 kHz and 138.6 kHz, and the resonant frequencies of 133.6 kHz and 201.7 kHz are the COM mode motion frequencies of 40CaOH+ and 40CaH+ in the axial and radial directions, respectively. All the resonant frequencies are in good agreement with the results calculated according to Eqs. (2) and (3). Impurity ions appearing in the outer regions of the inner 40Ca+ cylindrical crystals, as their mass values are heavier than those of the 40Ca+ ions.[27] As the cooling and repumping lasers are isotope-selective to the 40Ca+ ions, only the fluorescence of 40Ca+ ions can be detected by the PMT and EMCCD. The impurity ions are sympathetically cooled by the 40Ca+ ions and identified as defects or dark parts in the images of the crystals as shown in Figs. 4(a)– 4(e). Initially, the dark ions are not distributed evenly in the periphery of the ion crystals without the compensation for the DC potential; this may suggest that the center (z) axial line of the Coulomb crystal is not strictly in line with the minimum of the RF potential because of the patch potential produced by the calcium atoms attached on the trap rods, the finiteness machining precision of the trap, and the imperfect match of the amplitude of the sinusoidal oscillating voltage on the adjacent rods, supplied by the home-made RF circuit.
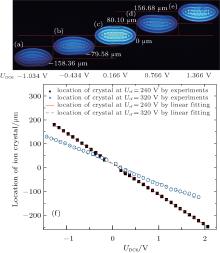
Fig. 4. Relation between the location of the ion Coulomb crystal and the compensation voltage of DC6. The position of the Coulomb crystal moves linearly with the change of the compensation voltage UDC6 as shown in panels (a)– (f).
In the experiments, the positions of the ions can be determined with an accuracy of 0.6 μ m from the resolution images of the EMCCD. The ions are moved with an accuracy of 0.13 μ m by changing the electric potential of the compensation rods. The imperfections of the RF amplitude and phase can be corrected by adding a capacitance in parallel or series to the electrodes. The RF signal applied to the trap has a strictly opposite phase, but an initial 4% error in amplitude. This difference is reduced to 0.5% by adding a load capacitance in parallel to the electrodes, which have a relatively large potential value. Under the above conditions, a clear image of the crystal is obtained as shown in Fig. 4(a), with the dark ions visible on the lower part of the ion crystals. As the effective potential of the heavy ions in an RF-trap is lower than that of the light 40Ca+ ions, the heavy ions are farther away from the minimum line of the RF potential, appearing as outer layer dark parts. The best compensation for the Coulomb crystal along the x and y directions is obtained when the dark ions are evenly distributed on both sides of the ion crystals by adjusting DC6 and maximized on both sides of the ion crystals with DC5. The symmetrical dark regions appearing around the 40Ca+ ions are shown in Fig. 4(c), which reveals that the location of the Coulomb crystal has been adjusted in the center of the radial direction with micrometer accuracy.
A series of images of the ion crystals at different positions of compensation relative to the nodal line of the RF field at Urf = 240 V is measured and shown in Figs. 4(a)– 4(e). An approximately linear relationship between the position of the Coulomb crystal and compensation voltage UDC6 is found through detailed statistics at two different amplitudes of RF as shown in Fig. 4(f). This phenomenon can be explained by considering the fact that the center (z) axial line of the ion crystal is close to the center of the harmonic potential. The harmonic potential can be converted into an approximately linear potential at the minimum of the RF potential by using a first order Taylor expansion. The Coulomb crystal moves with a slope of 128.3 (9) μ m/V at Urf = 240 V and a slope of 90.5 (7) μ m/V at Urf = 320 V. The slope of this relationship decreases with increasing Urf. This result can be attributed to the fact that a deeper potential by a larger Urf leads to a tighter confinement of ions. A larger compensation voltage is needed to drive the ions traveling the same distance in a deeper potential.
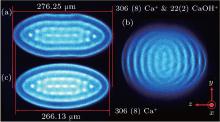
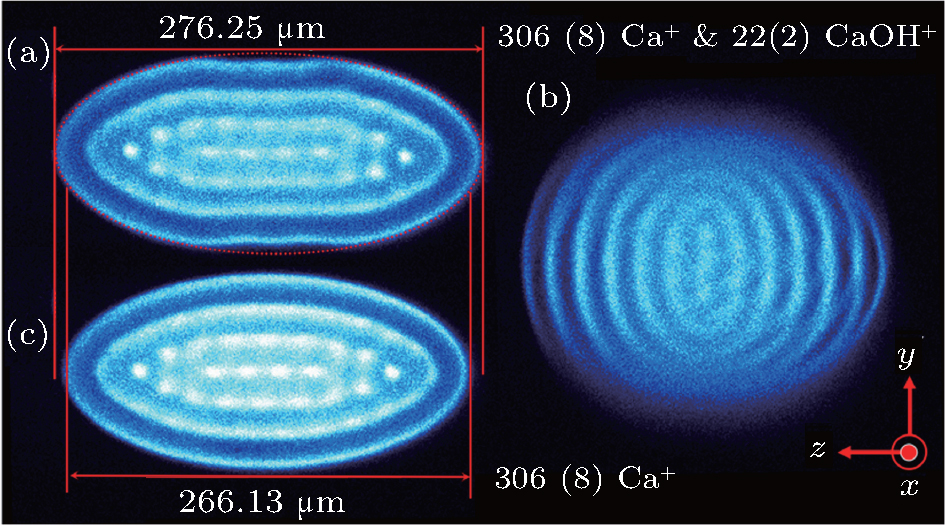
With an additional static quadrupole potential (UDC4) on a pair of diagonal electrodes (A2, A4, B2, B4, and C2, C4), the Coulomb crystals with different principal axes in the x̃ and ỹ directions exhibit two different radial trap frequencies, ω x̃ and ω ỹ shown in Eq. (4). Owing to the increased anisotropy of the effective trap potential, the heavier ions in the outer regions of the 40Ca+ crystal as shown in Fig. 5(a) move to an instability area and left the trap. By reducing the UDC4 to 0, the remaining ions form a single-component crystal of 40Ca+ ions with cylindrical symmetry as shown in Fig. 5(c). The purification process of the mixed ion Coulomb crystal is shown in Fig. 5(b).
Fig. 5. Images of the cleaning process of the impurity ingredients. (a) Heavier ions are located in the outer regions of the 40Ca+ crystal because of the mass dependence of the radial trapping potential. (b) Heavier ions are removed from the trap by applying an additional voltage to A2, A4, B2, B4, and C2, C4. (c) A single-component crystal of the 40Ca+ ions is obtained after the cleaning process.
4. Distribution of ion numbers versus temperature
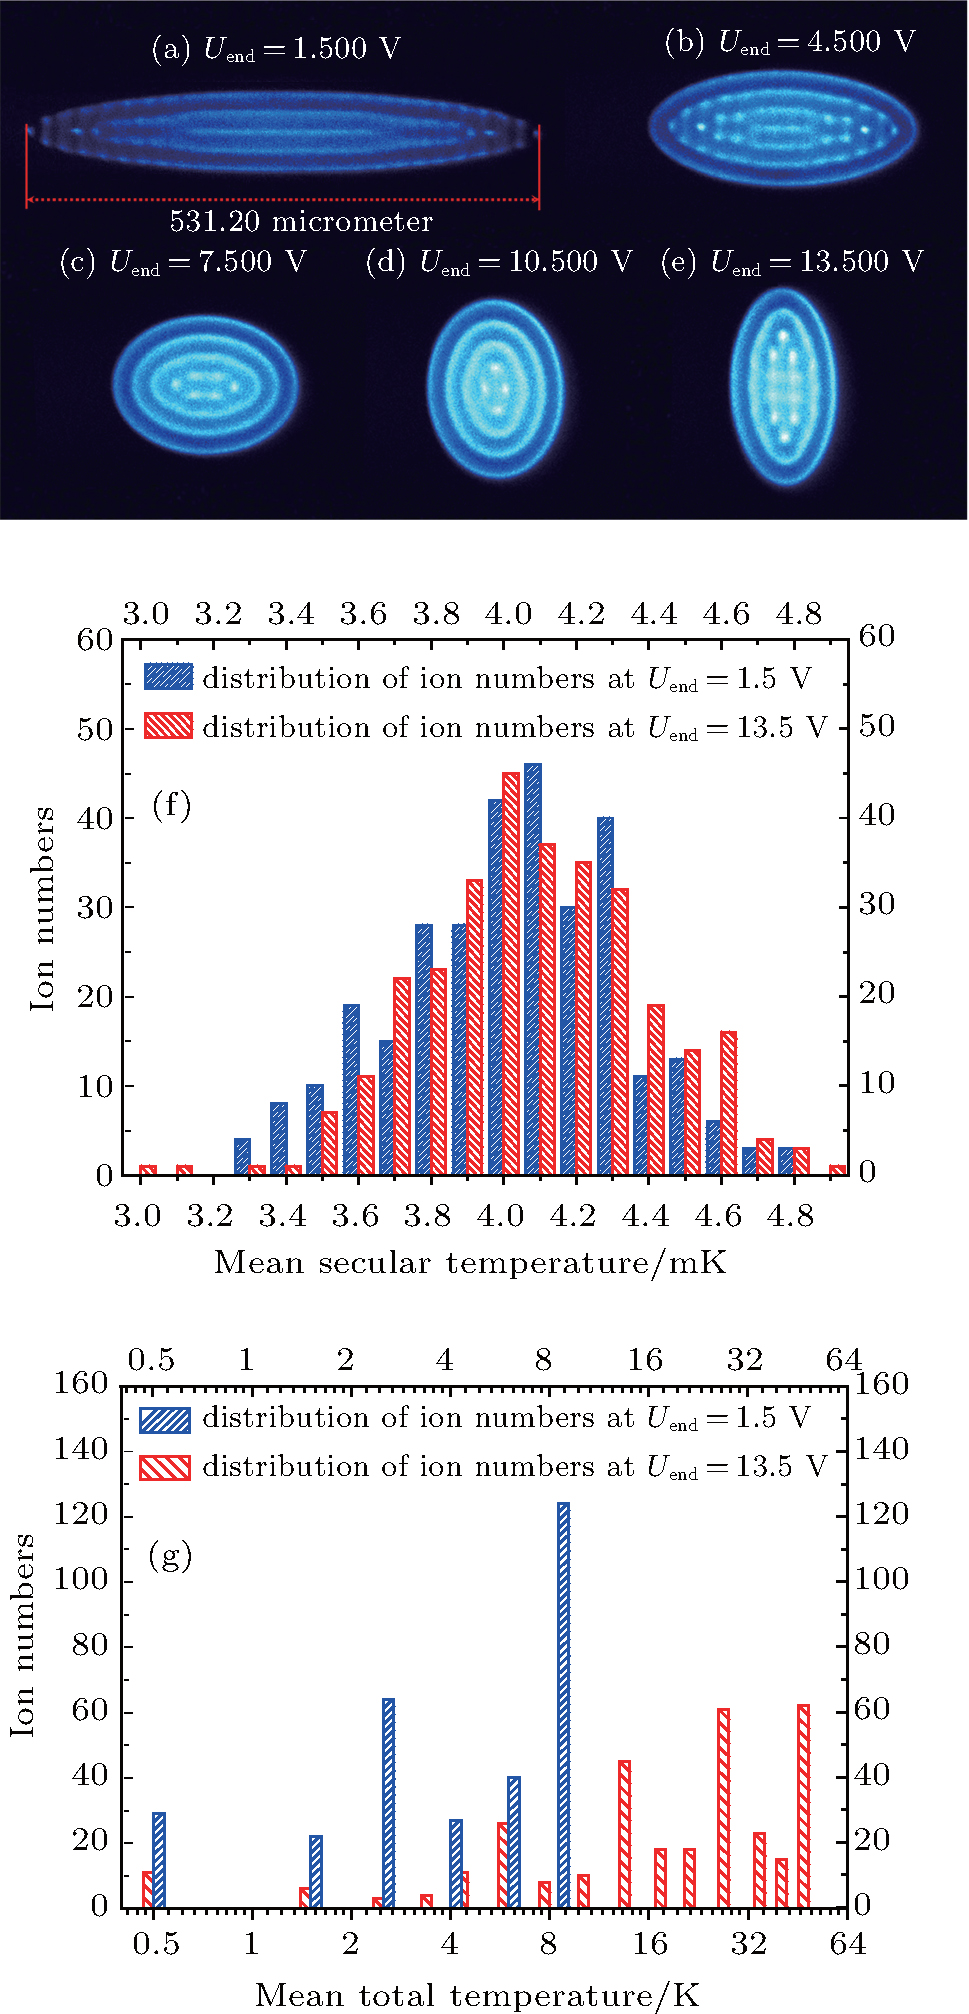
The Coulomb crystal exhibits an ellipsoidal structure with a cylindrical symmetry whose shape could be altered as shown in Figs. 6(a)– 6(e), by varying Uend from 1.000 V to 13.500 V, under the conditions of Urf = 240 V and constant number of ions. For the Coulomb crystals (Figs. 6(a) and 6(e)), the mean secular temperature[27] and mean total temperature distribution of the ions are obtained from molecular dynamics simulations (Figs. 6(f) and 6(g)). As shown in Fig. 6(f), the mean secular temperature distribution of the ions remain almost unchanged for the different shapes of the Coulomb crystals; the difference in the mean secular temperature is as small as 2 mK. However, the number of ions with a high total temperature increases rapidly with the increase of the radial distribution of the Coulomb crystal as shown in Figs. 6(a)– 6(e). The mean total temperature distribution of the ions is also discrete because of the layered structure of the ion crystals. To minimize the excess micromotion, the Coulomb crystals should be distributed symmetrically around the nodal line of the trapping potential. The outer ions experience a stronger RF field and have higher micromotion. Therefore, a precise control of the location of the Coulomb crystals with the larger radial distribution is necessary to ensure the lowest excess micromotion of the Coulomb crystals.
Fig. 6. (a)– (e) Images of yz plane projections of 306(8) 40Ca+ ions with axial potentials varying from Uend = 1.500 V to 13.500 V. Panels (f) and (g) are the mean secular temperature and mean total temperature distribution, respectively.
5. Extracting of trap parameters
The geometric factor η is an important parameter of the Paul trap and it can be obtained from the simulation or analysis of the trap structure by using analysis methods such as Maxwell or SIMION models. However, it may show a deviation from the actual value because of the finite precision in the mechanical machining and assembling process. On the other hand, η can also be obtained from the measurement of the secular motion frequency in the axial direction of the laser-cooled 40Ca+ ions in the experiment. A large deviation from the measurements of both the RF-amplitude and secular motion exciting frequency limits the precision of η .
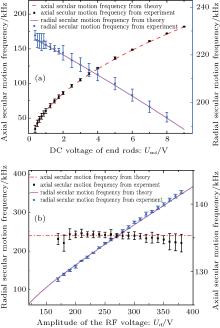
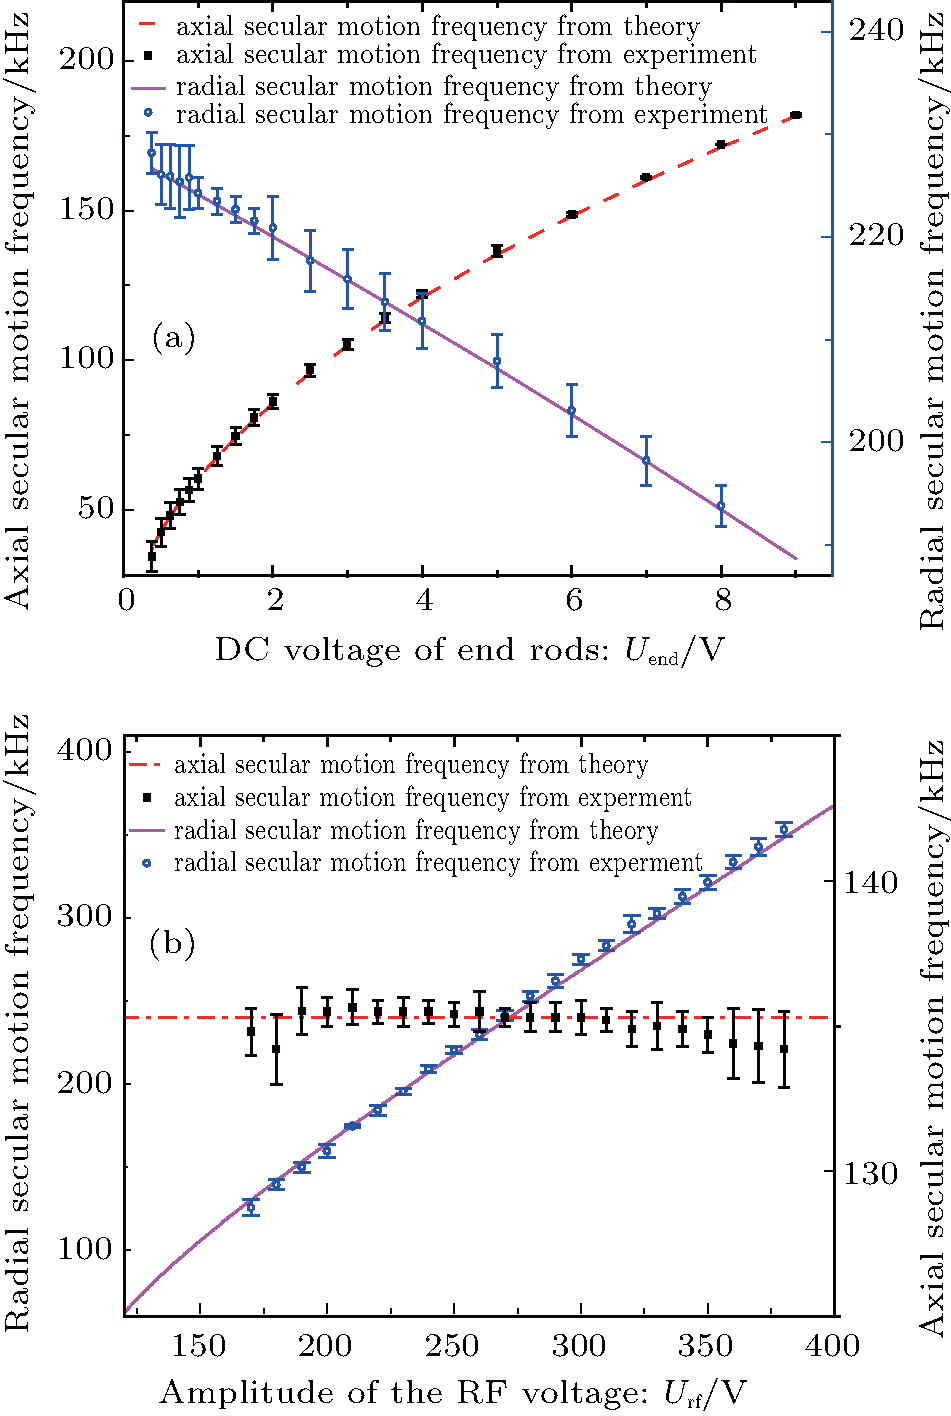
Experimentally, a series of axial secular motion frequencies ω z and a series of radial secular motion frequencies ω r are obtained as a function of Uend for Urf = 240 V as shown in Fig. 7(a), and as a function of Urf for Uend = 5.000 V as shown in Fig. 7(b). To this end, a weak AC electric field and potential are introduced for the external excitation of the axial and radial motion of the 40Ca+ ion crystals in the harmonic trap potential. The drop of the fluorescence signal is detected from the laser cooled 40Ca+ ions when the AC electric field and potential frequencies resonate with the secular motion frequencies of the ions. The measured secular frequencies of the ions are fitted into Eqs. (2) and (3), giving a geometric factor of η = 0.26513 (7). This geometric factor is directly used in molecular dynamics simulations.
Fig. 7. Measured and calculated detailed secular motion frequencies of 40Ca+ ion crystals at different values of Uend (a) and Urf (b).
6. Conclusions and outlook
In the present paper, a simple and effective method to compensate for the excess micromotion and control the shape of a three-dimensional Coulomb crystal with micrometer precision in a sectioned linear ion trap is demonstrated. The geometric factor η = 0.26513 (7) is obtained from the measurements of a secular motion excitation frequency of the ions for different trapping potentials. The ability to control the various shapes of the ion crystals with micrometer precision ushers in several fields for further study of cold ion crystals, such as dynamically excited ion Coulomb crystals, sub-regional laser cooling, sympathetically cooling, and high resolution spectroscopy detection.
Acknowledgment
We are indebted to Shi Ting-Yun for fruitful discussion.
... [18] The excess micromotion heats the ions, and causes the broadening and shift of the spectroscopic transitions ...
... [18] ...
1
2014
0.0
0.0
... [19] An atomic beam is produced by evaporating natural abundant calcium atoms and intersected with a 423-nm laser and a 389-nm light emitting diode (LED) in the center of the trap ...
1
1978
0.0
0.0
... ions are subsequently Doppler laser cooled[20#cod#x2013 ...
1
1978
0.0
0.0
1
1975
0.0
0.0
... 22] to a crystalline state with a temperature of a few millikelvin by using a 397-nm cooling laser and a 866-nm repumping laser to excite the 42S1/2#cod#x2013 ...
1
1968
0.0
0.0
... ionsThe motion of a single confined ion near the center of the trap can be described by the motion in a harmonic pseudo-potential[23,24] ...
1
1969
0.0
0.0
... ionsThe motion of a single confined ion near the center of the trap can be described by the motion in a harmonic pseudo-potential[23,24] ...
1
1998
0.0
0.0
... [25] The axial frequency #cod#x03C9 ...
1
1988
0.0
0.0
... [26] They are identified from the laser-induced fluorescence secular motion frequency spectrum as shown in Fig ...
2
2007
0.0
0.0
... [27] As the cooling and repumping lasers are isotope-selective to the 40Ca#cod#x002B ...
... 6(a) and 6(e)), the mean secular temperature[27] and mean total temperature distribution of the ions are obtained from molecular dynamics simulations (Figs ...
Compensating for excess micromotion of ion crystals*
[Du Li-Juna),b),c), Chen Tinga),b),c), Song Hong-Fanga),b),c), Chen Shao-Longa),b),c), Li Hai-Xiaa),b),c), Huang Yaoa),b), Tong Xina),b), Gao Ke-Lina),b), Guan Hua†a),b)]


 ]
]