

Redox-mediated reversible modulation of the photoluminescence of single quantum dots
[Li Yinga) , Liu Ren-Weia), b) , Ma Lia) , Fan Su-Naa), b) , Li Huia) , Hu Shu-Xin†a)  , Li Ming
a) ]
, Li Ming|
|


†Corresponding author. E-mail: hushuxin@iphy.ac.cn
*Project supported by the National Natural Science Foundation of China (Grant Nos. 10904164, 61275192, and 11104328).
Precise control over the photoluminescence (PL) of single quantum dots (QDs) is important for their practical applications. We show that the PL of individual CdSe/ZnS core/shell QDs can be effectively enhanced and continuously modulated by electrochemically manipulating the electron transfer (ET) between the QDs and the attached redox-active ligands such as 2-mercaptoethanol (BME). We found that i) the ET from BME to the QDs’ surface trap states suppresses the blinking of the QDs, ii) the ET from the QDs’ conduction band to the oxidization product results in dimmed PL when BME is oxidized, and iii) further oxidization of BME results in a significant PL brightening. The single particle measurements help us unveil the important features hidden in ensemble measurements and understand the underlying mechanism of the PL modulation. The results also suggest a simple yet efficient method to produce bright and non-blinking QDs and offer opportunities for further development of high resolution fluorescent bioimaging and nanodevices.
Quantum dots (QDs) are promising materials for future optoelectronic devices. The excited electron– hole pairs in the QDs recombine radiatively by emitting photons or non-radiatively through Auger recombination or trap-assisted processes.[1] The latter usually leads to low quantum yield or blinking of the QDs. It is important to increase the quantum yield and suppress the blinking in applications such as biological imaging[2, 3] and quantum information processing[4– 6] which can greatly benefit from long-lasting and non-blinking emitters.[7– 11] On the other hand, nanostructures containing QDs with reversible and controllable modulation of the photoluminescence (PL) intensity have received much attention because of their potential applications in many fields such as smart windows, [12– 16] nanosensors, [3, 17– 21] optoelectronic devices, [22– 25] and memory elements.[26, 27] Even in the application of bio-imaging which usually requires stable fluorescence, periodic PL modulation in combination with phase sensitive detection can be used to discriminate weak signals from large backgrounds.[14, 28, 29]
The precise control over the PL intensity of single QDs needs to be further improved before the QDs can be put into practical applications.[30] Much progress has been made in recent years.[2, 21, 31– 33] Most of the studies focused on direct electron injection by electrodes on which the QDs are deposited.[31, 32, 34– 36] Park et al.[32] reported electric field modulation studies on single QD. The modulation phase was observed to vary over time and the blinking affected the modulation efficiency. This strategy is effective but lack of long-term stability. Other strategies such as the application of electric field through AFM tips[31] provided an efficient method but have difficulty in wide applications. Application of electrochemical methods on single dot has been proposed by Guyot-Sionnest et al.[34– 36] The modulation of single dot PL can be realized through the direct electron transfer between electrode and single quantum dots, but the precision of modulation remains far from practical application. Redox agents can be used to suppress the blinking.[37] Rinehart[38]et al. reported that redox has the ability on improving QDs PL properties. Meanwhile, they raised the issue that the brightening of QDs by redox is difficult to monitor. In this work, we exploit the positive effect of the redox agents to precisely control and periodically modulate the PL of single QDs by using the electrochemical method. We also show that the phenomena at the single particle level enable us to unveil important features that are usually hidden in ensemble measurements and to understand the underlying mechanism easily.
The streptavidin-conjugated and polymer-encapsulated CdSe/ZnS core/shell QDs (QD655; see Fig. A1) were purchased from Invitrogen Corporation. The ITO-coated coverslips (15– 30 Ω , 22 × 26 mm2) were from SPI Supplies. 2-mercaptoethanol (BME) was bought from Sigma and used without further purification. Other chemicals were from the Beijing Chemical Reagent Co. The sample chambers were made by gluing together two clean ITO-coated coverslips with double-sided tapes (50 μ m, 3M Co.). The stock solution of QDs (2 μ m) was diluted to 50 pM with the Tris-HCl (pH = 7.3) buffer before the experiments.
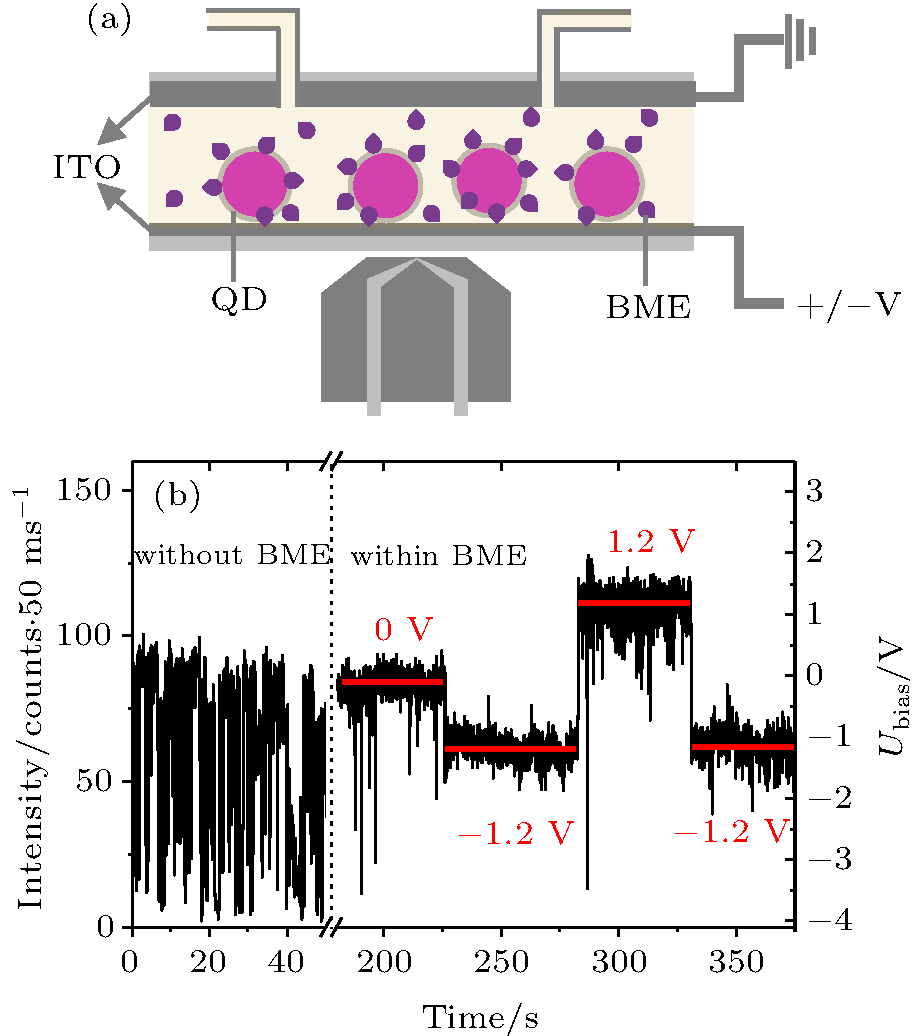 | Fig. 1. (a) Sketch of the experimental setup. (b) A typical PL trajectory of a single QD before and after the addition of 100 mM BME. The electrode potential is varied from 0 V to + 1.2 V and then back to − 1.2 V after the addition of BME. |
The PL of the QDs was collected with an inverted microscope (Olympus IX71) (Fig. 1(a)) equipped with an oil-immersion objective (Olympus, 100× , N.A. 1.35) and an EMCCD camera (Andor, IX897). The QDs were excited by 100 W mecury arc lamp combined with the fluorescence mirror units U-MSWG2 (Olympus, UIS Fluorescence Mirror Units) at the room temperature. An Agilent 30 MHz waveform generator (Agilent, 33522A) was used to generate the external electric fields. The electrochemical experiments were carried out on an electrochemical workstation (CHI660E, CH Instruments Inc.). K3[Fe(CN)6] was used to calibrate the external bias. Before each measurement, 150 μ L of 50 pM QD solution was injected into the chamber and then incubated for 10 min. The excess QDs were flushed out with 400 μ L buffer which contains 20– 200 mM BME. All experiments were performed in ambient conditions.
We first present the stead-state results. We used streptavidin-encapsulated CdSe/ZnS core/shell QDs as the experimental subjects and 2-mercaptoethanol (BME) as the redox agents. The QDs have a narrow, symmetric emission spectrum with the emission maximum near 655 nm and full width at half maximum (FWHM) of less than 40 nm. As the typical type I QDs, the CdSe/ZnS nanocrystallites (Qdot 655, Invitrogen) with high PL quantum yield (QY, over 40%) are commercially available and excellently biocompatible. On the other hand, the high QY and particle stability make the commercial QDs suitable for the study of related ET processes. The QDs on the ITO-coated glass surface (Fig. 1(b)) exhibit pronounced blinking, just as they do on normal glass surfaces. The addition of BME with a final concentration of 100 mM to the sample chamber results in remarkable suppression of the blinking of the QDs, similar to the results of Hohng et al.[37] When a positive bias (Ubias = 1.2 V) is applied to the electrode, the PL intensity of the QDs is enhanced significantly. By applying a negative potential (Ubias = − 1.2 V), the PL of the QDs becomes even lower than that in the non-biased state (Fig. 1(b)).
The changes of the PL intensity in Fig. 1(b) are reversible. We hence applied AC potentials with different waveforms and different frequencies to see if the PL intensity of the QDs can be modulated. The modulation is effective at high bias. Figures 2(a) and 2(b) and figures 2(c) and 2(d) depict typical PL trajectories of single QDs before and after applying a 0.1 Hz square wave potential and a 0.04 Hz triangle wave potential, respectively. Additional results with different waveforms and frequencies (from 0.01 to 5 Hz) can be found in Appendix A (see Figs. A2– A4). All experiments showed that the positive bias enhances the PL and the negative bias decreases the PL. Over 50% of the QDs were modulated effectively in each experiment (Fig. A5(a)).
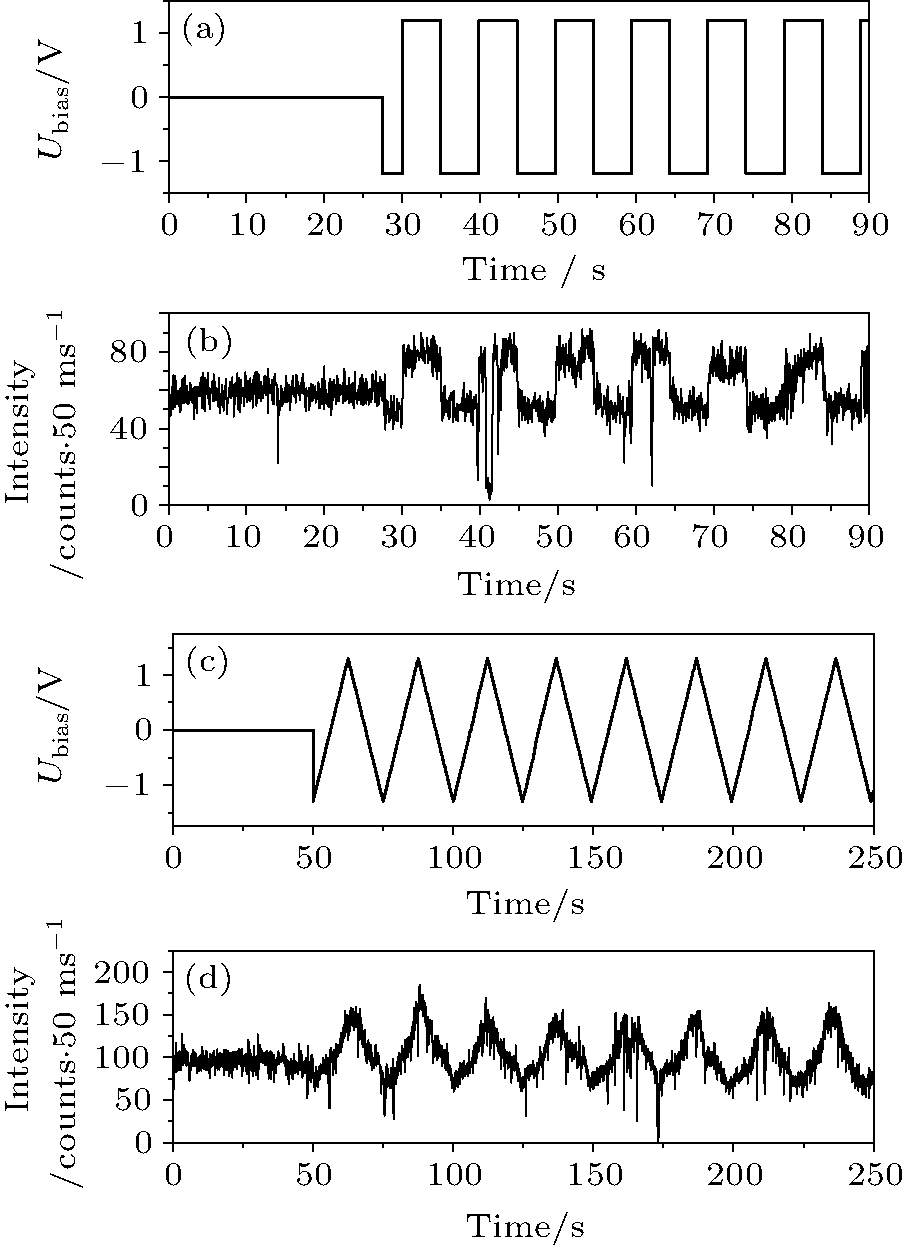 | Fig. 2. Modulation of the PL intensity of a QD by different waveforms and frequencies: (a) the 0.1 Hz square wave potential and (b) the corresponding intensity trace, (c) the 0.04 Hz triangle wave potential and (d) the corresponding intensity trace. |
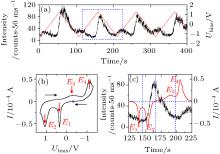
The modulation depends on the concentration of BME. The chance to record a QD with well-modulated PL intensity reduces to < 5% at a low BME concentration of 1 μ m. The periodic modulation is not observable in the absence of BME (see Fig. A6), in which case the behaviors of the QDs are similar to the ones with direct electron injection by electrodes.[34] The results hence indicate that the mechanism of the modulation in our experiments is different from that of the direct electron injection.[34– 36] It is reasonable to assume that the modulation of the PL intensity in the presence of BME originates from the change of the redox states of BME under an applied bias. To investigate the mechanism of the modulation, we recorded simultaneously the PL intensity of the QDs and the cyclic voltammograms (CV) of BME (Fig. 3). The open circuit potential (OCP) Vo = 0.36 V was used as the start point of the CV scan. The electrode potential is cycled between − 1.30 V and + 1.30 V at a scan rate of 50 mV/s. It is interesting that the modulation of the PL intensity does not follow the applied potential linearly. It is also noteworthy that the electrochemical signal of the QDs adsorbed on the electrode surface is too weak to be detected (see Fig. A7). The CV is therefore independent of the QDs.
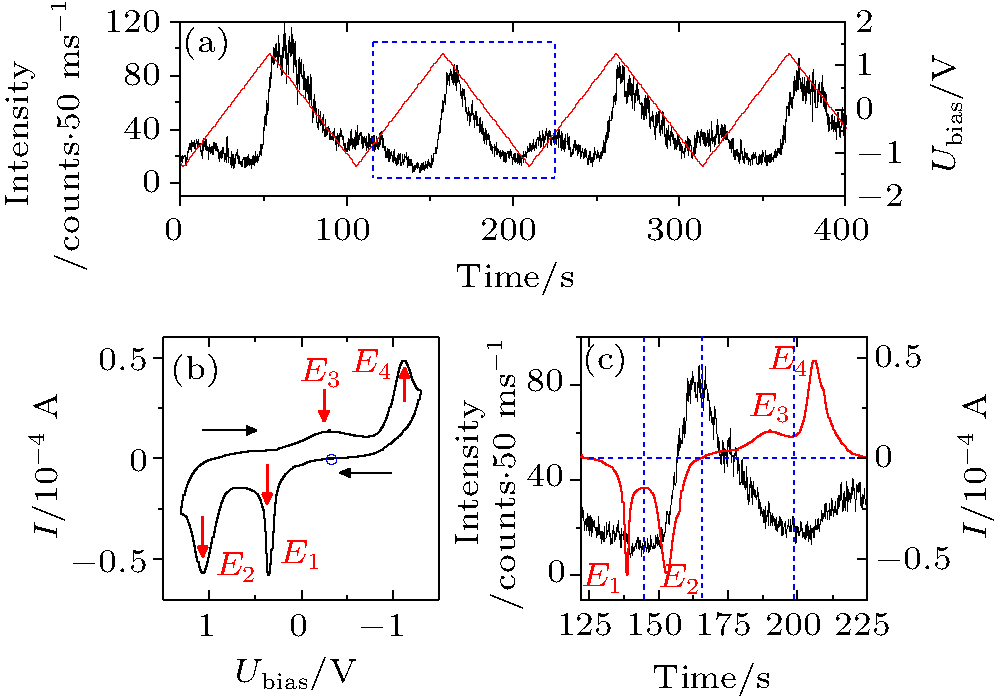 | Fig. 3. (a) PL intensity trajectory of a QD under a repeated cycling voltage. (b) The cyclic voltammogram for 100 mM BME at a sweep rate of 50 mV/s. Here, E1 and E2 represent the first and the second oxidation peaks, E3 and E4 represent the corresponding reduction peaks, respectively. The blue circle represents the start point of the CV measurement. (c) Overlapping of the CV signal with the PL signal in one period as is marked by the dashed rectangle in panel (a). |
The CV of BME in Fig. 3(b) exhibits two sharp oxidation peaks at E1 = 0.35 V and E2 = 1.07 V, and two wide reduction peaks at E3 = − 0.40 V and E4 = − 1.12 V, respectively. The comparison between the intensity-time trajectory and the current-time trajectory in one period is shown in Fig. 3(c). The PL intensity of the QDs decreases slightly as the electrode potential is scanned in the positive direction. It reaches a minimum beyond the end of the first oxidation peak E1 where BME is oxidized to a state we call OX1. Considering the complexity of the oxidation processes and the instability of the oxidation products, we were unable to identify the redox states of BME and hence noted them as OX1 and OX2 for simplicity. As the potential is further increased, the second oxidation peak E2 begins to emerge. The OX1 is now oxidized to OX2. The PL intensity increases sharply during the second oxidation process. The scan direction is reversed at 1.30 V. The potential is still sufficiently positive to oxide OX2 so that the anodic current continues. The PL intensity reaches a maximum when the anodic current becomes zero. Beyond that point, the PL intensity decreases while OX2 is reduced back to OX1 (peak E3). The PL intensity continues to drop till the beginning of the second reduction process in which the OX1 is reduced back to the original BME. The PL intensity increases again along with the appearance of the second reduction peak E4 and reaches a maximum as the cationic current becomes zero. The PL intensity returns to its initial values near the open circuit potential (OCP) at which the next voltammetric cycle begins.
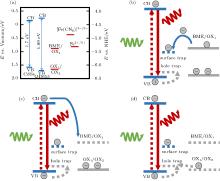
The results indicate that the OX1 reduces the PL intensity while the OX2 enhances the PL intensity of the QDs. We propose that the oxidation and the reduction result in the change of the energy levels of BME, and hence the change of the electron transfer pathways between the QDs and BME. Illustrated in Fig. 4 are the possible ET pathways between the QD and BME at the different oxidation states. The energy levels of the conduction band and the valence band of the CdSe QDS are adopted from the literature.[39– 41]
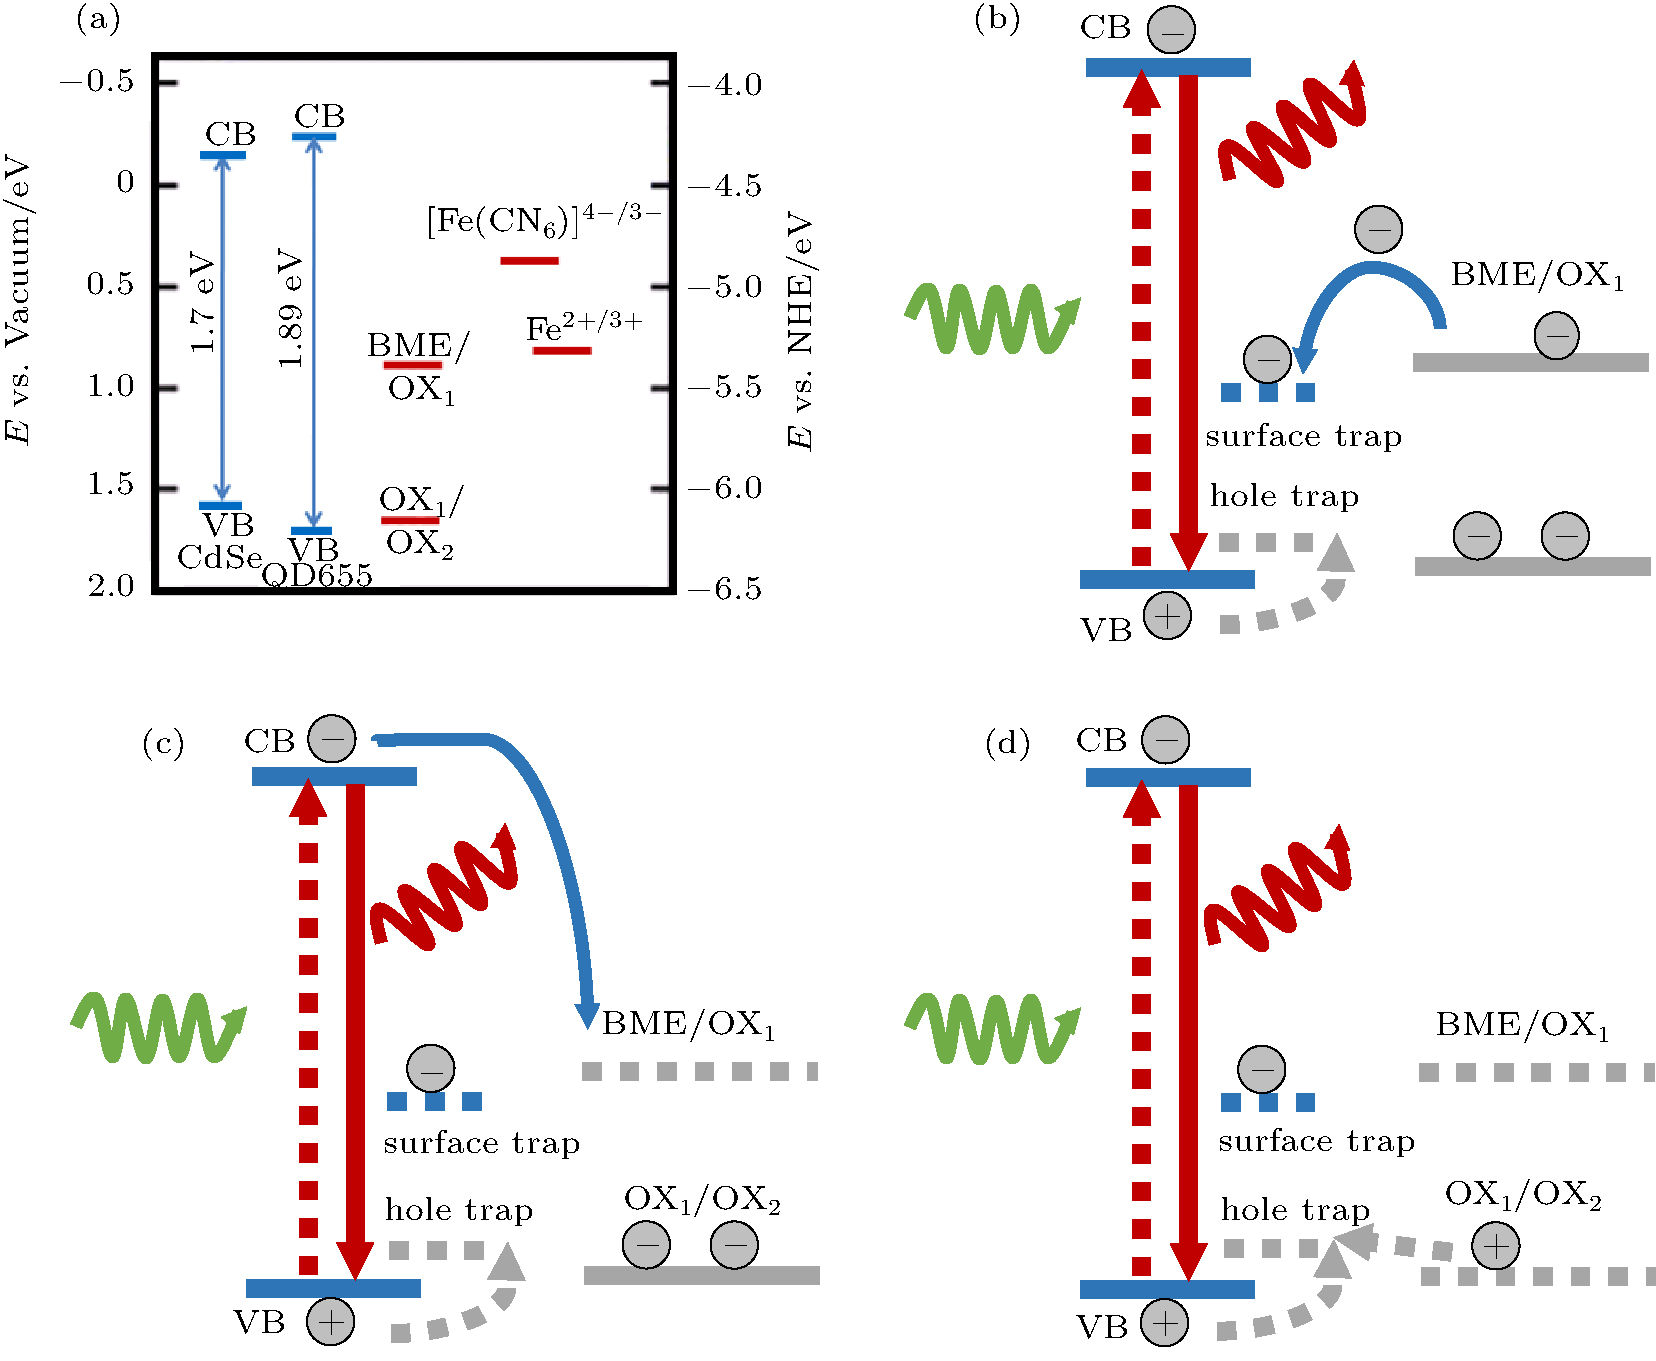 | Fig. 4. Positions of the energy levels of the conduction band (CB) and the valence band (VB) of the CdSe and QD655 (CdSe/ZnS), the redox peaks of BME in its original and two oxidized states, i.e., OX1 and OX2 along with that of the [Fe(CN)6]4− /3− compound which is often used as the standard in electrochemical studies. The redox peaks Fe2+ /3+ are also shown for reference. (b)– (d) Schematic illustration of possible ET pathways between a QD and BME in different oxidation states. The solid blue arrows show the possible electron transfer pathway. The dotted silver arrows show the possible hole transfer pathway. (b) The filling of surface trap states of the QD by the electrons from BME. (c) Electron transfer from the CB of the QD to the unoccupied electron level of OX1. (d) The ET process between OX2 and the hole traps. |
We first focus on the blinking behavior of the QDs which, according to Ref. [1], can be ascribed to the intercept of the excited ‘ hot’ electrons by the electron-accepting surface sites before they relax into the emitting core.[1] Since the highest occupied molecular orbital (HOMO) of BME lies above the Fermi energy of the QDs (Fig. 4(a)), BME can donate electrons to the surface trap states of the QDs (Fig. 4(b)). The electron transfer pathway from the core of the QD to the surface trap states is therefore effectively blocked because of the Coulomb blockade so that the blinking of the QD is nearly completely suppressed in the presence of BME.[37]
The reduction of the PL intensity near the first oxidation peak E1 can be interpreted by using the ET pathway in Fig. 4(c). When a BME molecule is oxidized to OX1 by applying a positive bias, an electron is lost so that the molecular orbital becomes the lowest unoccupied molecular orbital (LUMO) of OX1. The OX1 molecule is now ready to accept an electron from the CB of the QD. An electron excited to the CB now has two possible ET pathways, one is to the hole in the QD’ s valance band (VB) and the other is to the LUMO of OX1. The latter pathway lowers the PL intensity of the QDs. The PL intensity reaches a minimum as the accumulation of OX1 near the electrode surface reaches a maximum. We now turn to the PL enhancement near the second oxidation peak E2 where OX1 is oxidized to OX2. The empty LUMO of OX2 is only slightly higher than the VB of the QDs (Fig. 4(d)). It is hence at the similar energy levels of the hole traps which are usually located near the VB of the QD.[42, 43] The hole traps donate their electrons to the VB of the QD to reduce the quantum yield. But the empty LUMO of OX2 accept the electrons from the hole traps so that the holes in the VB are less annihilated, and therefore the PL intensity is enhanced.
We also observed that the degree of the PL reduction by OX1 at peak E1 is lower than that of the PL enhancement by OX2 at peak E2 (see Fig. 3(c)) although the concentration of OX1 at peak E1 must not be lower than that of OX2 at peak E2. According to the Marcus theory, [44] the difference can be attributed to the more favorable energy matching between the VB of the QDs and the LUMO of OX2 than that between the CB of the QDs and the LUMO of OX1.
The variation of the PL intensity in the reverse scan can be explained in a similar way. When OX2 begins to be reduced to OX1, the PL intensity of the QDs drops accordingly. When all the OX2 has been reduced to OX1 and the OX1 begins to be reduced to BME, the QD intensity rises again to nearly the original intensity in the natural state. The reversibility of the modulation of the PL intensity of the QDs is therefore determined by the reversibility of the redox reactions of the attached ligands. However, the oxidation-reduction reactions of BME is not completely reversible as can be seen from Fig. 3(b). The concentration of OX1 after the oxidation of BME is hence higher than the concentration of OX1 after the reduction of OX2. This might be the reason why the two minima in Fig. 3(a) are not equivalent.
Before we conclude the present work, we would like to point out that the following principle should be kept in mind when looking for a redox agent to manipulate the PL intensity of the QDs: the occupancy of the involved molecular orbital is as important as the position of its energy level. When BME is in contact with the QDs, it acts as an electron donor because its HOMO is near the surface trap states of the QDs (Fig. 4(a)). When BME is oxidized to OX1, the orbital becomes unoccupied so that OX1 can accept an electron from the CB of the QD. The same mechanism can be applied to interpret why the effects of Fe2+ and [Fe(CN)6]3− on the PL intensity of the QDs are different although their redox potentials are near each other and are both in the energy gap of the QDs (Fig. 4(a)). Our control experiments indicated that adding Fe2+ suppresses the blinking of the QDs efficiently (see Fig. A8(a)). In contrast, adding [Fe(CN)6]3− only enhances the blinking (see Fig. A8(b)). The difference is due to the fact that Fe2+ is an electron donor while [Fe(CN)6]3− is an electron acceptor. More importantly, our results also showed that the effect of a redox agent on the PL of the QDs might be unexpectedly changed if the occupancy of the molecular orbital of the redox agent is altered by a redox reaction. This observation is further confirmed by comparing the effect of BME with that of Fe2+ . In our experiments, the suppression of blinking by BME can last for hours, but the suppression by Fe2+ lasts for a few seconds only. The explanation for the difference lies in the fact that Fe2+ can be more easily oxidized than BME by the residual oxygen in the solution.
We showed that the PL intensity of the CdSe/ZnS core/shell QDs can be effectively and continuously modulated by electrochemically manipulating the electron transfer pathways between the QDs and the surrounding redox active 2-mercaptoethanol (BME). The underlying mechanism involves all the energy levels of the QDs: the conduction band, the valance band, the surface trap states, and the hole trap states. This, together with our control experiments using [Fe(CN)6]3− and Fe2+ and relevant data in the literature, reveals that the electron transfer between each of the energy levels and the molecular orbitals of the attached ligands can be effectively controlled by changing the occupancy of the molecular orbitals of the redox agents. Our single particle measurements helped understand easily the underlying mechanism and helped unveil the features hidden in ensemble measurements.
| 1 |
|
| 2 |
|
| 3 |
|
| 4 |
|
| 5 |
|
| 6 |
|
| 7 |
|
| 8 |
|
| 9 |
|
| 10 |
|
| 11 |
|
| 12 |
|
| 13 |
|
| 14 |
|
| 15 |
|
| 16 |
|
| 17 |
|
| 18 |
|
| 19 |
|
| 20 |
|
| 21 |
|
| 22 |
|
| 23 |
|
| 24 |
|
| 25 |
|
| 26 |
|
| 27 |
|
| 28 |
|
| 29 |
|
| 30 |
|
| 31 |
|
| 32 |
|
| 33 |
|
| 34 |
|
| 35 |
|
| 36 |
|
| 37 |
|
| 38 |
|
| 39 |
|
| 40 |
|
| 41 |
|
| 42 |
|
| 43 |
|
| 44 |
|