Redox-mediated reversible modulation of the photoluminescence of single quantum dots

Redox-mediated reversible modulation of the photoluminescence of single quantum dots |
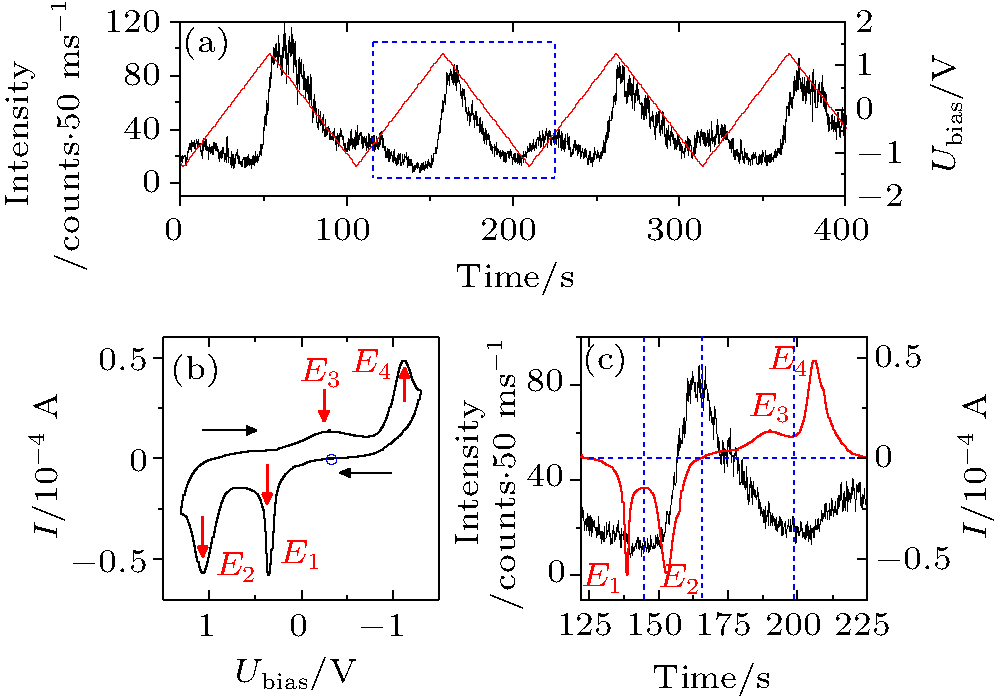
| (a) PL intensity trajectory of a QD under a repeated cycling voltage. (b) The cyclic voltammogram for 100 mM BME at a sweep rate of 50 mV/s. Here, E 1 and E 2 represent the first and the second oxidation peaks, E 3 and E 4 represent the corresponding reduction peaks, respectively. The blue circle represents the start point of the CV measurement. (c) Overlapping of the CV signal with the PL signal in one period as is marked by the dashed rectangle in panel (a). |
 |