

Doping inhomogeneity and staging of ultra-thin graphite intercalation compound flakes probed by visible and near-infrared Raman spectroscopy
[Lu Yan, Zhang Xin, Wu Jiang-Bin, Li Xiao-Li, Li Qiao-Qiao, Tan Ping-Heng† ]
]
]
|
|


†Corresponding author. E-mail: phtan@semi.ac.cn
*Project supported by the National Natural Science Foundation of China (Grant Nos. 11225421, 11474277, and 11434010).
When ultra-thin graphite intercalation compounds (GICs) are deposited on the SiO2/Si substrate, it is found that their colors are dependent on the thickness of GIC flakes. The sample colors of ultrathin GIC flakes can no longer provide qualitative information on the stage index. Here, multi-wavelength Raman spectroscopy is thus applied to study the doping inhomogeneity and staging of ultra-thin GICs by FeCl3 intercalation. The G band intensity of stage-1 GIC flakes is strongly enhanced by 532-nm laser excitation, while that of stage-2 and stage-3 flakes exhibits strong intensity enhancement for 785-nm laser excitation. The near-infrared lasers are suggested to probe the doping inhomogeneity and staging of ultra-thin GIC flakes.
Graphite intercalation compounds (GICs) are formed with atomic or molecular layers (intercalant) inserted between graphene layers.[1] GICs, as a class of quasi-two-dimensional materials, have been a target of intensive studies in chemistry, physics, materials science, and technological applications.[1– 5] GICs are commonly classified as acceptor or donor compounds, depending on whether graphene layers in the GIC acquire positive or negative charges from the intercalant. A very large variety of reagents can be intercalated into graphite. However, many of these compounds are unstable in air since donor compounds are easily oxidized and acceptor ones are easily desorbed.[1] As a relatively stable acceptor for GICs, ferric chloride (FeCl3) is widely used as an intercalant for graphite.[2, 3, 5] Recently, ultra-thin graphite flakes are serviced as the host material to form intercalation compounds, [5– 7] which makes GICs a hot issue to study the physical properties of heavily-doped graphene layers. A remarkable feature of GICs is the occurrence of staging, which is defined as the number (n) of graphene layers sandwiched between the two nearest intercalant layers, and the corresponding GICs are called stage-n GICs.[1, 8] Different stages in GICs can introduce a wide variation of the carrier concentration and thus modify the electrical, thermal and magnetic properties of the host material.[1] Because ultra-thin graphite flakes usually have a finite thickness and small size, the intercalant desorption and deintercalation could be significant in the intercalated flakes when they are exposed to air after their synthesis.[5] And thus, the final product of intercalated flakes may be a mixture of intercalation compounds with different stages more or less. The common technique used in bulk GICs, x-ray diffraction, is difficult to apply for ultra-thin GIC flakes because of their small size and thickness.
Raman spectroscopy has been proven to play a crucial role in carbon science and technology, including bulk GICs[1– 3] and ultra-thin GIC flakes.[5, 6, 9, 10] Raman spectra for GICs with stage n ≥ 3 characteristically exhibit a doublet structure. Its higher-frequency component (G+ ) is contributed from bounding graphene layers adjacent to the intercalant and the lower-frequency component (G− ) is from the interior graphene layers that have only nearest-neighbour graphene layers.[1] The peak positions of the G+ and G− , Pos(G+ ) and Pos(G− ), exhibit a distinctive dependence on the reciprocal staging index. The relative Raman intensity of G+ to G− , I(G+ )/I(G− ), is also correlated to the staging index.[1] Only one Lorentzian G peak appears in the Raman spectrum of stage-1 and stage-2 acceptor GICs[3] where no interior graphene layers exist. Based on the above conclusion, Raman scattering has been used to monitor intercalation and adsorption of lithium (Li), [4] nitrogen dioxide (NO2), [11] FeCl3, [5, 6] and sulfuric.[9, 10, 12]
In this paper, the doping inhomogeneity and staging of ultra-thin GICs formed from graphite flakes by FeCl3 intercalation is studied by visible and near-infrared Raman spectroscopy. I(G) of stage-1 GIC flakes is enhanced by 532-nm laser excitation, while that of stage-2 and stage-3 flakes exhibits strong intensity enhancement for 785-nm laser excitation. The near-infrared lasers are thus helpful to probe the doping inhomogeneity and staging of ultra-thin GIC flakes. By this technique, two GIC flakes exhibiting different colors on the SiO2/Si substrate are found to be pure stage-1 GIC flakes.
Graphite flakes are obtained by micromechanical cleavage of natural graphite[13] with Si wafer chips with 90-nm-thick SiO2. Intercalation is performed following the vapor transport method commonly used in GICs, [1, 5] intercalating FeCl3 into graphite flakes and forming GIC flakes. Raman measurements were performed in a back-scattering geometry at room temperature using a Jobin-Yvon HR800 Raman system equipped with a liquid nitrogen-cooled CCD. The excitation wavelengths (λ ex) are 785 nm from a Ti:Saphire laser, 633 nm from a He– Ne laser, 532 nm from a diode-pumped solid-state laser and 488 nm from an Ar+ laser. The Raman measurements were done using a 1200 lines/mm grating. The spot size was about 1 μ m2 focused using a × 100 objective lens (numerical aperture = 0.90). The output powers of lasers were below 0.8 mW in order to avoid sample heating[14] and deintercalation of GIC flakes.[5, 6] All Raman peaks are fitted with Lorentzian line shapes.
The color of a GIC flake is qualitatively used to characterize its staging.[1] Different colors in the same GIC flake mean that the GIC flake is not uniform in staging. By optimizing the experimental conditions, pure stage-1 GICs from bilayer (2LG), trilayer (3LG), and four-layer graphene (4LG) flakes can be synthesized, respectively.[5] Note that a longer reaction time is needed to reach stage-1 GICs for thicker graphite flakes, due to the sample size, both in spatial extent and in thickness.[5] Ifs the reaction time is not long enough or the reaction temperature is not appropriate, the synthesized GIC flakes are usually a mixture of GICs with different stages.
We prepared ultra-thin GIC flakes with a reaction condition different from the one for the pure stage-1 GICs. Indeed, we find that the colors of many GIC flakes are not uniform. As an example, figure 1(a) shows one optical image of a GIC flake, whose color changes gradually from olive at the bottom to salmon at the top. To characterize the staging of this GIC flake, Raman spectra at SA, SB, and SC spots are measured by λ ex of 488 nm, as shown in Fig. 1(b). At SA, a single lorentzian G peak located at 1627 cm-1 indicates that the pure stage-1 GIC is formed.[5] The 2D line shape at SA after FeCl3 intercalation changes significantly into a single lorentzian peak with a small shoulder at the low-frequency side as shown by the fitting in Fig. 1(b), indicating a decoupling of the graphene layers in stage-1 GIC due to the intercalation of FeCl3. The 2D peak decrease in frequency[15] and I(2D)/I(G) increases[5, 15] with decreasing the doping level in monolayer graphene, while the 2D peaks of doped few layer graphenes are higher in frequency than that of doped monolayer graphene.[16] Therefore, we interpret that the shoulder at the low-frequency side of the 2D peak in SA comes from the small amount of stage-1 GIC with a lower doping level. The I(2D)/I(G) (∼ 0.12) is close to the previously-reported pure stage-1 GIC flakes excited by 488 nm.[5] We denote the G peak related to pure stage-1 GIC flakes as the G1 peak.
 | Fig. 1. The optical image of an inhomogeneous sample has different colors, marked with SA, SB, and SC as shown in panel (a). Their Raman spectra excited by the 488-nm laser are shown in panel (b). The gray dashed curves are Lorentzian peaks that are used to fit the experimental curves. |
The flake at SB consists of two phases of GICs. Besides the G1 peak at 1626 cm− 1, there is an additional strong G peak at 1616 cm− 1 with a FWHM of 6.5 cm− 1. This peak is slightly higher than the G peak of the reported pure stage-2 GIC in frequency.[1] For a partially-intercalated stage-1 GICs from 2LG with Pos(G) of ∼ 1616 cm− 1, its Pos(2D) is identical to that of fully-intercalated stage-1 GICs from 3LG and 4LG with Pos(G) of ∼ 1626 cm− 1, as indicated in Fig. 2 of Ref. [5] If both G peaks at SB correspond to stage-1 GIC flakes, the peak position and spectral profile of the 2D peak should be identical to that at SA. However, the 2D peak at SB exhibits an asymmetrical spectral profile and its Pos(2D) is higher than that at SA. Indeed, the 2D peak of doped 2LG is higher in peak position than that of doped monolayer graphene.[16] Therefore, we correlate the G peak at 1616 cm− 1 with fully-intercalated stage-2 GIC flakes and denote it as the G2 peak.
At SC, beside the G1 and G2 peaks, there are another two G peaks located at 1611 cm− 1 and 1590 cm− 1. The peak positions of the two peaks are close to those of stage-3 GIC.[3] For stage-3 GIC, most of the charge transfer between graphene layers and FeCl3 resides in the two graphene layers adjacent to the intercalant and the doping level of the interior graphene layer is much lower than the bounding graphene layers. This results in two G peaks for stage-3 GIC.[1, 8] In fact, the charge transfer in a stage-n GIC is very similar to the case of a heavily-doped n-layer graphene (nLG) by physical adsorption of H2SO4 on its top layer and bottom layer.[12] Indeed, the two G peaks at 1611 and 1590 cm− 1 are 3 and 2 cm− 1 higher in frequency than the corresponding peaks of H2SO4-doped 3LG (Fig. 3(a) of Ref. [12], respectively. Therefore, we denote the two G peaks at 1611 and 1590 cm− 1 as G3+ and G3− , respectively. Based on the above discussion, stage-2 GIC is almost absent at SA, and stage-3 GIC is almost absent at SB. However, stages 1– 3 GICs are present in SC. It is in coincidence with the intercalation dynamics of GICs because the intercalant is intercalated into ultra-thin flakes from its boundary.
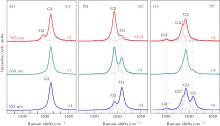
The I(2D) and I(G) of doped graphenes and stage-1 GICs is sensitive to the laser excitation energy and its Fermi level.[5] Similar behavior is expected for stage-2 and stage-3 GICs. For a GIC mixed with different stages, the analysis on its 2D mode become difficult because of the broad profiles of the 2D peak and less sensitivity of Pos(2D) on doping than the G peak. In the following, we will focus on the G peak of GICs. Figure 2 depicts the G bands of GIC flakes at SA, SB, and SC by λ ex of 532 nm, 633 nm, and 785 nm. All the Raman spectra by specific excitation wavelength are normalized by I(G1) at SA. As shown in Fig. 2(a), only the G1 peak is present at SA by 532 nm and 633 nm. It seems that only stage-1 GICs are present at SA. However, for λ ex of 785 nm, there exists a weak G2 shoulder at the low-frequency side of G1. This indicates that some stage-2 GICs actually exist in SA. At SB with a mixture of stage-1 and stage-2 GICs, the intensity ratio I(G1)/I(G2) increases from 488 nm to 532 nm excitations and then decreases dramatically from 532 nm to 785 nm excitations. Although the G1 peak dominates the spectrum excited by the 532-nm excitation, it becomes very weak in the Raman spectrum excited by the 785-nm excitation. Raman spectra at SC exhibit a similar excitation-wavelength-dependent behavior and I(G3+ ) are strongly enhanced when the 785-nm excitation is used.
 | Fig. 2. Multi-wavelength Raman spectra at SA (a), SB (b), and SC (c). For a specific λ ex, all the Raman spectra are normalized by I(G1) at SA. Gray-dashed lines show the fits to the G band by Lorentzian peaks. |
The charge transfer between intercalant and graphene layers will significantly shift the Fermi level (EF) of graphene layers in GICs. The lower the staging number, the higher the EF value. I(G) enhancement at some specific excitation wavelengths results from the quantum interference between Raman pathways.[17] Experiment data confirmed that the intensity of the G band could be dramatically enhanced with doping at some specific excitation wavelengths due to blocking the destructive interference Raman pathways.[9, 18, 19] Higher EF results in higher excitation energy to enhance the G peak. Therefore, it is reasonable that I(G1) is enhanced by the 532-nm excitation, while I(G2) and I(G3+ ) are enhanced by the 785-nm excitation. The different behaviors of intensity enhancement between G1 and G2 result in that the intensity ratio of I(G1)/I(G2) is significantly dependent on the excitation wavelength. For example, I(G1)/I(G2) can vary from 1.36 (λ ex = 488 nm) to 0.11 (λ ex = 785 nm). This suggests that even though the concentration of stage-2 or stage-3 GIC is very small in the mixture GIC samples, one can probe it by the near-infrared laser excitation. The near-infrared lasers are suggested to probe the doping inhomogeneity of ultra-thin stage-1 GIC flakes.
The optical images of stage-1 FeCl3-intercalated GIC flakes are often blue as reported previously.[1] However, the case may be different when GIC flakes are deposited on a SiO2/Si substrate. Figures 3(a) and 3(b) show the optical images of FeCl3-intercalated GIC flakes, showing a uniform color in micron dimension. The color of the GIC flake in Fig. 3(a) is pink while that in Fig. 3(b) is light green, which suggests that their staging may be different. However, for λ ex of 532 nm, the G peaks of both the two GIC flakes exhibit as a single peak at ∼ 1626 cm− 1 with a FWHM of 6 cm− 1, similar to those of stage-1 GIC flakes intercalated by FeCl3.[5] Their 2D peaks are very weak because of high EF for stage-1 GICs.[5] When one uses λ ex = 785 nm as an excitation, there still exists only one G peak identical to that excited by λ ex = 532 nm and the 2D peaks are completely disappeared due to the intensity suppression by Pauli blocking for laser energy below 2EF. No observation of any G2 and G3 peaks in the two GIC flakes indicates that they are really pure stage-1 GICs although their sample colors are quite different. The thickness of GIC flakes in Figs. 3(a) and 3(b) is 120 nm and 160 nm, as indicated by their atomic force microscopy (AFM) images depicted in Figs. 3(c) and 3(d), respectively. The different colors between the two GIC flakes can be attributed to the interference of multiple reflected lights from the multilayer structures of stage-1 GIC, SiO2 layer, and Si substrate. The different thickness of GIC flakes can result in different interferences, which will lead to enhancement or cancelation of reflected lights from stage-1 GIC surface at different wavelengths of the reflected light, [20] and finally modify the color of stage-1 GICs on SiO2/Si substrate in the optical image. Therefore, the sample color of ultrathin GIC flakes cannot provide qualitative information on the stage index any more. Multi-wavelength Raman spectroscopy could be applied to study the staging and its homogeneity of ultra-thin GICs with different thicknesses.
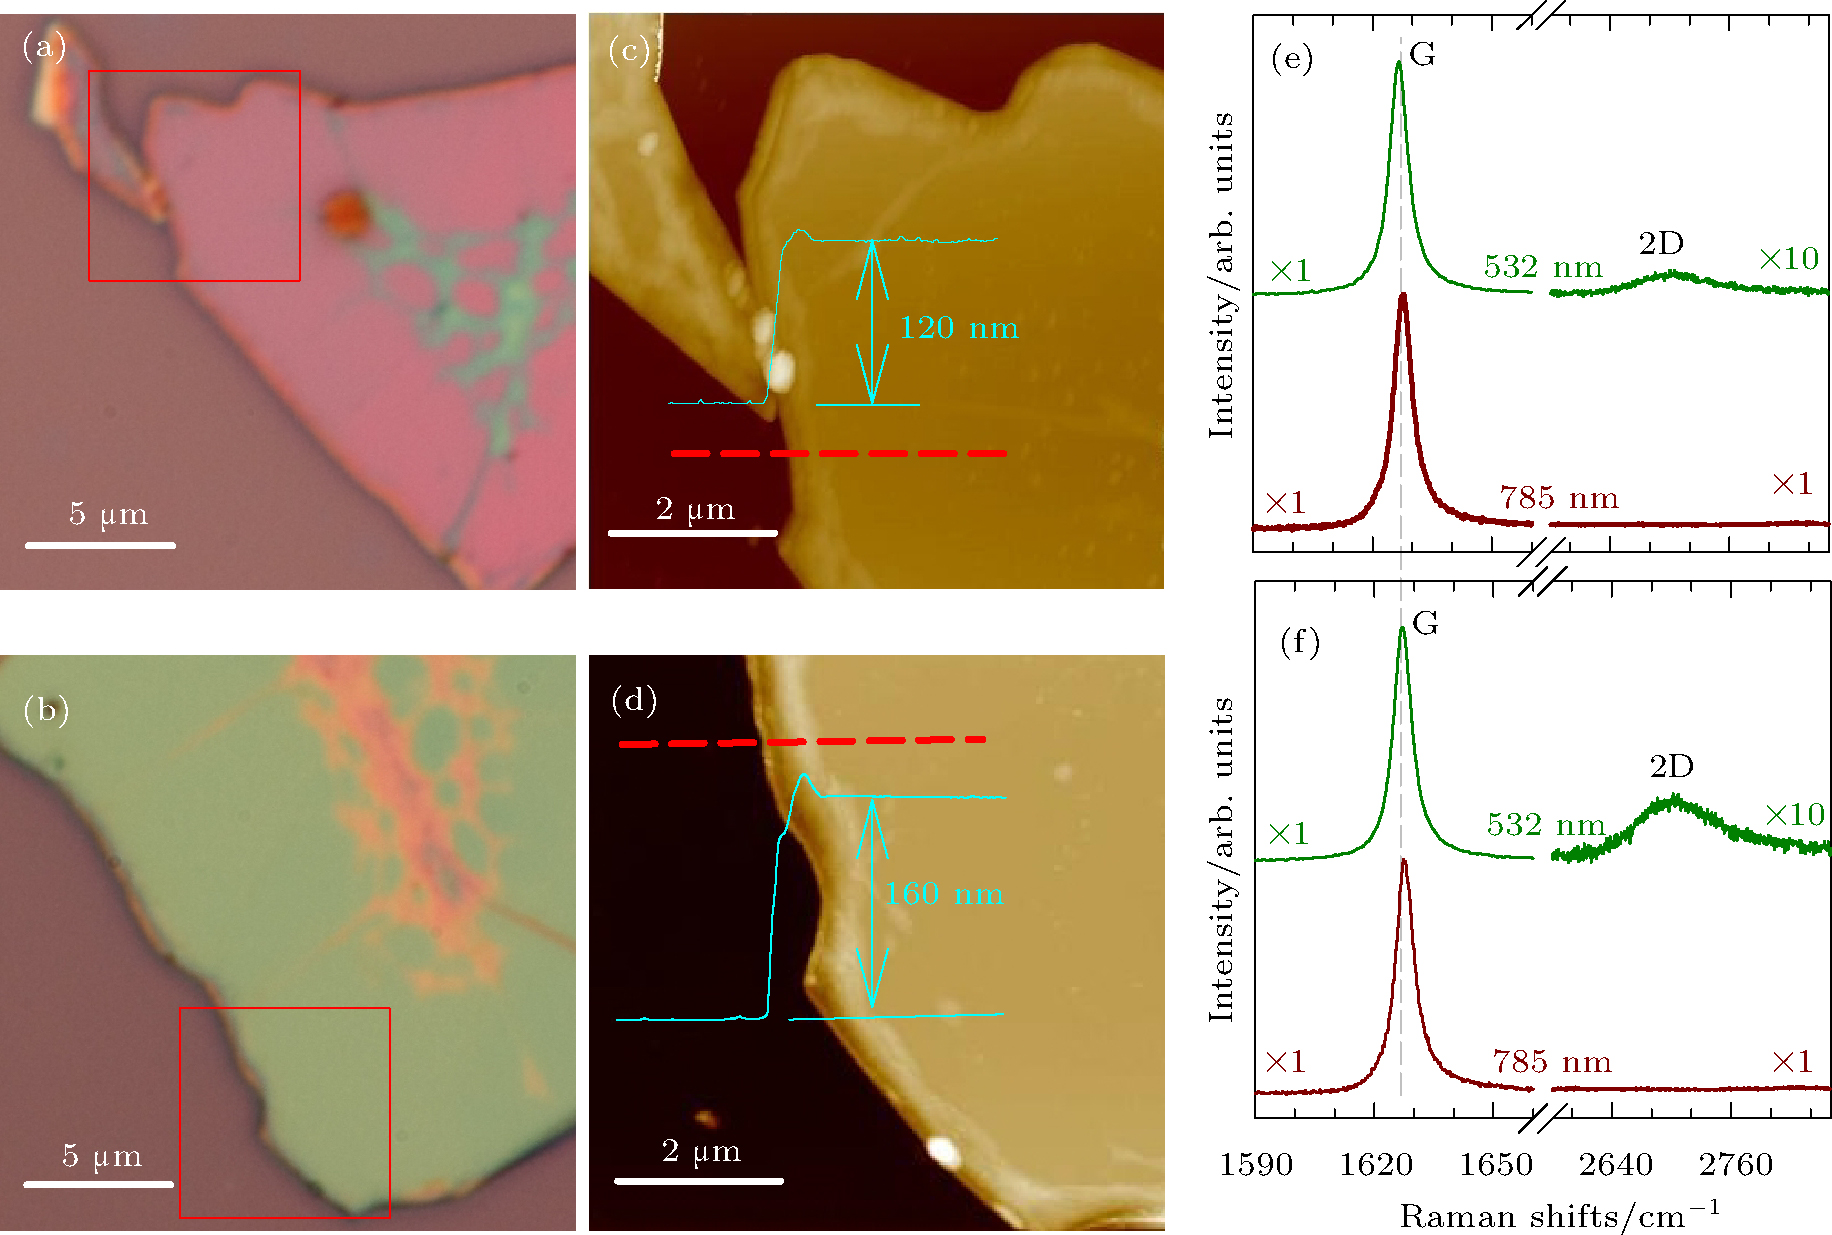 | Fig. 3. Optical images of two stage-1 GIC flakes [(a) and (b)], and the corresponding AFM topology [(c) and (d)], respectively, for selected squares in panels (a) and (b). The corresponding Raman spectra at the G and 2D spectral ranges excited by 532-nm and 785-nm excitations are shown in panels (e) and (f). |
In this study, we used visible and near-infrared Raman spectroscopy to investigate the doping inhomogeneity and staging of ultra-thin GICs formed from graphite flakes by FeCl3 intercalation. We show that the G band intensity of stage-1 GIC flakes can be strongly enhanced by the excitation energy of 2.33 eV (532 nm), while stage-2 and stage-3 GIC flakes exhibit stronger intensity when they are excited by 1.58 eV (785 nm). It is found that the pure stage-1 GIC flakes can exhibit different colors in the optical images due to the finite thickness of the GIC flakes on SiO2/Si substrate, which is confirmed by multi-wavelength Raman spectroscopy.
| 1 |
|
| 2 |
|
| 3 |
|
| 4 |
|
| 5 |
|
| 6 |
|
| 7 |
|
| 8 |
|
| 9 |
|
| 10 |
|
| 11 |
|
| 12 |
|
| 13 |
|
| 14 |
|
| 15 |
|
| 16 |
|
| 17 |
|
| 18 |
|
| 19 |
|
| 20 |
|