Doping inhomogeneity and staging of ultra-thin graphite intercalation compound flakes probed by visible and near-infrared Raman spectroscopy

Doping inhomogeneity and staging of ultra-thin graphite intercalation compound flakes probed by visible and near-infrared Raman spectroscopy |
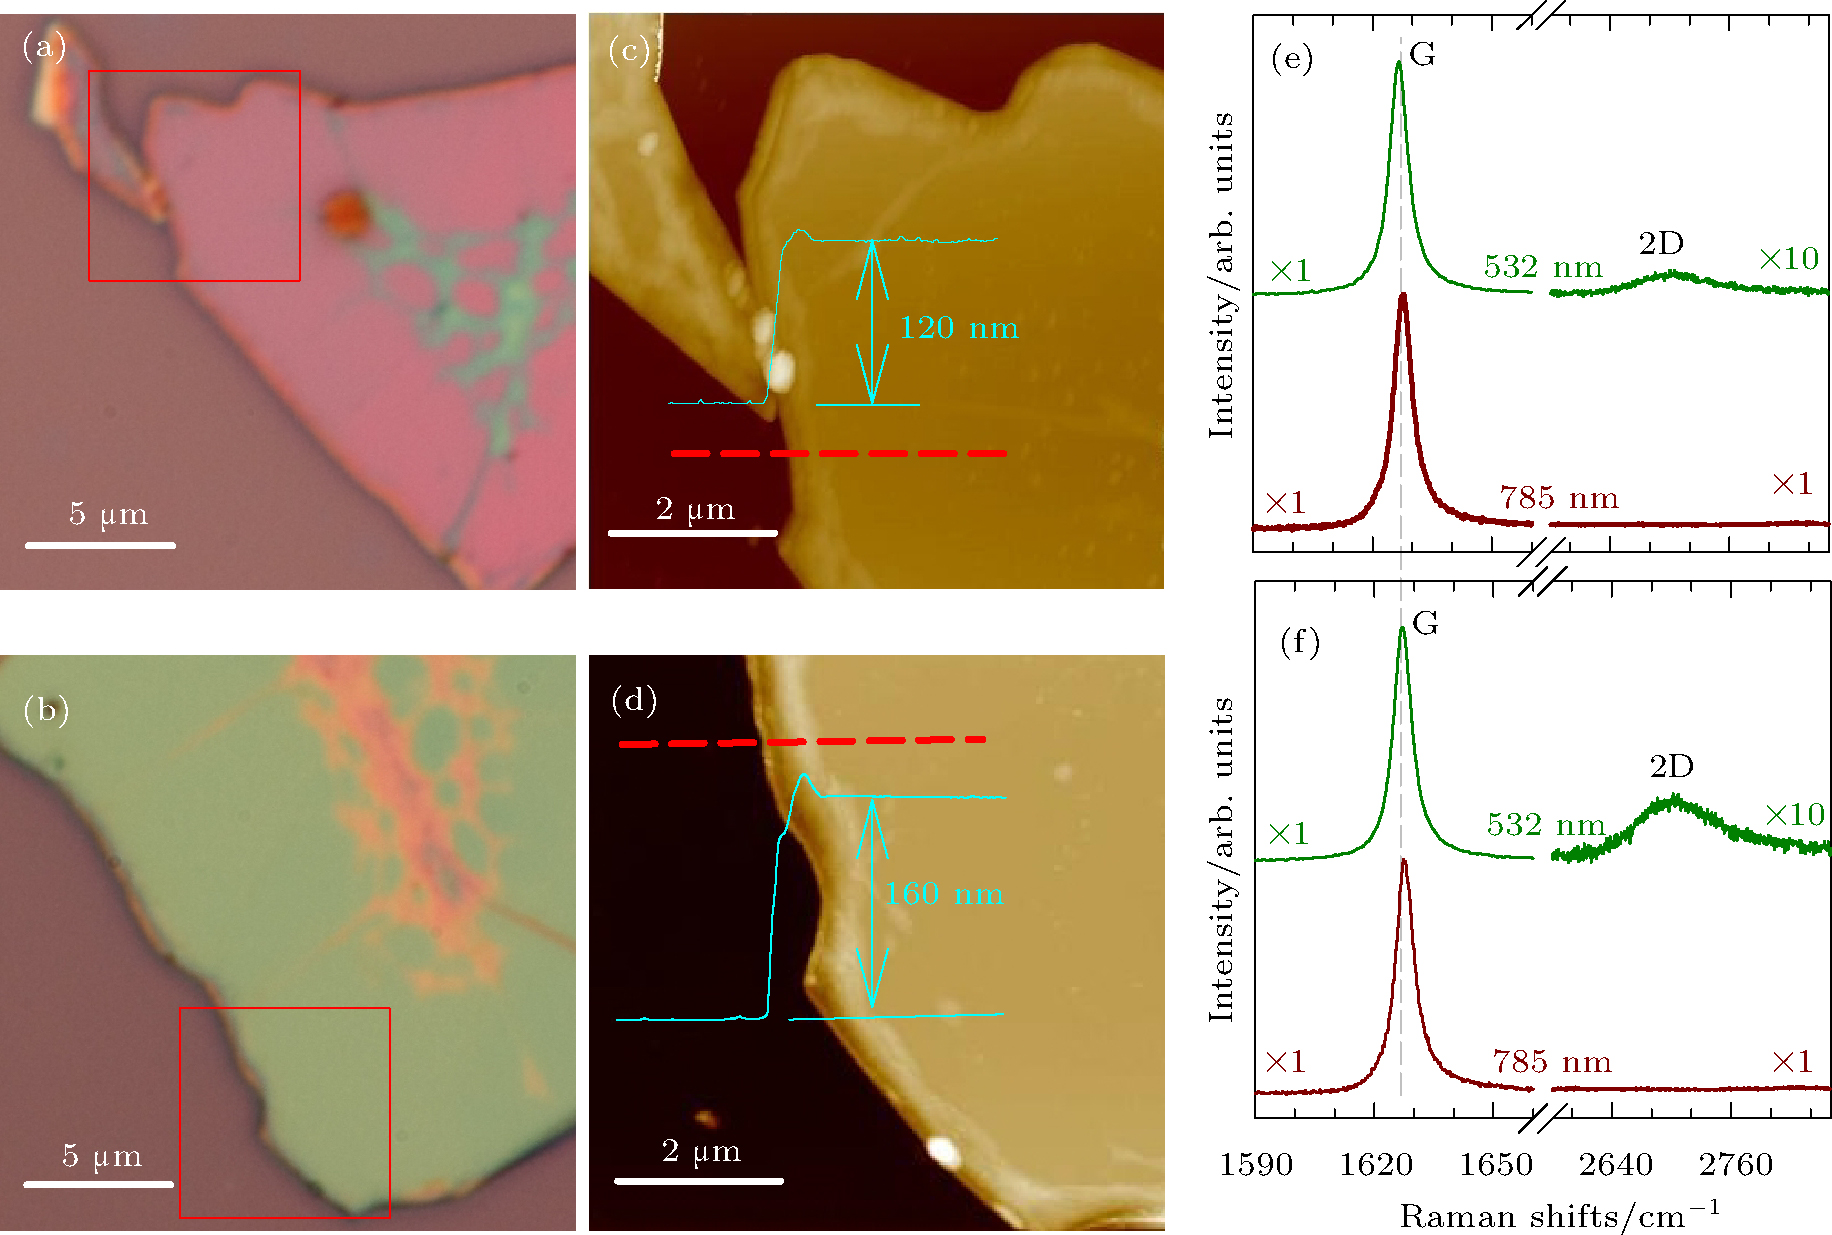
| Optical images of two stage-1 GIC flakes [(a) and (b)], and the corresponding AFM topology [(c) and (d)], respectively, for selected squares in panels (a) and (b). The corresponding Raman spectra at the G and 2D spectral ranges excited by 532-nm and 785-nm excitations are shown in panels (e) and (f). |
 |