†Corresponding author. E-mail: qinmh@scnu.edu.cn
‡Corresponding author. E-mail: liujm@nju.edu.cn
*Project supported by the National Natural Science Foundation of China (Grant Nos. 11204091, 11274094, and 51332007) and the National Basic Research Program of China (Grant Nos. 2015CB921202 and 2011CB922101).
The ferroelectric polarization and phase diagram in Tm-doped GdMnO3 are studied by means of Monte Carlo simulation based on the Mochizuki–Furukawa model. Our work well reproduces the low temperature polarization at various substitution levels observed experimentally. It is demonstrated that the Tm-doping can control the multiferroic behaviors through modulating the spin structures, resulting in the flop of the electric polarization. In addition, the polarization in the ab-plane cycloidal spin phase arises from comparable contributions of the symmetric exchange striction and antisymmetric exchange striction, leading to much bigger polarization than that in the bc-plane cycloidal spin phase where only the contribution of the latter striction is available. The phase diagram obtained in our simulation is helpful for clarifying the multiferroic properties in doped manganite systems and other related multiferroics.
Multiferroics have attracted a great deal of attention over the past decades due to the potential applications and basic physical research interest.[1– 3] Especially, the orthorhombic perovskite rare-earth manganites RMnO3 (R = Tb, Dy, Eu1 − xYx, etc., with the crystal structure on the ab-plane shown in Fig. 1(a)) have been extensively addressed since the discovery of the strong magnetoelectric (ME) coupling in TbMnO3.[4– 6] The ferroelectric (FE) polarization (P) in RMnO3 is generated by frustrated spin orders such as the cycloidal spin (CS) order and the E-type antiferromagnetic (E-AFM) order. It is believed that adjacent two spins Si and Si + 1 separated by vector ri, i + 1 can generate a local polarization 
Interestingly, the low-temperature (T) multiferroic phase in RMnO3 is mainly determined by the magnitude of the GdFeO3-type distortion which depends on the size of the R ion.[15] With decreasing R-site ionic radius, four magnetic phases successively emerge at low T: the non-FE A-type antiferromagnetic (A-AFM) order, the FE ab-CS phase, the FE bc-CS phase, and the FE E-type AFM order.[16] Thus, the substitution at the R-site with proper species becomes an efficient way to modulate the multiferroic properties in RMnO3. Beyond TbMnO3 and DyMnO3, more multiferroic manganites of the CS order can be synthesized by this method such as Eu1 − xYxMnO3 and Gd1 − xTbxMnO3.[6, 17] Recently, a microscopic spin model (M– F model) which includes the superexchange interaction, the single-ion anisotropy (SIA), the Dzyaloshinskii– Moriya (DM) interaction, and the spin– phonon coupling, was proposed and well reproduced measured polarization and phase diagrams of RMnO3.[18, 19] In particular, for the ab-CS phase, it was predicted that both the symmetric (S · S)-type exchange striction and antisymmetric (S× S)-type exchange striction contribute to the polarization along the a-axis, leading to a much larger total polarization P= PAS+ PS in the ab-CS phase than that in the bc-CS phase, where P along the c-axis is purely resulted from the antisymmetric striction, i.e., P= PAS.[16] Several other experimental phenomena have been qualitatively explained based on the same or similar models.[20– 24]
On the other hand, a quantitative calculation of the polarizations arising from the symmetric striction and antisymmetric striction respectively is essential to the complete understanding of the multiferroic properties in RMnO3. Nevertheless, in spite of the success of the M– F model in explaining observed experiments in terms of magnetic structures and ferroelectricity, a quantitatively consistent calculation of the FE polarization has been less available.[23] In addition, related experimental data have been rare either although Sm1 − xYxMnO3 was investigated in terms of P as a function of x, [25] since a reliable evaluation of PAS and PS from the measured total polarization P is a tough issue, making a quantitative and even qualitative comparison between experiments and the M– F model calculation challenging. In a recent experiment, we reported the evaluated data on PAS and PS associated with the ab-CS phase in Gd1 − xTbxMnO3 where the GdMnO3 is located at the boundary between the A-AFM phase and ab-CS phase, and a slight substitution of Gd3 + by much smaller Tm3 + allows a gradual evolution of the magnetic phase from the A-AFM phase into the ab-CS phase before eventually evolving into the bc-CS phase where no component PS is available.[26] This allows us a specific platform at which the M– F model can be employed to calculate the PAS and PS in the quantitative sense. This study may provide clues to enlarge polarization and enhance the ME coupling in similar multiferroics, which is thus of particular significance.
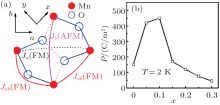
Figure 1(b) shows the measured P at T= 2 K as a function of x in Gd1 − xTbxMnO3, noting here that we multiply the polarization data by 15 since our samples are polycrystalline. It was repeatedly confirmed that the P measured from single crystal samples is roughly 10– 15 times that from the polycrystalline samples, while a quantitative consistency between experiment and theory on the same order of magnitude is already satisfactory. In this work, we start from the M– F model with the Mn spin S= 2 on a cuboidal lattice and perform quantitative calculations on the polarizations of Gd1 − xTbxMnO3 and then compare them with measured results. The experimental results can be well reproduced, and the phase diagram at low T obtained by means of Monte Carlo simulation is discussed in detail.
The remainder of this paper is organized as follows: In Section 2 the model and the simulation method will be described. Section 3 is attributed to the simulation results and discussion. Finally, the conclusion is presented in Section 4.
The Hamiltonian can be written as H= Hex+ Hsia+ HDM+ HK. The first term Hex= ∑ 〈 i, j〉 Jij(Si · Sj) denotes the spin exchange interactions, where Ja= − 0.1 and Jb are the coupling constants in the Mn– Mn bonds on the ab plane, the Peierls-type spin– phonon coupling Jij= Jab+ J'abδ i, j with Jab= − 0.8 and J'ab= 2.5 is considered for the Mn– O– Mn bonds along the x axis and the y axis (Fig. 1(a)), [23] δ i, j denotes a further shift of the O ion between the i-th and j-th Mn ions normalized by the Mn– O bond length, and Jc= 1.2 is the strong AFM exchange in the Mn– Mn bonds along the c-axis. Here the energy unit is meV. The second term is the single-ion anisotropy, which consists of two parts as 

The values of Ja, Jab, Jc, J'ab, D, E, K, and five DM parameters for several RMnO3 systems have been microscopically determined or estimated in earlier work.[19] In addition, it is noted that the exchange path for Jb contains two O 2p orbitals, whose hybridization can be enhanced by the orthorhombic distortion. Thus, Jb can be treated as a variable which increases as the R-site ionic radius decreases. Our simulation is performed on a 36× 36× 6 cuboidal lattice with periodic boundary conditions using the standard Metropolis algorithm and temperature exchange method.[28, 29] The specific heat C(T)= (〈 H2〉 − 〈 H〉 2)/NkBT2 and spin-helicity vector hγ (T)= 〈 | ∑ iSi× Si + b| 〉 /NS2 (γ = a, b, c) are calculated to determine the transition points and the spin structures, here N is the number of Mn ions, kB is the Boltzmann constant, and the brackets denote thermal and configuration averaging. It is expected that hc (ha) has a large value in the ab-CS (bc-CS) order, while the other two components of h are strongly suppressed. On the other hand, all these three components of h should be nearly equal to zero in the paramagnetic (PM), A-AFM and sinusoidal collinear antiferromagnetic (sc-AFM) phases. In addition, based on the point charge model, the electric polarization 

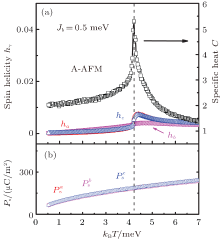
The simulated specific heat C(T), spin helicity hγ (T), and polarization PS(T) due to the symmetric (S · S)-type exchange striction for a small value of Jb= 0.5 meV are presented in Fig. 2. A single phase transition can be observed in the C(T) curve, which corresponds to the transition from the PM phase into the A-AFM phase. The spin helicity vector h is nearly equal to zero constantly through this transition, and the electric polarization PS in the A-AFM phase is extrapolated to zero at T → 0 (Fig. 2(b)). In fact, it was experimentally noted that GdMnO3 is of the A-AFM state at low T but close to the boundary between the A-AFM order and the CS order.[30, 31] Hence, the electric polarization at x= 0 observed in an earlier experiment may be due to the inhomogeneity caused by the inevitable chemical disorder and defects in realistic materials.[32]
 | Fig. 2. (a) Specific heat C(T), spin-helicity vector hγ (T) (γ = a, b, c), and (b) polarizations due to the symmetric (S · S)-type exchange striction PS(T) as a function of T for Jb= 0.5 meV. |
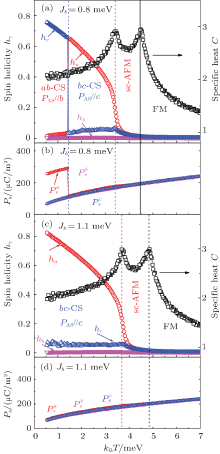
The Jb is increased with increasing x. In Figs. 3(a) and 3(b), we show the calculated results for a larger value of Jb= 0.8 meV. Three successive phase transitions occur with decreasing T. The first one is the transition from the PM state to the sc-AFM state. The second one is the transition into the bc-CS order in which PAS is induced along the c-axis. When T further falls down to the third transition point, hc steeply increases, accompanied with the sudden drop of ha, clearly indicating the occurrence of the transition from the bc-CS order to the ab-CS order. In addition, PaS equals to ∼ 250 μ C/m2 at low T in the ab-CS phase (Fig. 3(b)), indicating a finite contribution of the symmetric (S · S)-type exchange striction to the ferroelectric polarization. The (S · S) contribution may be understood from the energy landscape. The ab-CS order is stabilized by the SIA and the DM interaction with vectors on the in-plane Mn– O– Mn bonds. In the absence of the DM interaction and the spin– phonon coupling, the spins rotate with the same rotation angles of ϕ ab satisfying relation cosϕ ab= Jab/(2Jb). When the DM interaction is introduced, these angles are alternately modulated into ϕ ab+ Δ ϕ ab and ϕ ab − Δ ϕ ab with Δ ϕ ab> 0 in order to get an energy gain. At the same time, the O ions between two spins with a smaller angle of ϕ ab − Δ ϕ ab (a larger angle of ϕ ab+ Δ ϕ ab) shift negatively (positively) to strengthen (weaken) the ferromagnetic exchange due to the spin– phonon coupling, leading to the generation of the macroscopic ferroelectric polarization. On the other hand, the induced polarizations between neighboring ab planes can be perfectly cancelled in the bc-CS order. As a result, there is no contribution to the ferroelectric polarization from the (S · S)-type exchange striction in the bc-CS order.
 | Fig. 3. C(T), hγ (T) (γ = a, b, c) as a function of T for (a) Jb= 0.8 meV and (c) Jb= 1.1 meV, and PS(T) as a function of T for (b) Jb= 0.8 meV and (d) Jb= 1.1 meV. |
The third transition point shifts toward the low-T side and eventually disappears as Jb further increases, indicating the flops of the spiral-plane from the ab-plane to the bc plane. C(T) shows two peaks and hc is small over the whole T-range for Jb= 1.1 meV (Fig. 3(c)), indicating that the ab-CS order is completely suppressed and the bc-CS order occupies the whole T-range below the second transition point. Similarly, three components of PS in the bc-CS phase are respectively extrapolated to zero at T → 0, as clearly shown in Fig. 3(d). The ferroelectric polarization along the c-axis uniquely originated from the contribution of the antisymmetric (S× S)-type exchange striction, as reported earlier.
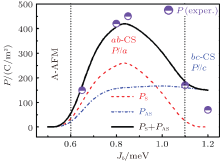
In order to have a quantitative comparison between our calculated polarization and the experimental results, we also calculate the (S× S) contribution at T → 0. Based on the spin-current theory, PAS is proportional to the spin helicity h. In this work, the proportionality factor is estimated to be 200 μ C/m2 due to the fact that the observed PAS in the bc-CS order is ∼ 200 μ C/m2 for Tb-doped GdMnO3.[17] In Fig. 4, the calculated Jb dependence of PS, PAS, and PS+ PAS at T → 0 are respectively presented. The simulated PS+ PAS reproduces well the experimental polarization which is also given for a clear comparison. As a result, our quantitative calculation shows good consistency with experiment results, and one may give a firm interpretation about the multiferroicity in Gd1 − xTbxMnO3. For small x, the ab-CS order is stabilized at low T, and remarkable polarization arises from the contributions of both the symmetric (S · S)-type exchange striction and the antisymmetric (S× S)-type exchange striction can be observed. With further Tm-substitution, the ab-CS order is replaced by the bc-CS order in which only the antisymmetric exchange striction contributes to the polarization, leading to the significant reduction of the polarization.
It is noted that the measured polarization is gradually reduced with further substitution in the experiment. This phenomenon is not reproduced in our simulation in which the polarization remains almost the same in the whole region with the bc-CS order. In fact, a similar result has been reported in an earlier simulation.[19] The inconsistency between the theory and experiment may be due to the fact that the inevitable inhomogeneity in realistic materials is completely ignored in simulations. However, our work uncovers the multiferroic phases in Gd1 − xTbxMnO3, and confirms the important role of the spin– phonon coupling in the modulation of polarization in similar multiferroic materials.
In conclusion, we have systematically investigated the multiferroic properties in the Tm-substituted GdMnO3 with Monte Carlo simulation of the M– F model. The experimental polarization can be well reproduced, and the phase diagram at low temperature is microscopically determined. The relatively large polarization at the low substitution level is proved to be caused by the contributions of both the symmetric (S · S)-type exchange striction and the antisymmetric (S× S)-type exchange striction in the ab-CS phase. With further substitution, a phase transition from the ab-CS order to the bc-CS order occurs, and the polarization is significantly reduced due to the fact that only the (S× S)-type exchange striction contributes to the polarization in the bc-CS order. This work is helpful for clarifying the multiferroic behaviors observed in doped manganite systems and other related multiferroic materials.
| 1 |
|
| 2 |
|
| 3 |
|
| 4 |
|
| 5 |
|
| 6 |
|
| 7 |
|
| 8 |
|
| 9 |
|
| 10 |
|
| 11 |
|
| 12 |
|
| 13 |
|
| 14 |
|
| 15 |
|
| 16 |
|
| 17 |
|
| 18 |
|
| 19 |
|
| 20 |
|
| 21 |
|
| 22 |
|
| 23 |
|
| 24 |
|
| 25 |
|
| 26 |
|
| 27 |
|
| 28 |
|
| 29 |
|
| 30 |
|
| 31 |
|
| 32 |
|


