


Femtosecond filamentation induced fluorescence technique for atmospheric sensing*
Cite this Article
Yuan Shuai, Chin See Leang, Zeng He-Ping. Femtosecond filamentation induced fluorescence technique for atmospheric sensing* . Chinese Physics B, 2015, 24(1): 014208 
Permissions
Femtosecond filamentation induced fluorescence technique for atmospheric sensing*
Corresponding author. E-mail: hpzeng@phy.ecnu.edu.cn
Project supported by the National Basic Research Program of China (Grant No. 2011CB808105), the International Science and Technology Collaboration Program, China (Grant Nos. 2010DFA04410 and 11530700900), the National Key Scientific Instrument Project (Grant No. 2012YQ150092), and the Canada Research Chair, Natural Sciences and Engineering Research Council of Canada, Canada Foundation for Innovation, Canadian Institute for Photonics Innovation and le FQRNT.
Abstract
Recent progress in filament-induced atmospheric sensing is reviewed. Self-guided propagation of ultrashort laser pulses in air induces laser filamentation. All molecules in the path of a filament can be dissociated into highly excited fragments, resulting in emission of characteristic fluorescence spectra. The fluorescence spectra provide information about the various molecules in the filaments. By using a filament-induced “fingerprinting” fluorescence technique, molecules in the atmosphere can be identified.
Keyword:
42.62.Fi; 42.65.–k; 52.38.Hb; femtosecond laser; filamentation; remote sensing
1. Introduction
The struggles of mankind to cope with environmental issues like global warming and industrial pollution date back to the beginning of the last century. In recent years, smog has gradually become one of the biggest environmental problems in China, paralyzing cities and blacking out the sun. Back in the last century in England, the “ Great Smog, ” lasting 60 years, was estimated to have killed at least 4000 Londoners, which was the worst air pollution disaster in British history. Based on the current situation, there is an urgent need for the new techniques for detecting, identifying and monitoring of the species of air molecules. So far, laser-based spectroscopy, such as differential absorption light detection and ranging (DIAL), and laser-induced fluorescence techniques have both been widely used for sensing atmospheric trace species.[1, 2] These techniques have been successfully used for detecting pollutants like NO, O3, CH4, and benzene with the sensitivities up to ppb range. However, for detecting one species of substance in the air, conventional spectroscopic techniques usually require a pump laser optimized at a special output wavelength. That means for one laser source, researchers can sense only one type of molecule at a time. For instance, in the DIAL technique, the laser light has to be alternately switched between an on-resonance wavelength, where the species under investigation absorbs, and a neighboring off-resonance wavelength, where the species does not absorb. Although lasers with tunable output wavelength are available, practical atmospheric sensing needs to detect something “ unknown” with real-time analysis. Hence, one cannot expect to choose the exact output wavelength ahead of time.
Nanosecond (ns) laser-induced breakdown spectroscopy (LIBS) is a well-developed technique for rapid, on-line, multi-elemental material analysis with only one laser source.[3, 4] By tightly focusing an output from a Q-switched laser, the emission spectrum from the material is made available for spectroscopic investigation. The ns laser pulse ionizes the molecules/atoms of the gaseous material mainly through the following processes; [11, 16] (i) multiphoton ionization of impurities, giving rise to the first few free electrons; [5] (ii) the acceleration of these free electrons through inverse bremstrahlung followed by cascade (avalanche) ionization by these electrons in the laser field of long duration (ns) resulting in a plasma or breakdown.[6, 9] The series of atomic lines from the emission spectra of the plasma enable characterizing different types of molecules. However, the chemical bond between the atoms can be easily broken through electron collision. Therefore, in most cases, it is hard to find the spectral lines from whole molecules or from molecular fragments. In particular, some organic substances have similar chemical structures. Thus, LIBS typically gives similar atomic and C2 lines, which increases the difficulty of detecting the emission spectra from many “ unknown” molecular substances.
Recent advances in high-intensity femtosecond laser technologies have made it possible to examine the spectral technique for identifying molecules with high sensitivity through femtosecond laser filamentation. Filamentation is accepted as a dynamic equilibrium between Kerr self-focusing and plasma-induced defocusing.[10, 16] Due to the femtosecond pulse duration, which is short compared with the averaged electron collision time in air under normal atmospheric temperature and pressure conditions, no inverse bremstahlung and no cascade ionization are involved. Purely unimolecular multiphoton/tunnel ionization takes place. The plasma density (∼ 1014– 1016cm− 3) and temperature (5800 K) are very low in the filament plasma.[11, 19] A high intensity of ∼ 5× 10¹³W/cm2 is clamped inside a typical filament in air.[11] Under this intensity in the femtosecond time scale, molecules, apart from being ionized, can be highly excited and dissociated, resulting in “ fingerprint” fluorescence of molecular fragments.[17, 18] Thus, the states of molecules can be observed by using filament-induced fluorescence spectroscopy. Besides, the recent development in LIDAR (light detection and ranging) technique[20] could deliver the laser pulses over long distances and generate powerful filaments. Therefore filament-induced fluorescence spectroscopy can be used for identifying various substances in the atmosphere, including chemical and biological species ranging from gases and aerosols to solids.[21, 23]
In this paper, we review recent developments in filament-induced fluorescence spectroscopy. First, we give the basic theory and some physical properties of filamention. This is followed by a report of the universal applications for sample detection. Finally, we discuss technological developments for the stabilization and enhancement of fluorescence emissions. In the last part, we focus on our recent results in fluorescence enhancement through plasma grating.
2. Basic theory of femtosecond laser filamentation in air
In an intense femtosecond laser pulse propagating in air with peak power higher than the critical power for self-focusing, the pulse will self-focus in a slice-by-slice manner due to nonlinear Kerr effect.[10] The local field intensity increases at the self-focus, resulting in increased ionization of air molecules and increased plasma density, which induces a negative change in the refractive index 
Besides, the onset of a filament can be adjusted by modifying the initial laser parameters, such as beam diameter, divergence, and pulse duration.[10, 15] And by nonlinearly propagating terawatt femtosecond laser pulses (teramobile system[49]) over long distances in the atmosphere, a filament can reach up to a distance of ∼ 1 km.[50] As a consequence, by targeting the filaments at a certain position, the filament-induced fluorescence technique can be used to identify different substances, even remotely.
3. Filamentation-based fluorescence detection
Comparing the fluorescence technique with ns pulse, the filament-induced fluorescence spectra have better signal-to-noise ratio, as shown in Fig. 1 in Ref. [18] and Figs. 1– 4 in Ref. [78]. The main reason behind the superiority of the spectra in the case of filament is the low plasma density and temperature inside a filament. By using filament-induced fluorescence technique, various atmospheric trace species can be identified or even quantitatively measured. In laboratory conditions, the fluorescence spectra have been measured from hydrocarbon gases (CH4, C2H2), [51, 52] carbon dioxide, water vapor molecules, [41, 42, 53] chemical agents (ethanol or acetone), [54, 55] and solid particles (from burning mosquito coils and agricultural products).[56, 57] Collectively, these findings demonstrate the universal feasibility of this technique for atmospheric sensing. In the following section, the experimental results for the above studies are presented.
3.1. Applications in carbon dioxide and hydrocarbon gases
Carbon dioxide (CO2) and hydrocarbon gases are common ingredients of automobile exhaust, arising from incomplete combustion of gasoline. CO2 is a greenhouse gas that leads to global warming. While hydrocarbon gases might start chemical reaction with NO(x) in the daylight and create ozone and aldehydes, which is harmful to human eyes and respiratory systems. Hence, robust detection techniques are desired to monitor these gases and their dynamical changes in the atmosphere.
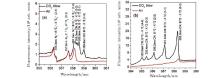
The filament-induced fluorescence in air with/without CO2 blowing into the filament zone is shown as the black/red curves in Fig. 1. A series of spectral lines from the CN radical's transition B2Σ – X2Σ were observed [see Table 1]. The generated CN radical was ascribed to a chemical reaction between N2 and CO2 molecules. The intense laser field induced dissociation of N2 and CO2 molecules. The dissociated fragments then recombined with each other to create CN radicals. The generated CN radicals were populated in an excited state, thus emitting a series of fluorescence. Due to the fact that the intensity of the spectral lines are associated with the partial pressure of gases in air, the concentration of CO2 in the atmosphere can be sensed by measuring the intensity of CN spectral lines.
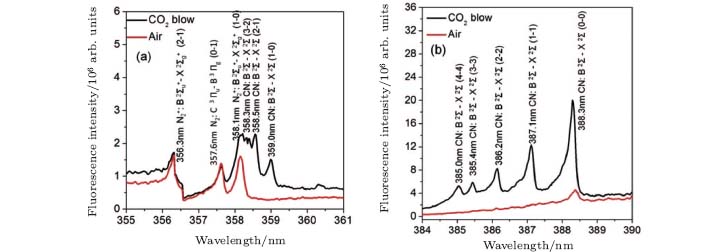 | Fig. 1. Typical spectra in the ranges of 355– 361 nm (a) and 384– 390 nm (b) for filament-induced fluorescence of CN in air. The filament was generated by focusing a 400-nm pulse of 47 fs /1.8 mJ with a lens of 30-cm focal length. The filament region was under a continuous stream of CO2. The fluorescence was detected from the side at room temperature (20 ° C). |
| Table 1. Details of the observed lines. All data are taken from Ref. [58]. |
For hydrocarbon gases, the filament-induced fluorescence technique has so far been applied to CH4, C2H2, and C2H4.[51, 52, 59, 60] For CH4, [51] the high intensity inside the femtosecond laser filaments dissociated the CH4 molecules into small fragments which emitted characteristic fluorescence. The backward fluorescence emission from CH radicals were observed, with well resolved spectral bands in the region of 420– 450 nm (A2Δ → X2Π ), 385– 405 nm (B2Ʃ → X2Π ) and 308– 320 nm (C2Ʃ + → X2Π ). The extrapolated detection limit reaches up to ∼ 0.85 km in distance and down to a few ppm in terms of minor element concentration, according to the LIDAR equation (I = L/R2, where I is the signal intensity, L is the effective filament length, and R is the distance between the end of the filament and the detector). In particular, the mixture of CH4, C2H2, and C2H4 was probed at a distance of 118 m by using a closed loop adaptive optic system to enhance the geometrical focusing.[17, 18, 59] More recently, the outdoor remote sensing of trace CH4 using filament induced fluorescence in air was performed during daylight hours.[60] The atmospheric turbulence and sunlight background in this outdoor experiment decreased the efficiency to detect the CH fluorescence by a factor of three to four as compared with the laboratory experiment.[17, 60] This conclusion justifies the extrapolations of the experimental results obtained in the laboratory to longer ranges and poses a challenge for this technique in practical applications.
3.2. Application in water condensation measurement
For atmospheric physics, relative humidity is particularly important, because of its relevance to the changes of state of the water content in air, which is also the key parameter for predicting the weather. Besides, haze is a mixture of fine particles and liquid droplets in air, which is associated with the water condensation conditions in the atmosphere. Hence, humidity calibration is essential for reporting hazy weather. The measurement of filament-induced water vapor fluorescence was performed through fluorescence detection of two substances, namely, the directly dissociated fragments (OH) of water vapor molecules (Section 3.2.1) and the fragments (NH radicals) newly created by chemical reaction (Section 3.2.2).
3.2.1. Humidity calibration through dissociation of water vapor molecules
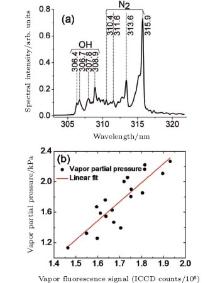
Absolute humidity was measured in air using filament-induced fluorescence spectroscopy.[53] Clean fluorescence was found in the spectral range of 306– 309 nm in Fig. 2(a), which was identified as OH radicals.[58] These OH radicals were ascribed to the dissociation of water vapor molecules in air. The fluorescence signal intensity was linearly proportional to the water vapor concentration (water vapor partial pressure), as shown in Fig. 2(b), which opens up a new possibility for measurement of water vapor concentration.
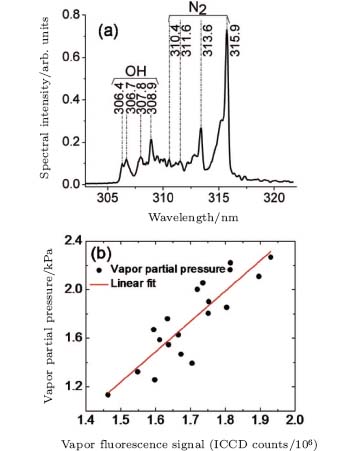 | Fig. 2. (a) Typical spectrum in the range of 303– 322 nm for filament-induced fluorescence of water vapor in air over a surface of water. The fluorescence spectrum was taken from the side at a water temperature of 80 ° C and filament-to-water surface of 5 mm. (b) Partial pressure of water vapor in air as a function of the OH fluorescence signal at 308.9 nm at a water temperature of 21 ° C. The filament was generated by focusing a pulse at 800 nm/50 fs/2 mJ with a lens of 50-cm focal length. The fluorescence was measured from the side. |
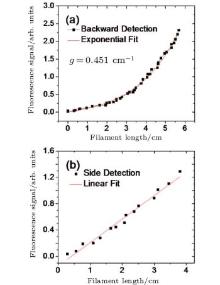
The detailed physical picture of a femtosecond pulse-induced photon dissociation of water vapor molecule was reported in Ref. [41], as determined by measuring the number of infrared photons involved in the dissociation process. The results show that the fluorescence of OH comes from the dissociation channel H2 O + nhν → H(2S) + OH(A2Ʃ +), with the threshold energy of around 9 eV. Here, n indicates the mixture of the contribution from various excited states and is not an exact number of photons. The transition from excited OH (A2Ʃ +→ X2Π ) emitted fluorescence 306– 309 nm has a peak at 308.9 nm. In particular, the backscattered OH fluorescence increases exponentially as the filament length increases in Fig. 3(a), while in Fig. 3(b), the OH fluorescence from the side had a linear dependence on the filament length, which demonstrates the amplified spontaneous emission (ASE) in water vapor. The ASE lasing opened up possibilities to use the filament-induced fluorescence technique for remote humidity calibration. If we use high input pulse energy to increase the filament length, stronger fluorescence emission from OH fragments is expected, which could benefit calibration of humidity over a longer distance.
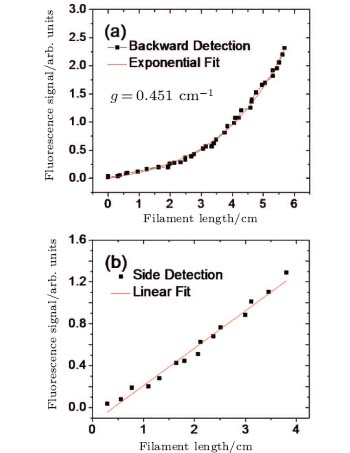 | Fig. 3. Fluorescence intensity of OH at 308.9 nm versus the filament length. The fluorescence is recorded in backward (a) and side (b) directions. |
3.2.2. Humidity calibration through blue filament-induced chemical reactions
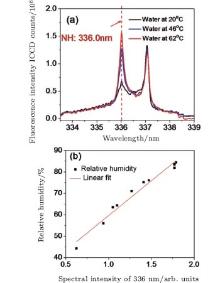
Relative humidity can also be measured through filament-induced chemical reaction. The filament was generated by focusing a pulse at 400 nm/50 fs/1.8 mJ with a lens of 30 cm focal length in air at 6 mm above the surface of a water bath. The fluorescence spectra were taken from the side. Fluorescence at 336 nm was observed as shown in Fig. 4(a).[42] The fluorescence was identified as NH* radiation from A3Π → X3Ʃ − .[58] The typical fluorescence from molecular N2 at 337 nm was also observed. The NH radicals were ascribed to the recombination process of the dissociated N2 and water vapor molecules. When the water temperature increases, the water vapor concentration is higher, so the NH fluorescence is stronger. Especially when the water was at 62 ° C, the intensity of NH fluorescence at 336 nm was even stronger than that of N2 fluorescence at 337 nm. Hence, since the water vapor molecule was one of the reactants, by measuring the fluorescence intensity from NH radicals, the water vapor concentration can be calibrated. The resulting calibration shows that the relative humidity in air was linearly proportional to the fluorescence from NH free radicals [see Fig. 4(b)]. Besides, the ASE of the NH radical in the backward direction was observed as well, which could extend the technique for remote measurement of humidity.
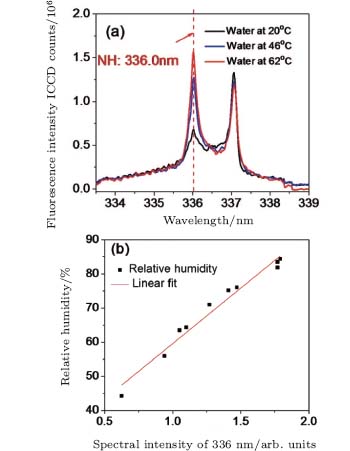 | Fig. 4. (a) Typical spectra in the range of 333– 339 nm for filament-induced fluorescence of NH in air. (b) Relative humidity in air as a function of the NH fluorescence signal at 336 nm at water temperature of 21 ° C. The relative humidity was varied by changing the temperature of the water and was measured by a hydrometer. |
3.3. Application in detecting chemical agents in air
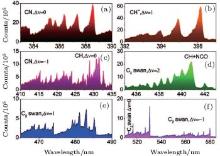
Recently, the filament-induced fluorescence technique was used to probe the ethanol sample in the open air conditions.[54] From the measurement, the backward emitted ethanol fluorescence could be clearly observed at a distance of 30 meters using a telescope system. Another experiment based on acetone is shown on Fig. 5, [55] with “ clean” emission bands from CN, NCO, and C2 fragments. The experiment was done by placing a beaker with acetone beneath an infrared (800 nm/2.2 mJ/50 fs) filament. The fluorescence was detected in the near field. Although further investigations are still necessary in order to explore the underlying physics for the dissociation or explosion of the ethanol/acetone molecules, the technique confirms the characteristics for detecting several atmospheric species simultaneously with a single laser source as already shown in more detail on many other molecules, gaseous and aerosols, chemical and biological, in Refs. [17] and [18].
 | Fig. 5. Fluorescence spectra from acetone at different wavelength range of 383– 390 nm (a), 392– 397 nm (b), 410– 435 nm (c), 435– 443 nm (d), 465– 490 nm (e), and 510– 582 nm (f). The experiment was done by placing a beaker which was filled with acetone beneath an infrared filament. The fluorescence spectra were measured from the side. |
Most recently, the behaviors of CN and CH emissions were demonstrated by detecting the fluorescence from a filament passing through an ethanol flame.[61] The fluorescence intensity of these species were sensitive to the distance between the filament and the combusting flow, opening up a possibility for remote combustion diagnosis in engines through filament-induced fluorescence spectroscopy.
3.4. Applications in detecting solid particles
Solid particles (smokes) are the condensation nucleus of smog, which is connected with the current hazy weather in China (the word “ smog” meaning smoke and fog). By using the remote filament-induced fluorescence technique, the fluorescence emission from a cloud of smoke was investigated. The smoke was produced from burning mosquito coils (made from a cooked mixture of wood flours, binders, colorants, and 0.25% allethrin) located at a distance of 25 m from the laser source and LIDAR detector.[56] Several transitions from the molecular systems B2Ʃ – X2Ʃ CN, A2Δ – X2Π CH, and A3Π g– X2Π u C2 Swan bands were observed from the spectra of smoke, indicating CN, CH, and C2 molecular fragments. Similarly, dusts of agricultural products, barley, corn, and wheat, were studied through nonlinear fluorescence of fragments induced by the high-intensity inside filaments in air.[57] All the species showed identical spectra, namely C2 and CN bands, as well as atomic Si, C, Mg, Al, Na, Ca, Mn, Fe, Sr, and K lines. The intensity ratios of different elemental lines were used to distinguish these three samples.
4. Enhancement of fluorescence emissions through plasma grating
Lots of “ tricks” have been tried in order to enhance the filament-induced fluorescence emission and increase the signal-to-noise ratio. Enhancement of the fluorescence has been demonstrated by adjusting the initial laser parameters, such as beam diameter, divergence and pulse duration[10, 16] or by using adaptive optics.[59] Scientific results have also shown techniques for reducing the spectral background in air, by optimizing the detection time of the fluorescence to a time-delay around ∼ 7 ns to avoid contamination from nitrogen fluorescence, or by merging multiple filaments into a geometric focus through a defocusing telescope.[62] However, most of these “ tricks” are affected by the clamped intensity inside the filament. Inside a filament, the intensity is locked to ∼ 5× 10¹³ W/cm2 in air. By using these traditional technical improvements, we can get much “ cleaner” spectra (better signal to noise ratio), but still, new techniques are expected to enhance the fluorescence emission and reveal more detailed physical pictures.
Nonlinear interaction of multiple infrared femtosecond filaments could generate plasma gratings[63, 75] that may tolerate higher laser intensities beyond the clamped intensity limit. In this sense, new spectral lines might be generated due to the high-intensity-induced multiphoton absorption. In the following section, we discuss our results in enhancing fluorescence by employing plasma gratings.
4.1. Plasma grating enhanced fluorescence emissions
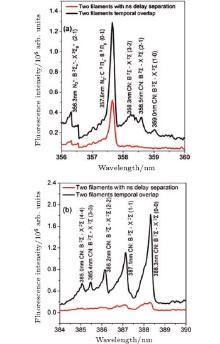
In order to investigate plasma grating enhancement of fluorescence emission, an experiment was performed as follows. Two infrared filaments with the same polarization and incident pulse energy of 1.0 and 0.9 mJ at 800 nm/50 fs were crossed. A CO2 gas was continuously blown into the filament zone. The time delay between the two filamenting pulses was adjusted in order to avoid any influence from molecular alignment. It was set at ∼ 2 ns. In this case, there was no strong interaction between the two filaments. The filament-induced spectra are represented as red curves in Figs. 6(a) and 6(b) when the two filaments were delayed by 2 ns. The spectral lines from CN radicals are rather weak, even if there is “ something” around 388.3 nm, which possibly indicates CN radicals from B2Ʃ – X2Ʃ (0 − 0).
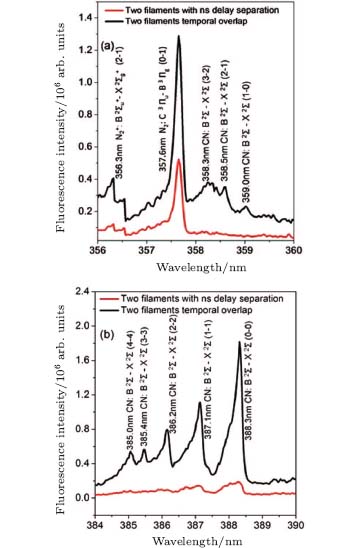 | Fig. 6. Typical spectra in the ranges of 356– 360 nm (a) and 384– 390 nm (b) for the fluorescence of CN in a continuous CO2 stream. The black curves were taken when the two infrared filaments were temporally overlapped, while the red curves were measured when there was a ∼ 2 ns time delay between the two infrared filaments. |
However, once the non-collinearly crossed infrared filaments were temporally overlapped, a “ brighter” plasma channel was produced indicating stronger interaction. The black curves in Figs. 6(a) and 6(b) were taken when the plasma channel was the “ brightest” as directly observed by eyes. In this case, “ clean” fluorescence of CN radicals from B2Ʃ – X2Ʃ was found. Next, we explain the plasma grating enhanced fluorescence emission.
When the non-collinearly crossed infrared filaments were temporally overlapped, the local field intensity in the overlapping region (plasma gratings), where constructive interference occurred, increased significantly.[63, 65] More molecules were ionized in this region. The intensity at the plasma grating reached ∼ 1.2× 10¹⁴ W/cm2, [55] which was more than twice as strong as that in a single free propagating infrared filament (∼ 5× 10¹³ W/cm2[10, 16]). Higher intensity inside the plasma grating stimulated stronger nonlinear optical processes. Under a CO2 gas stream, dissociation of molecular CO2 and N2 was more probable. It produced more fragments of C and N. The dissociated fragments recombined with each other to create more CN radicals, resulting in stronger fluorescence emissions of CN (B2Ʃ – X2Ʃ transition).
Besides, the higher intensity inside the plasma grating also increased the multiphoton/tunnel ionization of neutral nitrogen, creating more excited 


4.2. Fluorescence enhancement induced by accelerated electron through plasma grating
When an intense infrared pulse is focused on a preformed UV plasma grating, electrons in the interaction region are accelerated and inelastic collision ionization generates more electrons, which dissociates more molecules and gives rise to stronger atomic spectral lines.[69] During the experiment, the plasma grating was created by two UV filaments. Each of them was generated by pump pulse at 266 nm with pulse energy of 1 mJ. Another infrared pulse at 800 nm/40 fs was incident onto the preformed plasma grating at the Bragg incident angle of 4° and at a proper time delay with respect to the two UV pulses. Due to a spatially periodically modulated refractive index inside the plasma grating, the zeroth- and first-order Bragg diffraction of the incident infrared pulse were symmetrically located beside the two output patterns of the UV beams.
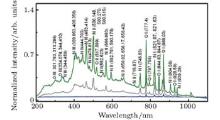
As shown in Fig. 7, the atomic and ionic spectra and particularly those of highly ionized nitrogen and oxygen ions, increased with one or more incident infrared pulses at appropriate delays. With a spatially periodic distribution of electrons through multiphoton ionization inside the UV plasma grating, some ionized electrons were further accelerated by the infrared electric field. The accelerated electrons triggered impact ionization and dissociation of other molecules and ions, in a near avalanche-like process, giving rise to strong fluorescence emission of many atomic ions including the fluorescence emission of the ionic N2 + and O2 + lines. Here it is necessary to note that, although similar atomic spectra could be observed through LIBS, the LIBS technique requires tight focusing of the nanosecond pulse and is usually not possible to apply in remote measurement. In contrast, our technique is based on the nonlinear interaction between interfering filaments, so more applications are anticipated in atmospheric sensing.
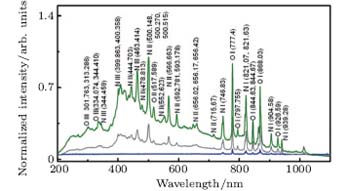 | Fig. 7. Fluorescence spectra from the plasma grating induced by two interfering UV pulses (blue curve), from plasma grating with a Bragg incident infrared pulses (800 nm/10 mJ/40 fs) delayed 3.6 ps with respect to the UV pulses (grey curve), and from plasma grating with two Bragg incident infrared pulses (800 nm/10 mJ/40 fs) of 5 mJ subsequently delayed 3.6 and 7.2 ps with respect to the UV pulses (green curve), respectively. The emission wavelengths were marked above the corresponding peaks for atomic ions and highly ionized ions. A dramatic increase of plasma and ionic fluorescence indicated impact ionization induced by the infrared pulses in the pre-formed plasma channels. |
5. Summary
In this paper, we have reviewed representative results of the filamentation-based fluorescence technique for atmospheric sensing. This fluorescence technique has been successfully applied in identifying various samples in a laboratory environment, including hydrocarbon gases and carbon dioxide, water vapor, chemical agents (ethanol or acetone), and solid particles (in the smoke of mosquito coils and the dust of agricultural products), with high sensitivity and good signal-to-noise ratio. The applications confirm the reliability and feasibility of this technique. Besides, unlike previous publications on filament-induced fluorescence spectroscopy, we demonstrate that the fluorescence emissions are enhanced through plasma grating by non-collinearly overlapping two filaments. The stronger emissions will enable us to detect targets at greater distances.
The advances in femtosecond laser technique constantly decrease the cost of a ultrafast laser system, which opens up prospects for the filament-induced fluorescence spectroscopy. However, most experiments with this technique have been done in the laboratory. In an outdoor remote experiment, air turbulence and unpredictable weather conditions might change the intensity inside the filament a bit, which increases the difficulties of quantitative calibration of the concentration of atmospheric trace species. This requires more effort in stabilizing the intensity inside the filament and minimizing the influence of daylight. Besides, the detailed dynamics of the filament-induced fragmenting processes and chemical reactions are yet to be explored. Hence, there are still a lot of challenges, not only for practical applications, but also for understanding the underlying physics.
The authors thank Ms. Zheng Li-Juan, Dr. Liu Jia, Dr. Shi Li-Ping, and Prof. Wang Tie-Jun for fruitful scientific discussion.
Reference
| 1 |
|
| 2 |
|
| 3 |
|
| 4 |
|
| 5 |
|
| 6 |
|
| 7 |
|
| 8 |
|
| 9 |
|
| 10 |
|
| 11 |
|
| 12 |
|
| 13 |
|
| 14 |
|
| 15 |
|
| 16 |
|
| 17 |
|
| 18 |
|
| 19 |
|
| 20 |
|
| 21 |
|
| 22 |
|
| 23 |
|
| 24 |
|
| 25 |
|
| 26 |
|
| 27 |
|
| 28 |
|
| 29 |
|
| 30 |
|
| 31 |
|
| 32 |
|
| 33 |
|
| 34 |
|
| 35 |
|
| 36 |
|
| 37 |
|
| 38 |
|
| 39 |
|
| 40 |
|
| 41 |
|
| 42 |
|
| 43 |
|
| 44 |
|
| 45 |
|
| 46 |
|
| 47 |
|
| 48 |
|
| 49 |
|
| 50 |
|
| 51 |
|
| 52 |
|
| 53 |
|
| 54 |
|
| 55 |
|
| 56 |
|
| 57 |
|
| 58 |
|
| 59 |
|
| 60 |
|
| 61 |
|
| 62 |
|
| 63 |
|
| 64 |
|
| 65 |
|
| 66 |
|
| 67 |
|
| 68 |
|
| 69 |
|
| 70 |
|
| 71 |
|
| 72 |
|
| 73 |
|
| 74 |
|
| 75 |
|
| 76 |
|
| 77 |
|
| 78 |
|