†Corresponding author. E-mail: jfyu1979@126.com
*Project supported by the National Natural Science Foundation of China (Grant Nos. 61302186 and 61271378) and the Funding from the State Key Laboratory of Bioelectronics of Southeast University.
Agrobacterium tumefaciens strain C58 is a type of pathogen that can cause tumors in some dicotyledonous plants. Ever since the genome of A. tumefaciens strain C58 was sequenced, the quality of annotation of its protein-coding genes has been queried continually, because the annotation varies greatly among different databases. In this paper, the questionable hypothetical genes were re-predicted by integrating the TN curve and Z curve methods. As a result, 30 genes originally annotated as “hypothetical” were discriminated as being non-coding sequences. By testing the re-prediction program 10 times on data sets composed of the function-known genes, the mean accuracy of 99.99% and mean Matthews correlation coefficient value of 0.9999 were obtained. Further sequence analysis and COG analysis showed that the re-annotation results were very reliable. This work can provide an efficient tool and data resources for future studies of A. tumefaciens strain C58.
At present, the rapid development of sequencing technology is accelerating the explosive accumulation of genomic sequences in bioinformatics databases. When faced with these abstract character strings composed of A, G, C, and T, it is difficult to obtain useful information directly. Thus, one of the most important tasks at hand is to develop efficient mathematical algorithms for annotating the genomic components precisely. Among programs that mine genomic components, protein-coding gene prediction may be the most basic one.
Because of the lack of introns in a prokaryotic genome, it would seem that gene prediction would be much easier in prokaryotes than in eukaryotes. However, more and more studies have indicated that gene prediction in prokaryotic genomes is far from being completely accomplished, and the annotation errors seem to be very universal in microbial genomes, a reality that has seriously depressed the reliability of databases and even caused false scientific conclusions.[1, 2] Some genome re-annotation algorithms have been put forward to filter out the falsely predicted protein-coding genes (i.e., the over-annotated protein-coding genes). However, because the numerical parameters employed in the prediction algorithms only partially exhibit the specific features of protein-coding genes, the predicted results produced by different programs differ greatly in most cases.[3] Thus, it is essential to seek better numerical parameters in order to depict features of protein-coding genes in prokaryotic genomes comprehensively. In this work, the over-annotated protein-coding genes in the genome of Agrobacterium tumefaciens strain C58 were re-annotated on the basis of two kinds of graphical representations; [4] namely, the Z curve[5] and the TN curve[6] methods. In order to assess the reliability of the predicted results, the concepts of relative G + C content and purine/pyrimidine disparity at the three codon positions were proposed, which can exhibit the uneven usage properties of protein-coding sequences. Finally, circumspect bioinformatics analysis based on the above-mentioned evaluation indexes and COG annotation, as well as other evidence, showed that the predicted results are very reliable.
This paper is organized as follows. In Section 2, the dataset and the re-annotation algorithm were introduced. In section 3, the re-annotation results and discussion were presented. Finally, we presented a summary of our results in section 4.
A. tumefaciens strain C58, originally isolated from a cherry tree tumor, is a biovar 1 nopaline-producing strain, with a genome consisting of one circular and one linear chromosome and two plasmids.[7] The genomic sequence was downloaded from the relatively well-annotated RefSeq database, [8] where the accession numbers of the four replicons of strain C58’ s genome are NC_003062, NC_003063, NC_003064, and NC_003065, respectively. According to the current annotation of strain C58’ s genome, 5355 open reading frames (ORFs) are protein-coding genes that can be classified into three groups. The first group includes the function-known genes, which are genuine protein-coding genes that can be used as the training set and testing set in the re-annotation program. The third group is composed of the ORFs that are marked with “ hypothetical protein, ” which need to be further verified because some may be random sequences that are falsely predicted to be protein-coding genes. Other annotated genes in the second group are marked with prefixes, such as “ putative” and “ conserved.” Although the annotated genes in the second group are much more reliable than those in the third group, some are still questionable.
The re-annotation program was developed by integrating the TN curve and the Z curve methods[4] (for details, please refer to www.cbi.seu.edu.cn/RPGM). To numerically display the intrinsic properties that differentiate between protein-coding and non-coding sequences, 75 numerical parameters were derived from the two kinds of graphical representations.
The TN curve can project 64 kinds of trinucleotides into a two-dimensional space, [5] and then each trinucleotide is numerically decided by coordinates (x, y) on the basis of which z = x * y is defined. Based on the encoding strategy of the TN curve, 54 character parameters corresponding to the geometric center of each variable are derived to exhibit the specific property of composition and order of trinucleotides along the DNA sequences, which is written as Eqs. (1), (2), and (3).

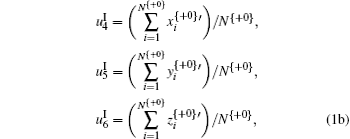


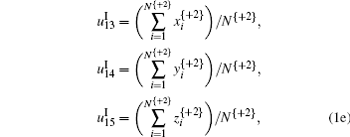


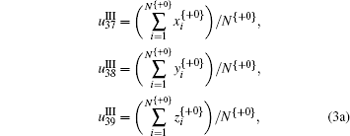
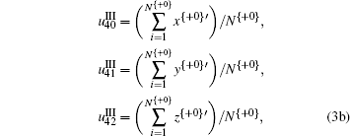


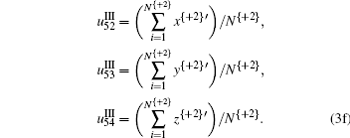
It is noted that in Eq. (3), + 0, + 1, and + 2 represent the three forward-reading frames from 5′ to 3′ of each sequence, respectively, and N{} is the total number of trinucleotides in each reading frame; I, II, and III denote three encoding strategies to decide (x, y), which is dependent on the first, second, and third base category, respectively; x’ , y′ , and z′ display the cumulative effect of x, y, and z, respectively.
In contrast to the TN curve, the 21 parameters derived from the Z curve exhibit the statistical properties of each codon position, [9] including nine position-specific parameters (Eq. (4)):

where i = 1, 2, 3 denotes the three codon positions. Besides this, 12 phase-specific dinucleotides are also illustrated by the following Z-transform (Eq. (5)):
 |
In Eq. (5), X = A, C, G, T; p(AA), p(AC), … , p(TT) represent the occurring frequencies of the 16 dinucleotides AA, AC, … , TT, respectively.
As is well known, the intrinsic difference between protein-coding genes and non-coding sequences lies in the former having regularly specific features, such as asymmetric nucleotide distributions at the three codon positions and codon usage bias, whereas the latter does not have such features. Thus, the ability to propose efficient numerical descriptors to exhibit the specific features of protein-coding genes is the core for gene prediction programs. In this work, 54 numerical descriptors derived from the TN curve and 21 statistic numerical descriptors derived from the Z curve method were used to demonstrate the specific features of protein-coding genes. As has been introduced before, [4, 10, 11] the numerical descriptors derived from the TN curve can exhibit information about the composition and distribution of trinucleotides along DNA sequences. In contrast, the numerical descriptors derived from the Z curve provide statistical information about the base compositions at the three codon positions as well as the dinucleotide compositions.[9] Therefore, the two groups of parameters can complement each other, displaying comprehensive sequence properties of protein-coding genes from different angles. On the other hand, the differences between protein-coding genes and non-coding sequences are universal in all species, which has been the foundation of gene prediction algorithms. In this work, the 75 derived parameters were used to demonstrate these universal properties that differentiate protein-coding sequences from non-coding sequences; therefore, it is conceivable that the present method is applicable to other prokaryotic genomes.
The Fisher discriminant algorithm has been used extensively in gene prediction-related problems (for details, please consult the work by Zhang and Wang).[12] The function-known protein-coding genes in the first group mentioned above were used as the positive training set, and corresponding shuffling sequences were used as the negative training set. Thus, a 75-D coefficient (C) for differentiating the positive and negative samples was obtained by the Fisher linear equation. Furthermore, the threshold C0 was determined by strictly allowing the rates of false-negatives and false positives to be identical. Then, a T_ score = C · V– C0 was assigned to each sequence, which can decide its coding/non-coding status by T_ score > 0 or T_ score < 0.
To evaluate the efficiency of the predicted results, the accuracy (Ac), sensitivity (sn), and specificity (sp) parameters proposed by Burset and Guigo[13] were adopted, which are described as

where TP and TN denote the number of coding and non-coding ORFs that have been correctly predicted, respectively. By contrast, FP and FN denote the coding and non-coding ORFs that have been falsely predicted, respectively.
In addition, the MCC value was also used to describe the agreement of predictions and annotation with a single value in the range of [− 1, 1]. The MCC can be represented as

On the basis of the re-annotation algorithm introduced above, the questionable protein-coding genes in the second and third groups were re-predicted. It is noted here that because of the lack of non-coding sequences in prokaryotic genomes, the negative samples in the training set were produced by shuffling the genuine protein-coding genes. Then, the re-annotation algorithm was run 10 times to provide objective predictions, and those items that were predicted to be non-coding at least eight times were filtered as over-annotated genes. To evaluate the performance of the present method, the mean accuracy and MCC values were calculated. After performing the re-annotation algorithm, almost all the protein-coding genes in the first group could be correctly predicted each time, and only one protein-coding gene (Atu3016) in NC_003062 was falsely predicted twice. The average accuracy and MCC values of 99.99% and 0.9999 were obtained, respectively. Using the discriminant coefficient C and threshold C0 trained by the training set, all the annotated protein-coding genes in the second and third groups were re-predicted. Finally, all of the items in the second group were predicted to be protein-coding genes, and 30 hypothetical genes in the third group were predicted to be over-annotated genes, including 11 items in the positive strand and 19 items in the negative strand. In Table 1, the 30 over-annotated genes are presented.
| Table 1. The 30 hypothetical genes that were predicted to be non-coding sequences. |
After performing the re-annotation algorithm on the A. tumefaciens strain C58 genome, the questionable protein-coding genes were re-annotated, with high accuracy and MCC values. Our recent work has demonstrated that most gene-finding programs can produce very different prediction results even with similar accuracy.[3] Thus, it is still not certain whether the re-annotation results are reliable enough. It would be necessary to provide external evidence for why the filtered hypothetical genes do not code proteins.
As is well known, the assumption that the specific sequence structures differentiate protein-coding genes from non-coding sequences forms the theoretical basis of gene-finding programs. Many kinds of statistical methods have been proposed to describe the specific features of protein-coding genes from different angles, which may be the key factor that causes the various predictions by different gene-finding programs. In this work, the 75 derived parameters reflect information about the composition and distribution of both nucleotides and trinucleotides. In the scatter diagram of Fig. 1, a simple index was used to reflect the relative G + C content at the three codon positions of the predicted over-annotated genes and the genuine genes composed of the remaining ORFs. The relative G + C content is defined as the ratio of the G + C content at each codon position to the G + C content of the whole sequence. Obviously, the relative G + C content equals 1 if the G + C content at the corresponding position is identical to that of the whole sequence, which means less usage bias. As can be seen from Fig. 1, the locating regions of the predicted over-annotated genes differed greatly from those of the protein-coding genes. Close observation shows that the over-annotated genes are located around coordinate (1, 1), whereas the genuine protein-coding genes are far from this coordinate. Therefore, figure 1 indicates that the 30 over-annotated genes are likely to be random sequences.
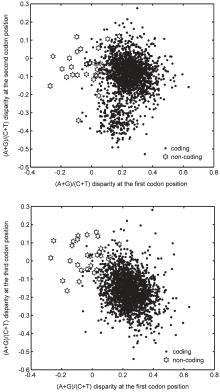
Previous studies on protein-coding sequences have shown that strict constraints are exerted on each codon position to encode functional proteins, a fact that has been used as the foundation of gene-finding algorithms. Generally, it was found that the constraints are universal, in that the first codon position prefers purine bases.[14] On the other hand, the flexible third position determines the codon usage bias, which is coincident with Fig. 1. In Fig. 2, the purine/pyrimidine disparity obtained by the difference of A+ G content and T+ C content at the three codon positions was calculated. A close observation of this figure shows that the distributions of the predicted over-annotated genes are obviously different from those of the genuine protein-coding genes. It is obvious that the purine bases are absolutely predominant at the first codon position in genuine protein-coding genes, whereas the purine/pyrimidine disparity at the first position of the over-annotated genes is below zero. Further analysis of the genuine protein-coding genes and the over-annotated genes showed the mean values of purine/pyrimidine disparity at the first codon position to be 0.24 and − 0.03, respectively. In Fig. 1, we have demonstrated that the G + C content at the third codon position of the over-annotated protein-coding genes exhibit less bias. A similar tendency can be found from Fig. 2, as the values of purine/pyrimidine disparity of the over-annotated genes are close to zero. Further analysis showed the mean values of purine/pyrimidine disparity at the third position for the genuine and over-annotated genes to be − 0.164 and 0.02, respectively. Therefore, figure 2 provides additional evidence that the 30 over-annotated genes do not encode proteins.
In the past several years, the Clusters of Orthologous Groups of proteins (COG) database[15] has been used widely in gene recognition-related problems. Each COG represents a group of three or more proteins that have evolved from a common ancestor. The ORF marked with a COG code is believed to be highly likely to encode proteins. According to the current annotation of the A. tumefaciens strain C58 genome, almost 97% of the function-known genes are assigned with COG codes, whereas no more than 60% of the hypothetical genes are marked with COG codes. Among the 30 over-annotated protein-coding genes, only Atu5025 and Atu8205 have COG codes, which are COG0856F and COG4991S, respectively. The COG code letters “ F” and “ S” designate the metabolism group and the poorly characterized group, respectively. COG0856F stands for “ orotate phosphoribosyltransferase homologs” and COG4991S stands for “ uncharacterized protein with a bacterial SH3 domain homolog” ; hence, both ORFs have no explicit matches, even though they have been assigned COG codes. It was noted that the genome annotation of A. tumefaciens strain C58 had been updated during the preparation of this revised work. Unsurprisingly, the COG codes of Atu5025 and Atu8205 have been cancelled in the updated version. Therefore, the COG analysis indicates that our prediction is much more reliable in another sense. Previous studies have shown that some annotated short ORFs may be not true protein-coding genes, and these short ORFs also account for most of the over-annotation of the protein-coding genes in prokaryotic genomes. In strain C58’ s genome, the average length of the 30 over-annotated genes is 340 bp, whereas that of the genuine protein-coding genes is about 950 bp. In a recent work by Wang et al., [16] 29 ORFs were predicted to be over-annotated genes in strain C58’ s genome. Importantly, although there are only 13 common items with our work, it was found that 10 of these could be verified by molecular biological experiments. Therefore, the present work is an efficient complement for future genome annotation research.
Up to now, almost 6887 genomic projects have been completed, among which about 96% are from prokaryotic genomes.[17] As genome annotation is a multistep process, [18, 19] the quick advance of these increasing sequence data provides severe challenges for bioinformatics, particularly with regards how to accurately annotate the genomic components. In the past 30 years, gene finding has been one of the most important topics of the life sciences. Even so, the problem of gene annotation errors has been deemed a universal phenomenon in microbial genomes, [20, 21] and different re-annotation strategies have been outlined.[3] Despite that most programs have claimed to achieve high accuracies on their training sets and testing sets, more and more recent studies using different gene-finding algorithms have shown that the predicted results differ greatly.[3, 4, 22, 23] Therefore, there is an urgent need to develop more comprehensive algorithms for reliable predictions. In this work, with high accuracy, we re-annotated the A. tumefaciens strain C58 genome on the basis of 75 efficient parameters derived from the TN curve and Z curve methods. The reliability analysis based on the proposed position-specific indexes, COG annotation, and other analyses support our predictions as being credible. We hope that this computational method will be a helpful tool for future genome annotation studies.
| 1 |
|
| 2 |
|
| 3 |
|
| 4 |
|
| 5 |
|
| 6 |
|
| 7 |
|
| 8 |
|
| 9 |
|
| 10 |
|
| 11 |
|
| 12 |
|
| 13 |
|
| 14 |
|
| 15 |
|
| 16 |
|
| 17 |
|
| 18 |
|
| 19 |
|
| 20 |
|
| 21 |
|
| 22 |
|
| 23 |
|


