†Corresponding author. E-mail: baoyuan@mail.ustc.edu.cn
‡Corresponding author. E-mail: zhupp@ihep.ac.cn
*Project supported by the National Basic Research Program of China (Grant No. 2012CB825800), the Science Fund for Creative Research Groups, the Knowledge Innovation Program of the Chinese Academy of Sciences (Grant Nos. KJCX2-YW-N42 and Y4545320Y2), the National Natural Science Foundation of China (Grant Nos. 11475170, 11205157, 11305173, 11205189, 11375225, 11321503, 11179004, and U1332109).
The relationship between noise variance and spatial resolution in grating-based x-ray phase computed tomography (PCT) imaging is investigated with reverse projection extraction method, and the noise variances of the reconstructed absorption coefficient and refractive index decrement are compared. For the differential phase contrast method, the noise variance in the differential projection images follows the same inverse-square law with spatial resolution as in conventional absorption-based x-ray imaging projections. However, both theoretical analysis and simulations demonstrate that in PCT the noise variance of the reconstructed refractive index decrement scales with spatial resolution follows an inverse linear relationship at fixed slice thickness, while the noise variance of the reconstructed absorption coefficient conforms with the inverse cubic law. The results indicate that, for the same noise variance level, PCT imaging may enable higher spatial resolution than conventional absorption computed tomography (ACT), while ACT benefits more from degraded spatial resolution. This could be a useful guidance in imaging the inner structure of the sample in higher spatial resolution.
The advantage of using x-ray phase contrast in x-ray imaging has been attracting attention, especially since the 1990s, [1] owing to the development of digital x-ray imaging technologies, including x-ray signal detection schemes[2– 10] and information extraction algorithms.[11– 20] Among the x-ray signal detection schemes, grating-based x-ray phase imaging is considered to be the most promising approach for future clinical medical imaging[1] because of its large field of view and good compatibility with conventional x-ray sources, [5, 21] and the extension to computed tomography[22] is capable of assessing quantitative information about the three-dimensional (3D) geometry and properties[23– 26] of a sample. Meanwhile, several information extraction algorithms[2, 3, 6, 15] have been developed. In particular, the phase stepping (PS) method is widely used as a gold standard to extract the absorption and refraction images, where the absorption image is the same as the result of conventional absorption-based x-ray imaging. However, due to the complex scanning mode and high radiation dose, the phase stepping method will be impeded in future practical applications. Recently, the reverse projection (RP) method[3, 27] has been introduced as a simple, fast, and low dose information extraction approach. The RP method does not need a lateral scan of the grating, thus overcoming the limitations of both data acquisition speed and dose imparted to the specimen in a computed tomography (CT) scan.
The noise variance is a critical evaluation indicator in x-ray imaging, [27– 36] which depends on exposure level and spatial resolution.[37, 38] The exposure level determines whether the imaging approach is suitable for biomedical application, and the relation between noise variance and spatial resolution determines whether sufficient contrast-noise-ratio (CNR) can be generated at high spatial resolution and acceptable dose levels.
In this paper, a quantitative analysis of the noise properties of the RP method used in a 3D image is presented, which utilizes error propagation formula to calculate the noise transfer characteristic of the x-ray source derived from statistic noise (Poisson distribution).
In order to study the relation between noise variance and spatial resolution, a Talbot interferometer and a phase computed tomography (PCT) geometry are used. Like a crystal analyzer-based system, a grating interferometer (see Fig. 1(a)) also records the refraction angle signals and the intensity oscillation curve (see Fig. 1(b)) can be exploited to fully describe its performance.
The photon number detected by the detector can be expressed as[3]

where N0 (x, y, φ ) = I0 (x, y, φ )Δ hΔ d is the total photon number impinging on the detector during the unit time in the absence of the sample, I0 (x, y, φ ) is the mean photon flux, Δ h is the detector element height, Δ d is the detector element width, xg is the displacement between the phase grating (G1) and the analyzer grating (G2) transversely with respect to the incident beam, D is the distance between the phase grating and the analyzer grating, S(xg/D) is the shifting curve, and M(x, y, φ ) is the absorption projection data, and its expression is

Here, the coordinates (x, y, z) represent the reference coordinates of the imaging system, the coordinates (x′ , y, z′ ) refer to the sample coordinates which change as the sample rotates, 

where δ is the refractive index decrement.
In the RP approach, the gratings are set to be at the positions where the intensity curve follows a linear behavior. For small value of θ satisfying the condition | θ | ≤ p2/4D, the shifting curve can be well approximated by its first-order Taylor expansion

where 


where k is a constant.
The RP method needs to acquire two mutual reverse images by rotating the sample by 180° . The projected image at the rotation angle φ and its corresponding reverse image at φ + π can be expressed, respectively, as[3]


Combining the two projected images generated by the conjugate x-ray pair, one can easily extract the absorption and refraction angle signals, which are shown as


Owing to photon number fluctuations, the measurements will fluctuate around a mean value. In general, assuming that the photon number distribution follows Poisson statistics, [37] one can calculate the noise variance of the absorption projection data 


From Eqs. (10) and (11), one can show that the noise variance of projection data is inversely proportional to the detected total mean photon number at a given projection view angle, while the noise variance of differential projection data is dependent on the detected total mean photon number, the refraction angle 
When the sample rotates, the detected data are collected from different view angles, resulting in these data being uncorrelated. Therefore, noises of projection data and differential projection data have a white-noise-like property[37]


where the subscripts i and j denote the view angle indexes in the measurement of PCT data. Here, 


Given the reconstructed information, the absorption signal M and the refraction angle θ fulfill the line integral condition required by computed tomography, absorption coefficient μ and refractive index decrement δ can be easily obtained by the inverse Fourier Transform. Specially, a Hilbert filter is also used to obtain the refractive index decrement:


where ρ is the spatial frequency, and F– 1 denotes the inverse Fourier transform.
Based on the convolution theorem, the equations can be expressed as
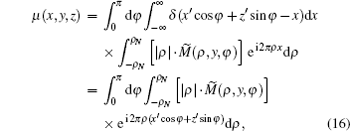
where ρ N = 1/(2Δ x) is the bandwidth of Nyquist frequency, Δ x is the spatial resolution of the projection image on the detector in the reference coordinates of the imaging system, and is about two or three times the detector element width, namely Δ x = (2 ∼ 3)Δ d. We proved that Δ x equals the in-plane spatial resolution of the reconstruction, which is typically defined[39, 40] as the value at which the modulation transfer function (MTF) reaches a given percentage of its maximum (see Appendix A for the calculation of Δ x), so Δ x can be used as both the spatial resolution of the projection image and the in-plane spatial resolution of the reconstruction in the following section. 
According to Eq. (16), the noise variance of reconstructed absorption image at pixel (x′ y, z′ ) is

Using the white-noise-like property, the Fourier transform of the white noise is given as

Therefore, equation (17) can be simplified as
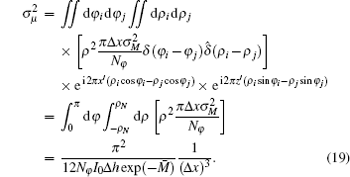
Meanwhile, the case of the refractive index decrement is
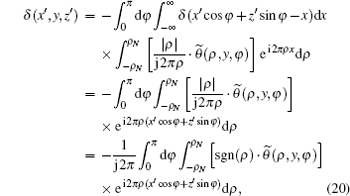
where 
According to Eq. (20), the noise variance of reconstructed differential image at pixel (x′ , y, z′ ) is

Using the white-noise-like property, the Fourier transform of the white noise is given as
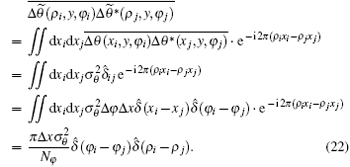
Therefore, equation (21) can be simplified as
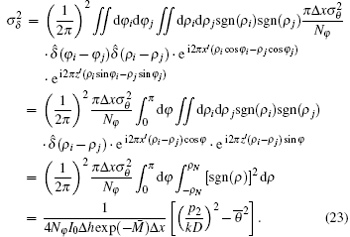
A comparison of noise variances between the absorption projection data and the differential projection data can be obtained

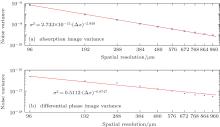
Equations (19) and (23) indicate that the noise variances of the reconstructed absorption coefficient and the refractive index decrement are dependent on several factors, including the grating design, the number of projections, the number of photons exiting from the sample, etc. Most importantly, for a given system design, the noise variance of PCT image is inversely proportional to the in-plane spatial resolution of the reconstruction, while that of absorption computed tomography (ACT) is inversely proportional to the third power of the in-plane spatial resolution of the reconstruction.
Simulation experiments based on the ray-optical approach have been performed to demonstrate theoretical predictions regarding the noise behavior of the reverse projection extraction method combined with different reconstruction algorithms.
In the simulations, we use a Talbot interferometer system operated with a plane-wave illumination of 28 keV. The phase grating G1 has a pitch of p1 = 4.0 μ m, the size which is the same as the size of pitch of analyzer grating G2, and is used to introduce π / 2 phase shift with a 50% duty cycle at the designed incident x-ray beam energy. The distance between G1 and G2 is assumed to be the first fractional Talbot distance z1 = p2 / 2λ . We take a cylinder of 24-mm diameter made of polymethyl methacrylate (PMMA) for our sample, whose complex refractive index is n = 1 − 4.26 × 10− 7 + i1.53 × 10− 10. With a detector pixel area of 48 μ m × 48 μ m and an x-ray source flux of 2 × 10⁶ photons/s/mm2, the total exposure time at one viewing angle is 2 s, i.e., 1 s for each image in the RP method. To acquire a complete data set for CT reconstruction, 360 views of projection are taken in steps of 1° . The imaging procedures with a spatial coherence length Lc = 3p1 are simulated on MATLAB. In the images sampling process, the detector pixels are binned along the horizontal directions 1 × 1, 2 × 1, … , 10 × 1 to explore noise variance dependences on spatial resolution, which are shown in Fig. 2.
Figure 2 shows the simulated data to demonstrate the relation between noise variance and spatial resolution. The logarithm of the measured data is calculated and fitted to a linear function against the logarithm of spatial resolution of the reconstructed images using a nonlinear least squares fit method. Note that the use of a log-log plot results in a linear display of the data, where the exponent of the fit becomes the slope of the curve.
The essence of CT is to restore the depth information lost in projection process. An important issue within radiology today is how to reduce the radiation dose during CT examinations at no expense of the image quality. In general, higher radiation doses result in higher-quality images, while lower doses lead to increased image noise and unsharp images. However, increased doses raise the adverse side effects, including the risk of radiation induced cancer. Therefore, the existing trade-off between noise level and radiation dose restrains the improvement in image quality. In this work, we demonstrate that the use of reverse projection method PCT is able to simultaneously reconstruct an image of the absorption coefficient like conventional ACT and an image of the refractive index decrement with much higher CNR than conventional ACT at a lower radiation dose level.
That the anomalous noise behavior in PCT differs from that in conventional ACT results from the Hilbert filtering kernel used in the CT reconstruction algorithm, which equally weights all spatial frequency content across the range of Nyquist frequency, while the ramp filtering kernel provides a linearly increasing frequency response across the same range.
Considering the similarity in measuring refraction angle data, the same conclusion as the relation between noise variance and spatial resolution can be applied to diffraction enhanced imaging CT (DEI-CT), Nano-CT based on x-ray differential phase microscopy and neutron differential phase CT based on gratings.
The noise model we discussed takes into account photon number fluctuations of the x-ray source. Actually, although they are negligible in most cases, some other factors such as the electronic noise of the detector, the spatial nonuniformities of the gratings, the mechanical drift of the gratings with respect to each other due to thermal instabilities and round-off noise that results from the limited dynamic range of the scanner can also contribute to the degradation of the image quality for particular designs or experimental conditions. Practical solutions such as gain correction, optimized mechanical design, and temperature control can minimize these contributions.
One potential limitation of this study is the extension of the conclusion to higher spatial resolution on the order of the pitch of the gratings. Up to now, the detector pixel size is larger than grating period, and therefore limits the spatial resolution. However, when the detector pixel size is scaled down to the level below the size of grating pitches, the RP method cannot extract the refraction angle signal anymore, then the relation between noise variance and spatial resolution will be invalid.
In the present study, both the theoretical deduction and numerical stimulations prove the scaling laws between noise variance and spatial resolution in grating-based phase tomography with reverse projection extraction method. The noise variance of PCT images is found to be inversely proportional to spatial resolution, while noise variance of conventional ACT is inversely proportional to the third power of spatial resolution. The results show that PCT may enable higher spatial resolution than ACT at the same radiation dose, or a lower dose penalty than ACT at fixed spatial resolution and CNR.
In a CT, the projection image of a plane perpendicular to the rotation axis is a one-dimensional (1D) function of rotation, which can be shown as a line integral of a Cartesian coordinate function

where M(x, φ ) is the projection function, and μ (x, z) is the absorption coefficient of the sample.
In consideration of the sizes of the x-ray source and the detector element, the measured projection function can be treated as a convolution of the projection function M(x, φ ) and the 1D point spread function (PSF) α (x, φ ) of the projection image, shown as

where 
Like the relation between M(x, φ ) and μ (x′ , z′ ), α (x, φ ) and 


Using Eqs. (A2), (A3), and (A4), we obtain

where 


From Eq. (A6), one can find that h(x′ , z′ ) is the PSF of the reconstructed image. Without loss of generality, we can suppose that the PSF h(x′ , z′ ) is a two-dimensional (2D) Gaussian function with an FWHM diameter of Δ r

where 
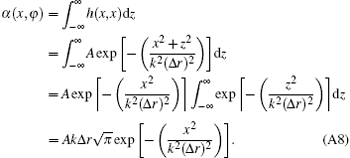
Therefore, the FWHM of width α (x, φ ) is equal to the FWHM diameter of h(x, z), i.e.,

In general, the resolution of Δ x equals two or three times the detector element width, namely Δ x = Δ r = (2 ∼ 3)Δ d. Without loss of generality, one can assume that Δ x = 2Δ d.
| 1 |
|
| 2 |
|
| 3 |
|
| 4 |
|
| 5 |
|
| 6 |
|
| 7 |
|
| 8 |
|
| 9 |
|
| 10 |
|
| 11 |
|
| 12 |
|
| 13 |
|
| 14 |
|
| 15 |
|
| 16 |
|
| 17 |
|
| 18 |
|
| 19 |
|
| 20 |
|
| 21 |
|
| 22 |
|
| 23 |
|
| 24 |
|
| 25 |
|
| 26 |
|
| 27 |
|
| 28 |
|
| 29 |
|
| 30 |
|
| 31 |
|
| 32 |
|
| 33 |
|
| 34 |
|
| 35 |
|
| 36 |
|
| 37 |
|
| 38 |
|
| 39 |
|
| 40 |
|


