


Interfacial nanobubbles produced by long-time preserved cold water
Cite this Article
Zhou Li-Min, Wang Shuo, Qiu Jie, Wang Lei, Wang Xing-Ya, Li Bin, Zhang Li-Juan, Hu Jun. Interfacial nanobubbles produced by long-time preserved cold water
. Chinese Physics B, 2017, 26(10): 106803 
Permissions
Interfacial nanobubbles produced by long-time preserved cold water
† Corresponding author. E-mail:
Project supported by the Key Laboratory of Interfacial Physics and Technology, Chinese Academy of Sciences, the Open Research Project of the Large Scientific Facility of the Chinese Academy of Sciences, the National Natural Science Foundation of China (Grant Nos. 11079050, 11290165, 11305252, 11575281, and U1532260), the National Key Basic Research Program of China (Grant Nos. 2012CB825705 and 2013CB932801), the National Natural Science Foundation for Outstanding Young Scientists, China (Grant No. 11225527), the Shanghai Academic Leadership Program, China (Grant No. 13XD1404400), and the Program of the Chinese Academy of Sciences (Grant Nos. KJCX2-EW-W09 and QYZDJ-SSW-SLH019)
Abstract
Interfacial gaseous nanobubbles which have remarkable properties such as unexpectedly long lifetime and significant potential applications, are drawing more and more attention. However, the recent dispute about the contamination or gas inside the nanobubbles causes a large confusion due to the lack of simple and clean method to produce gas nanobubbles. Here we report a convenient and clean method to effectively produce interfacial nanobubbles based on a pure water system. By adding the cold water cooled at 4°C for more than 48 h onto highly oriented pyrolytic graphite (HOPG) surface, we find that the average density and total volume of nanobubbles are increased to a high level and mainly dominated by the concentrations of the dissolved gases in cold water. Our findings and methods are crucial and helpful for settling the newly arisen debates on gas nanobubbles.
1. Introduction
Interfacial nanobubbles were first proposed to explain the steps of the force-separation curves while two hydrophobic solid surfaces were detached from each other in water in 1994.[1] Later, their existence was confirmed by directly observing the spherical cap-shaped structures on different substrates with atomic force microscopy (AFM) and other imaging tools.[2–7] Interfacial nanobubbles are thought to be involved in many processes such as boundary slip,[8,9] emulsion without surfactant,[10] microboiling,[11] rupture of a wetting film,[12] and may have potential applications in surface cleaning,[13,14] nanomaterial engineering,[15–17] and mineral floating.[18–20]
Although a large amount of the earlier research has been done, there are still some key questions needing to be further explored. The explanations of the large contact angle of nanobubble (from water side) and surprisingly long lifetime are the main issue.[21–29] Those properties could not be explained by traditional Epstein–Plesset theory based on Laplace law and diffusion equation, which predicts that bubbles on the order of nanometers will dissolve into water within microseconds.[30] Several theories like contamination layer,[31] dynamic-equilibrium,[23,27,32,33] and high density inside nanobubbles[34] have been proposed in order to solve this puzzle. Nevertheless, the following research indicated that organic contaminant is not the cause of the stability and demonstrated that the gas inside the nanobubble is actually leaky.[35,36] The dynamic-equilibrium model was also criticized due to the lack of experimental evidence and the unclear driving mechanism of the gas influx near the contact line.[37,38] More recently, the contact-line pinning theory[29,39] proposed by Lohse and Zhang claimed that the local gas oversaturation and the pining effects near the three-phase line were the reason for stabilizing the interfacial nanobubbles. Furthermore, the numerical calculation,[28] lattice density functional theory results[40] and molecular dynamics results[41,42] based on the pining theory has successfully explained the large contact angle and the super-stability of a single nanobubble pinned on the heterogeneous surface. Despite the tremendous research progress of interfacial nanobubbles, many basic questions remain to be studied further. For example, we still do not know much about the properties of gas or water inside a nanobubble.[43] And disputes about the growth and mobility of nanobubbles and their effects on each other persist.[44–47] Except for interfacial nanobubbles, another gas state, micro-sized pancakes were often observed and could coexist with the interfacial nanobubbles.[48–52] Pancakes or gas enrichment layer underneath was also thought to stabilize above nanobubbles.[47,53,54] Therefore, what is the relationship between nanobubbles and pancakes? Why are they stable at solid/water surfaces? Further researches are needed to address these significant issues.
The difficulties in answering those basic questions come from many aspects, and one of them is related to the production of clean gas-filled nanobubbles. A reliable and reproducible method of nanobubble formation is the primary task for nanobubble research. In order to produce nanobubbles on varied surfaces like mica, HOPG, gold, polystyrene, Octadecyltrichlorosilane (OTS) modified silicon and alumina surfaces, several methods were developed such as the solvent exchange process,[55,56] water–NaCl exchange process,[57] photo- and electrochemical methods.[58] Because of the difficulty in revealing the chemicals inside the nanobubbles based on current detecting methods, recently some scientists began to realize that some conflicting results obtained by those methods may be caused by the overlook of impurities involved in the experiments and the lack of control experiments to validate that the observed spherical cap-shaped objects were indeed gas-filled nanobubbles. Some reports pointed out that those spherical cap-shaped objects might be polydimethylsiloxane (PDMS) droplets instead of gas-filled nanobubbles due to the use of disposable needles in the exchange process.[38] Similarly, other researchers doubted the existence of gaseous micro-pancakes and claimed that these irregular micron-sized domains were merely polymeric layers due to the use of plastic syringes.[20] Therefore, there is an urgent requirement for a reliable, contamination-free and controllable method of producing the clean gas nanobubbles.
According to the current understanding, nanobubbles would be produced when the gas concentration in the solution is oversaturated in the process. In order to avoid being contaminated, it is better to produce nanobubbles by using pure water system. But the point is how to obtain the oversaturation state of gas in a pure water system. As is well known, gas is more soluble in water at lower temperature and less at high temperature. Thus, the gas will escape from the solution and achieve an oversaturated state when the temperature is increased. Previous report indicated that nanobubble could readily nucleate at agas concentration of approximately 100%–110% and supersaturation was not a requirement.[25] According to this idea, recently researchers started to use pure water system to produce nanobubbles by changing the temperature and various methods were developed, such as temperature difference exchanging,[59] cold water deposited on hot substrate,[60] and microwave heating.[61] These methods were showed to be clean, but in order to achieve the high efficiency a high temperature or a high power was usually needed. However, high temperature or high power may seriously restrict the applications of nanobubbles in many important systems like biology and medicine.
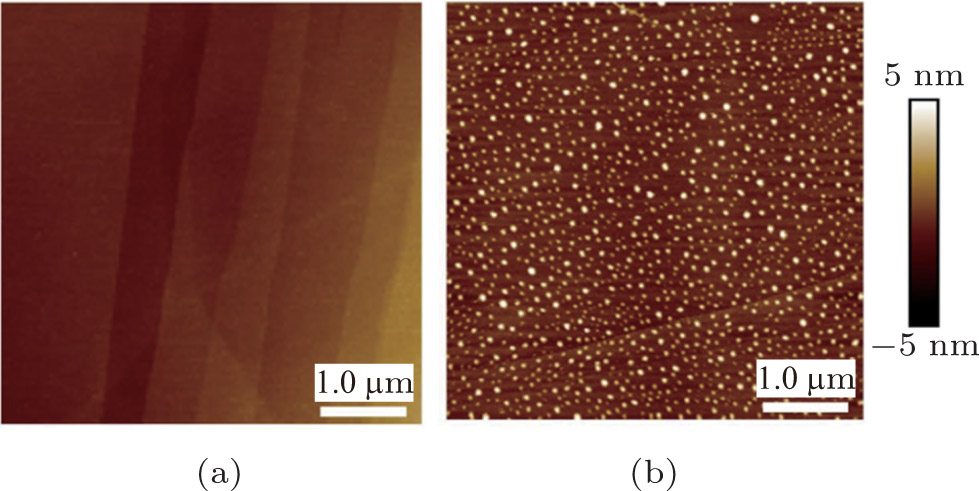
Here in this work, we develop a convenient one-step and controllable method to produce nanobubbles at HOPG/water surface by the gas-saturated cold water. In the whole process, the HOPG substrate is not treated by any heating process and only deionized pure water is used without any exchange process. The control experiments with degassing confirm that the nanobubbles produced by our method are indeed gaseous nanobubbles. The lateral sizes of the formed nanobubbles are about 100 nm–200 nm and distributed evenly on the HOPG substrate with a high efficiency of about 4~5 per μm2. The gas concentration in cold water is found to be a key factor in forming the nanobubbles and the number of nanobubbles per μm2 could be controlled by cooling time.
2. Results and discussion
2.1. Characterization of nanobubbles
As shown in Fig.
 | Fig. 1. (color online) AFM height images of HOPG surfaces using (a) room temperature water and (b) cold water after cooled at 4 °C for 72 h. The scan size is 5 μm × 5 μm. |
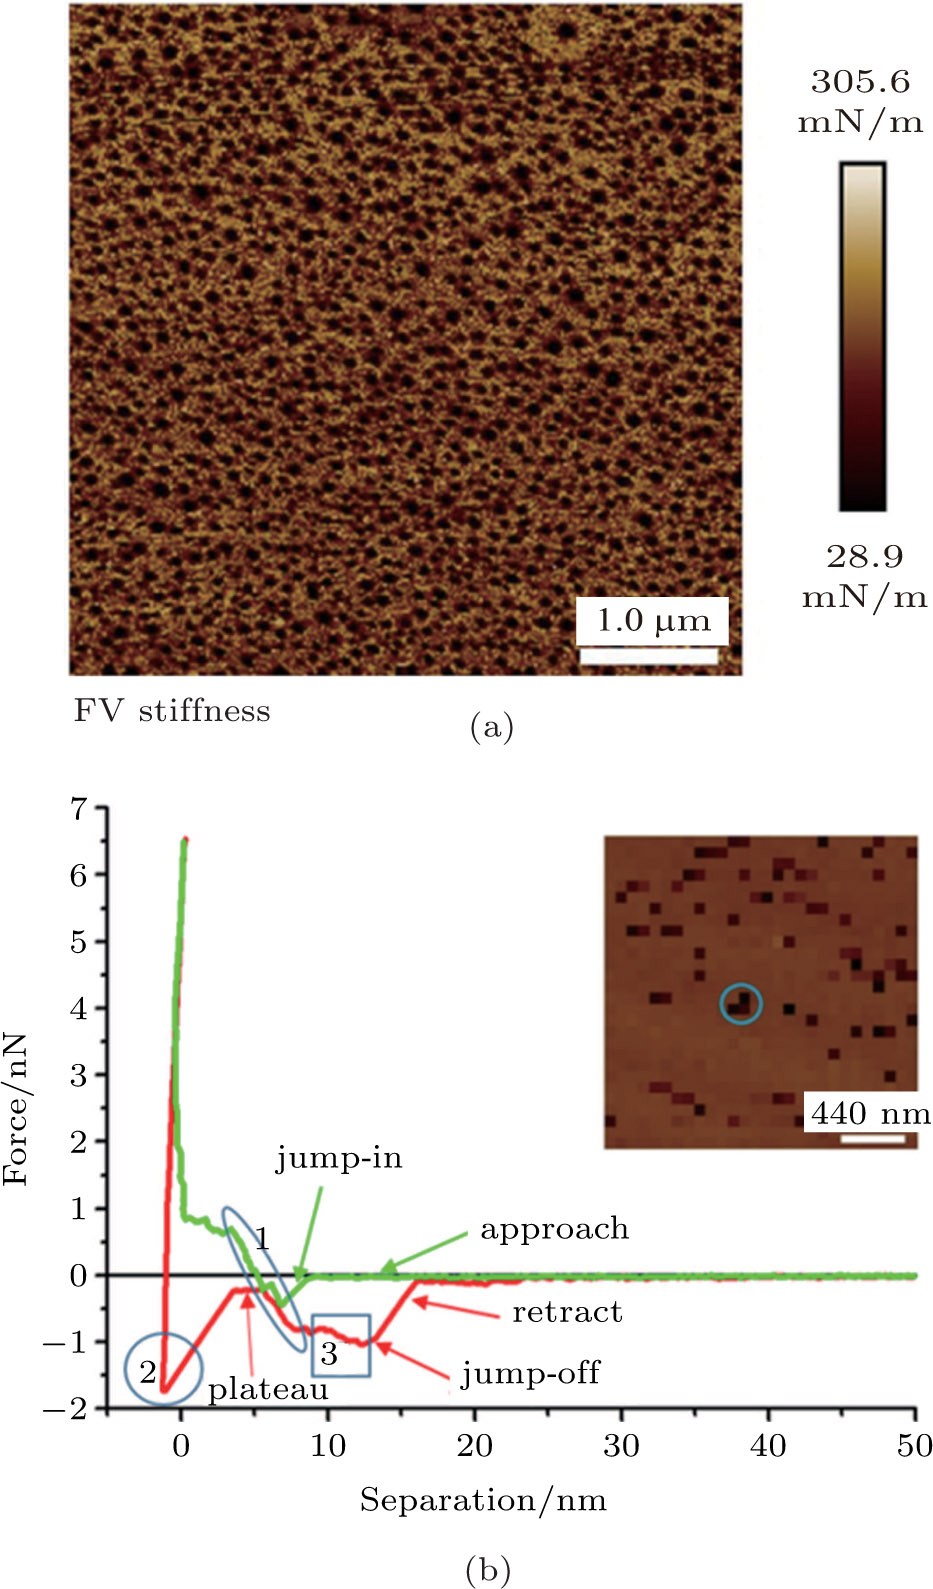
 | Fig. 2. (color online) (a) Stiffness image of nanobubbles in Fig. |
The force curves of a spherical cap-shaped object acquired by force volume mode are shown in Fig.
In the approaching curve (green line), the AFM tip firstly attached to the spherical cap-shaped object at about 10 nm, which is referred to as “jump-in” process. Then the AFM tip interacting with the object for about 8 nm in depth before reaching the HOPG surface. The tip-object interaction as shown in region 1 (ellipse) exhibits a quasi-linear response before touching the HOPG surface. The slope of the linear part is estimated at 1 nN/8 nm which is 125 mN/m. This is comparable to the surface tension of water 72 mN/m, which may indicate the gaseous property of the object. Those results are consistent with the results reported previously, suggesting that the tip-bubble interaction is dominated by the repulsive force which increases linearly when the tip approaches to the bubble.[63–65] and agrees with simulation results of interaction between AFM tip and pinned nanobubble by using the lattice density functional theory.[66]
When retracting from the substrate surface as shown in the region 2 (circle), the AFM tip suffers a strong adhesion force (~1.8 nN). The reason for that may be that the tip has already “touched” the HOPG surface when such a large trigger force is reached. Note that the interaction between the tip and the object has a small plateau before the linear-response starts in region 1 (ellipse). The plateau has also been observed in several researches on force curves of nanobubble.[63,67] This phenomenon is not expected with a hydrophilic tip according to the dynamic interaction model. But it can be explained if the tip is hydrophobic and penetrated into the bubble near the substrate surface so that the contact line does not contribute to the interaction force.[63] Considering the fact that the AFM tip is plasma-cleaned to achieve hydrophilicity before the imaging process, neither a hydrophobic tip nor a contaminated tip cannot be the most possible reason for that plateau. A possible explanation may state as follows: the AFM tip which is not so hydrophilic is eventually penetrated into the object due to the large loading force (6.5 nN) while approaching to the substrate surface. Therefore, when the tip is withdrawn from the substrate surface, the contact line is not pinned on the AFM tip and slips several nanometers on the tip before being fully pinned on the tip. In such views, a small plateau then appears before the linear response of tip-object interaction. In the next step as shown in region 3 (square), the contact line still attaches to the “less hydrophilic” tip which leads to an attractive force until the tip is jumped off from the object surface. It is noted that most of the features are exhibited in Fig.
To further verify that those cap-shaped objects are indeed gaseous nanobubbles, we place the cold water into a vacuum chamber and degassed at a pressure lower than 10 mbar (1 bar = 105 Pa) for more than 2 hours. When the degassed cold water is injected into the HOPG surface and kept for more than 30 min before AFM imaging, only smooth graphite surface is observed as shown in Fig.
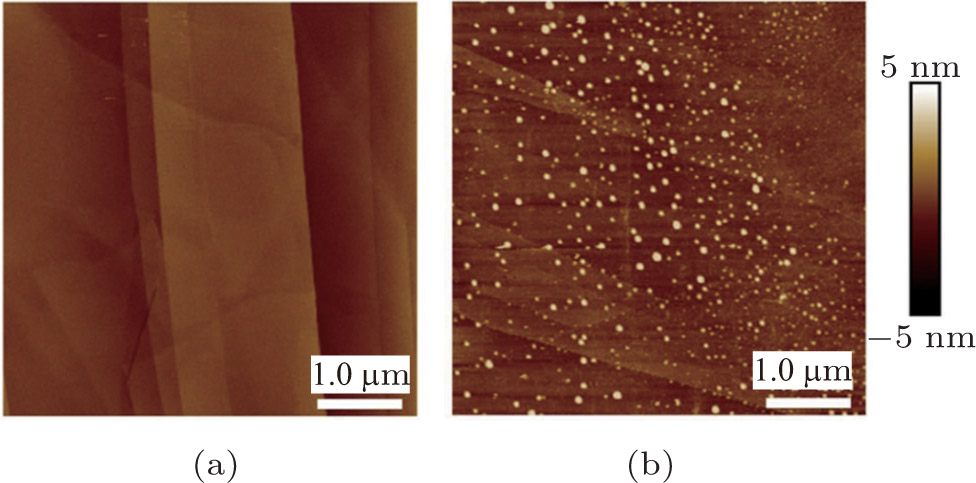 | Fig. 3. (color online) The AFM height images of HOPG surfaces in (a) degassed water and (b) degassed water cooled for at 4 °C for 72 h. The scan size is 5 μm × 5 μm. |
2.2. Controllable growth of nanobubbles
In order to find the appropriate experimental conditions for effective and controllable growth of nanobubbles, we further investigate the effects of different cooling time on the formation of interfacial nanobubbles. We cool the room temperature milipore water in the 4 °C refrigerator for 0 h, 2 h, 2 h, 4 h, 6 h, 12 h, 24 h, 48 h, and 72 h, then deposited these cold water onto the HOPG surface. In Fig.
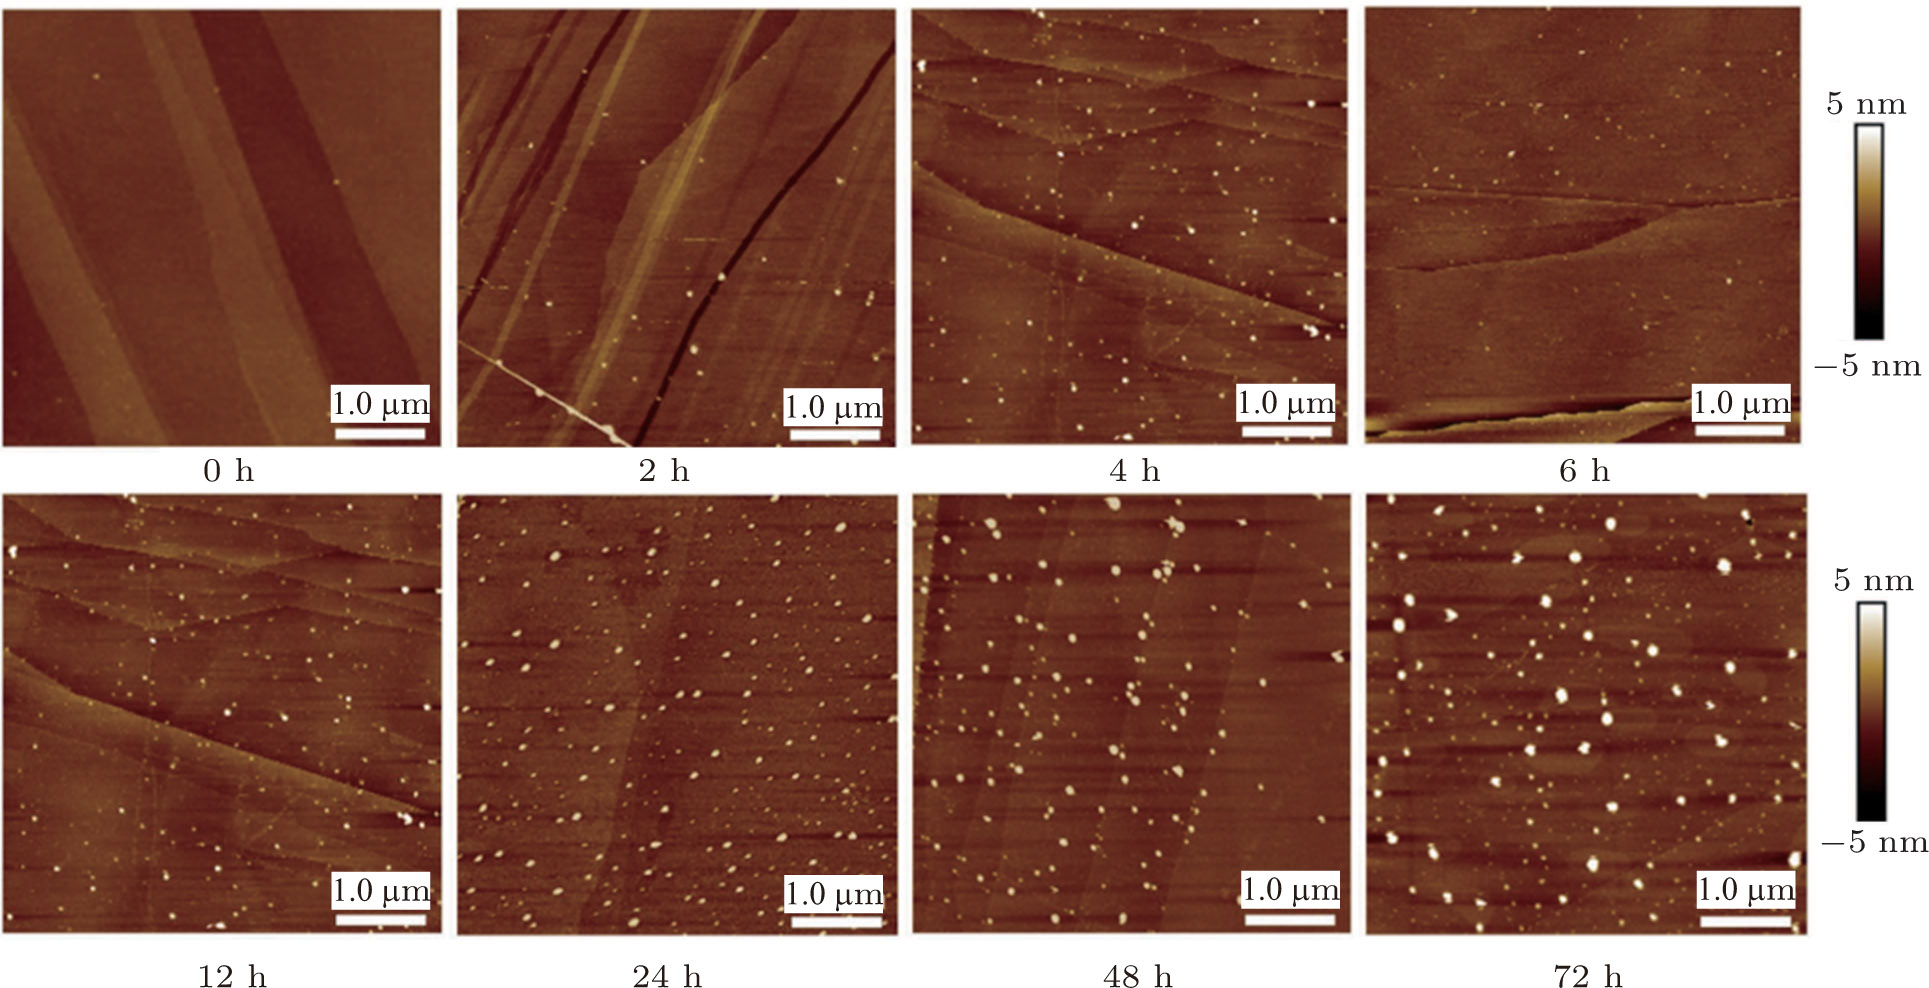 | Fig. 4. (color online) The AFM images of interfacial nanobubbles formed by cold water after being cooled at 4 °C for 0 h, 2 h, 4 h, 6 h, 8 h, 12 h, 24 h, 48 h, and 72 h. The AFM image of 0 h is obtained by using room temperature water stored in ambient condition. |
2.3. Quantitative analysis of density and volume of formed nanobubbles
where N is the total number of nanobubbles in an AFM image, 


5 . A set of detailed data for nanobubbles produced by cold water cooled for 48 h at 4 °C is provided in Table A1 in Appendix A .
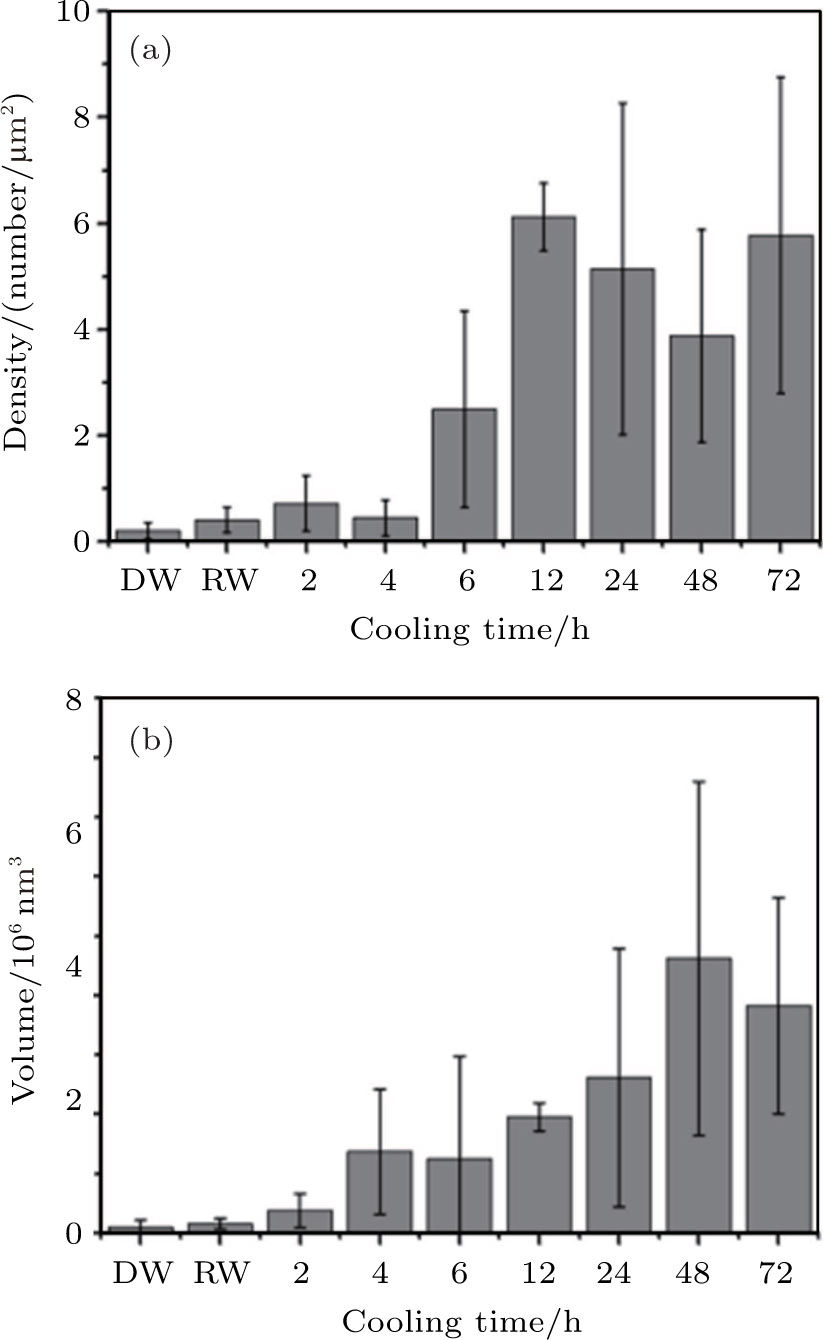
The densities (number) and volumes of formed nanobubbles in water with different cooling times are analyzed to further explore the physical properties of nanobubbles. It has been generally recognized that the physical and chemical heterogeneities of substrate would affect the formation of the interfacial nanobubbles. The nanobubbles formed on different substrates may be different even on the same substrate the nanobubbles are also different in different regions. For example, many nanobubbles tend to nucleate at the edge of the graphite steps as indicated by our observations. In order to reduce the substrate effects as much as possible and acquire a quantitative description about the nanobubbles formed by cold water with different cooling times, we have the experiments repeated independently at least 5 times for each group, and select the different areas randomly for AFM imaging. After that, those AFM images are analyzed following the particle analysis procedure in the Nanoscope Analysis V1.5 software to count the numbers of nanobubbles and their average lateral size. We only count the nanobubbles with lateral dimension larger than 50 nm and height higher than 2 nm considering the larger error problem of small bubbles. In this process about 150 AFM height images with 13580 nanobubbles counted are analyzed in all the experiments for this work.
Since the nanobubbles formed by cooled water are all spherical cap-shaped and similar to each other in lateral size, we then calculate the density and total volume of the formed gaseous nanobubbles in the area from the following equations:
 |
 |
 | Fig. 5. Density and total volume of nanobubbles in the area produced by cold water with different cooling times, room temperature water and degassed water. Error bar is given by analyzing the AFM images scanned at different places on HOPG surface in the experiments. DW: degassed water, RW: room temperature water (0 h). |
| Table A1.
statistics Data of nanobubbles produced by cold water cooled for 48 h at 4 °C. . |
In Fig.
2.4. Effects of the dissolved gases on the nanobubble formation
In our method, the pure water is treated only by 4 °C and the high temperature is avoided in all the processes. Our strategy is based on the fact that at lower temperature such as at 4 °C the gas concentration would be higher than that at room temperature. Thus when the gas-saturated cold water is brought to the room temperature, an oversaturation state will be expected. This could be demonstrated by directly measuring the gas concentration in water.
Although most of the dissolved gases in water are nitrogen and oxygen, it is difficult to accurately measure the dissolved nitrogen in water. Alternatively, the dissolved oxygen is measured to understand how the excess dissolved gasaffects the formation of nanobubbles in our method. As shown in Fig.
 | Fig. 6. Concentrations and saturations of the dissolved oxygen in cold water after different cooling times. The saturation rate is acquired by comparing with the 100% saturated water at 25 °C (8 mg/L). |
While in the room temperature water (0 h), the dissolved gases are quiet few (4.5 mg/L, 55% saturation) and no nanobubbles can be formed by such water. As shown in Fig.
In the control experiments, room temperature water preserved at the room temperature over 72 h could not produce nanobubbles on HOPG. We further cool this gas-saturated water at room temperature in 4-°C refrigerator for half an hour and find very few nanobubbles on HOPG surface, either. This means that the cold pure water with saturated gas at room temperature is not sufficient to produce a lot of nanobubbles. All the experiments show that only the cold pure water with gas saturated (normally 100%–120% saturation) at 4 °C can achieve the high efficiency of nanobubbles production. The growth mechanism is simple and can be explained as follows. When the cold water on the HOPG surface is warmed up, the gases are in an oversaturated state. This can be seen from the measured gas saturation of the cold water cooled for over 72 h, which is 10 mg/L, about 120% oversaturated, as compared with the saturated concentration 8 mg/L at the room temperature. Then, a large quantity of the dissolved gases would release from the bulk water and aggregate onto the hydrophobic HOPG surface. Therefore nanobubbles could be easily formed with a high efficiency.
3. Conclusions
In this work, we develop a contamination-free, one-step, and controllable method to effectively produce interfacial nanobubbles by cold water. The controlled experiments of degassing confirm that the spherical cap-shaped objects formed on HOPG surface are indeed gaseous nanobubbles. The total quantity of nanobubbles formed on HOPG surface is found to be dominated by the concentration of dissolved gases in cold water. The dissolved oxygen measurement reveals that the gas saturation is a key factor to produce nanobubbles. The high efficiency of nanobubble nucleation can be achieved at high gas concentration. The density and size of formed nanobubbles can be controlled by different cooling times. Since only pure water is involved and the formation of nanobubbles is highly effective and convenient, this method may have its unique advantages for studying the properties of nanobubbles in a well-defined, contamination-free system and potential applications in nano-engineering, bio-molecule absorption and surface modification. Our results may also provide a new path to understand the effect of gas concentration on the evolution of interfacial nanobubbles.
4. Experiment
4.1. Materials
The highly oriented pyrolytic graphite (short as HOPG, 12 mm × 12 mm, ZYB grade, Bruker) used as the substrate was freshly cleaved with double faced adhesive tape in each experiment. Deionized pure water (room temperature) was prepared with an ELGA PURELAB Classic water purification system to obtain a conductivity of 18.4 MΩ·cm. Degassed water was obtained by placing the water under 10 mbar for at least 2 h The freeze-pump-thaw process (3 cycles) was also used to acquire fully degassed water. The glass beaker (50 mL, 18 mm in diameter) and glass syringe (5 mL) were pre-cleaned with chromic acid and clean water. The AFM liquid cell contains a translucent O-ring which was used to seal the fluid. Before each experiment these glass containers and AFM liquid cell were ultrasonic cleaned with ethanol (99.8%, GR) and then deionized pure water for 45 min separately and then dried at 70 °C for 1 min before being used. The cold water was injected to the fluid cell through Teflon inlet and outlet tube and silicone connectors. The Teflon tubes and connectors were ultrasonic cleaned with ethanol (99.8%, GR) and then deionized pure water and dried before usage.
4.2. Nanobubble formation
In order to produce interfacial nanobubbles, the deionized water was firstly preserved in a clean glass beaker and sealed with Parafilm (Laboratory Film, Parafilm Brand) while leaving several holes to contact the air environment, then the water was cooled in a 4-°C refrigerator for 2 h, 4 h, 6 h, 12 h, 24 h, 48 h, and 72 h. The Parafilm used to seal the glass beaker was a plastic paraffin film which is translucent, waterproof and odorless. Its potential effects on the purity of the water during the long term preservation were assessed in Appendix
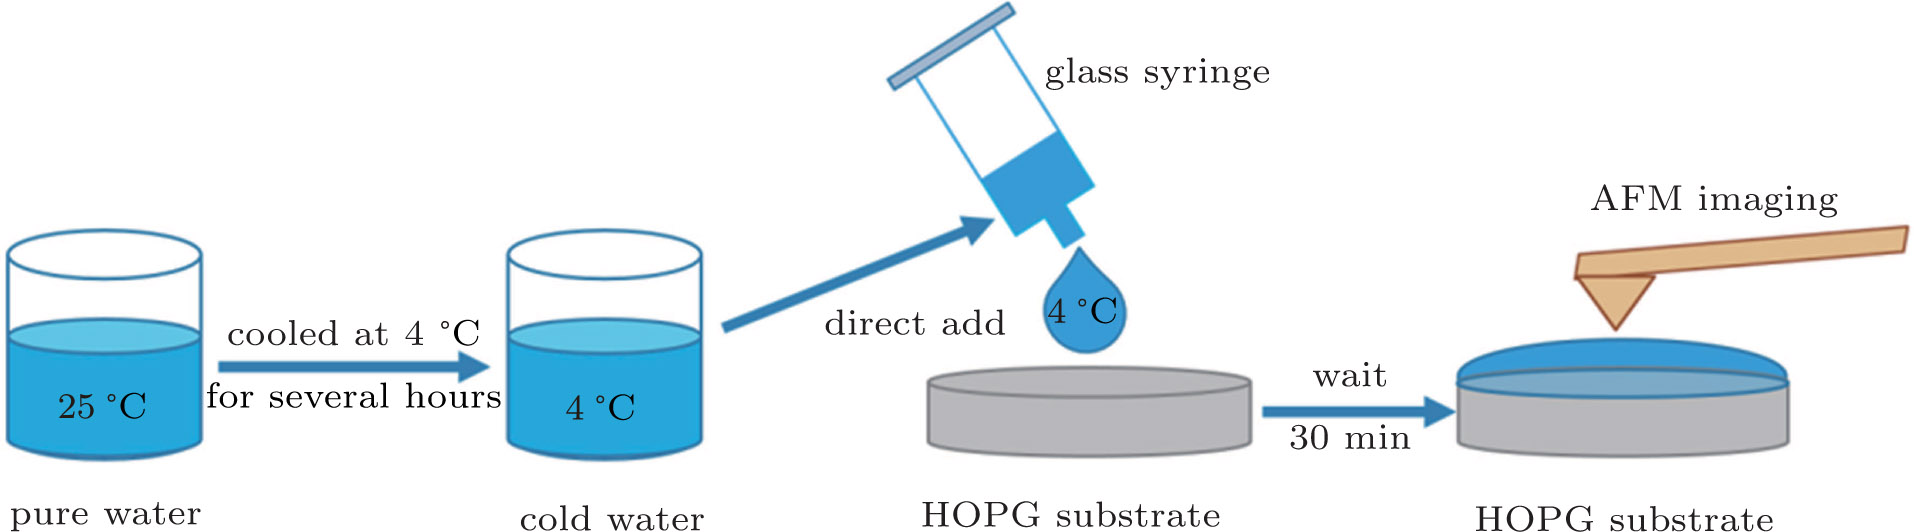 | Fig. 7. (color online) A brief diagram of the procedure for the nanobubble production. |
4.3. AFM experiments
PF-QNM (PeakForce Quantitative Nanomechanical Mapping) imaging in fluid was performed on a Bruker Multimode 8 SPM with NanoScope version 8.15 software and NanoScope V in order to quantitatively characterize the morphologies and stiffness of interfacial nanobubbles. The NPS-type probe (Bruker’s silicon nitride probes with a nominal spring constant of 0.35 N/m and a tip radius of 10 nm) and SNL-type probe (Bruker’s silicon nitride probes with a nominal spring constant of 0.1 N/m and a tip radius of 2 nm) were treated with a plasma cleaner (HARRICK PLASMA CLEANER PDC-32G) for about 3 min beforehand to achieve hydrophilicity and then immediately used to avoid being contaminated.
Following the standard PF-QNM imaging procedure, the deflection sensitivity and the spring constant of each cantilever were calibrated via PF-QNM ramp, thermal tuning on HOPG in water. The sample was oscillated vertically at a frequency of 2 kHz with an amplitude of 100 nm and a scan rate of 0.977 Hz. The Poisson ratio of the sample was set to be 0.5 as recommended by Multimode user guide to acquire reliable data while the stiffness of the sample was lower than 100 MPa. The peakforce set point was carefully selected and the loading force of imaging was about 200 pN–300 pN. Typical scan sizes were 5 μm and scan time for each image was 4 min–5 min. All the PF-QNM imaging was performed under ambient condition at room temperature and the humidity was about 30%–50%.
Force volume imaging was performed at a resolution of 128 pixels × 128 pixels with a scan rate of 0.0254 Hz. The ramp sizes and trigger thresholds were set to be 100 nm and 18.25 nm. The tip approaching speed was set to be 1.3 μm, and the number of points in a single approach–retraction cycle was 512. The scan size was 5 μm and for each image the scan took about 1 h. The force curves were presented as force versus separation, with the separation larger than 80 nm treated as the base line.
The offline AFM analysis program, NanoScope Analysis 1.5 was used for morphologies and mechanical property measurements and analyses. In particularly, particle analysis was performed to calculate the distribution and mean size of nanobubbles.
4.4. Dissolved oxygen measurement
The dissolved oxygen (DO) was measured by a dissolved oxygen meter (Orion Versa Star pro, VSTAR94, Thermo Scientific). The room temperature water was cooled at 4 °C for 2 h, 4 h, 6 h, 12 h, 24 h, 48 h, and 72 h before measurement. Because the temperature of the cold water would rise up very soon when removed from the 4-°C refrigerator, to avoid a possible deviation induced by temperature change, during the measurement the DO probe and the bottle of cold water were kept in an ice box to maintain a low temperature. Each measurement took about 2 min before the meter reached its equilibrium. The dissolved oxygen probe was calibrated in air-saturated water at 25 °C. The calibrated dissolved oxygen of air-saturated water at 25 °C was set to be 8 mg/L automatically by the meter. The experiments were repeated several times to acquire reliable data.
Reference
| [1] | |
| [2] | |
| [3] | |
| [4] | |
| [5] | |
| [6] | |
| [7] | |
| [8] | |
| [9] | |
| [10] | |
| [11] | |
| [12] | |
| [13] | |
| [14] | |
| [15] | |
| [16] | |
| [17] | |
| [18] | |
| [19] | |
| [20] | |
| [21] | |
| [22] | |
| [23] | |
| [24] | |
| [25] | |
| [26] | |
| [27] | |
| [28] | |
| [29] | |
| [30] | |
| [31] | |
| [32] | |
| [33] | |
| [34] | |
| [35] | |
| [36] | |
| [37] | |
| [38] | |
| [39] | |
| [40] | |
| [41] | |
| [42] | |
| [43] | |
| [44] | |
| [45] | |
| [46] | |
| [47] | |
| [48] | |
| [49] | |
| [50] | |
| [51] | |
| [52] | |
| [53] | |
| [54] | |
| [55] | |
| [56] | |
| [57] | |
| [58] | |
| [59] | |
| [60] | |
| [61] | |
| [62] | |
| [63] | |
| [64] | |
| [65] | |
| [66] | |
| [67] | |
| [68] | |
| [69] |