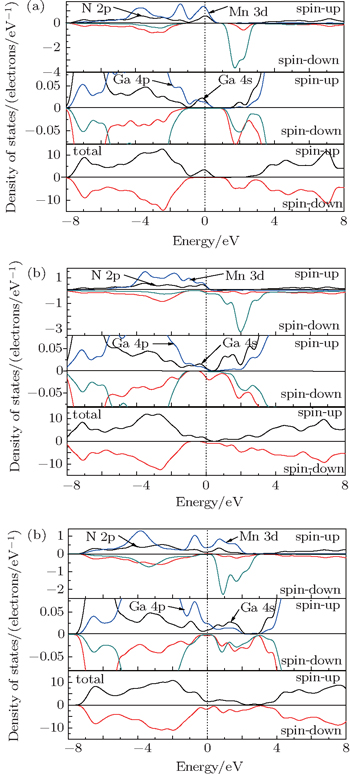
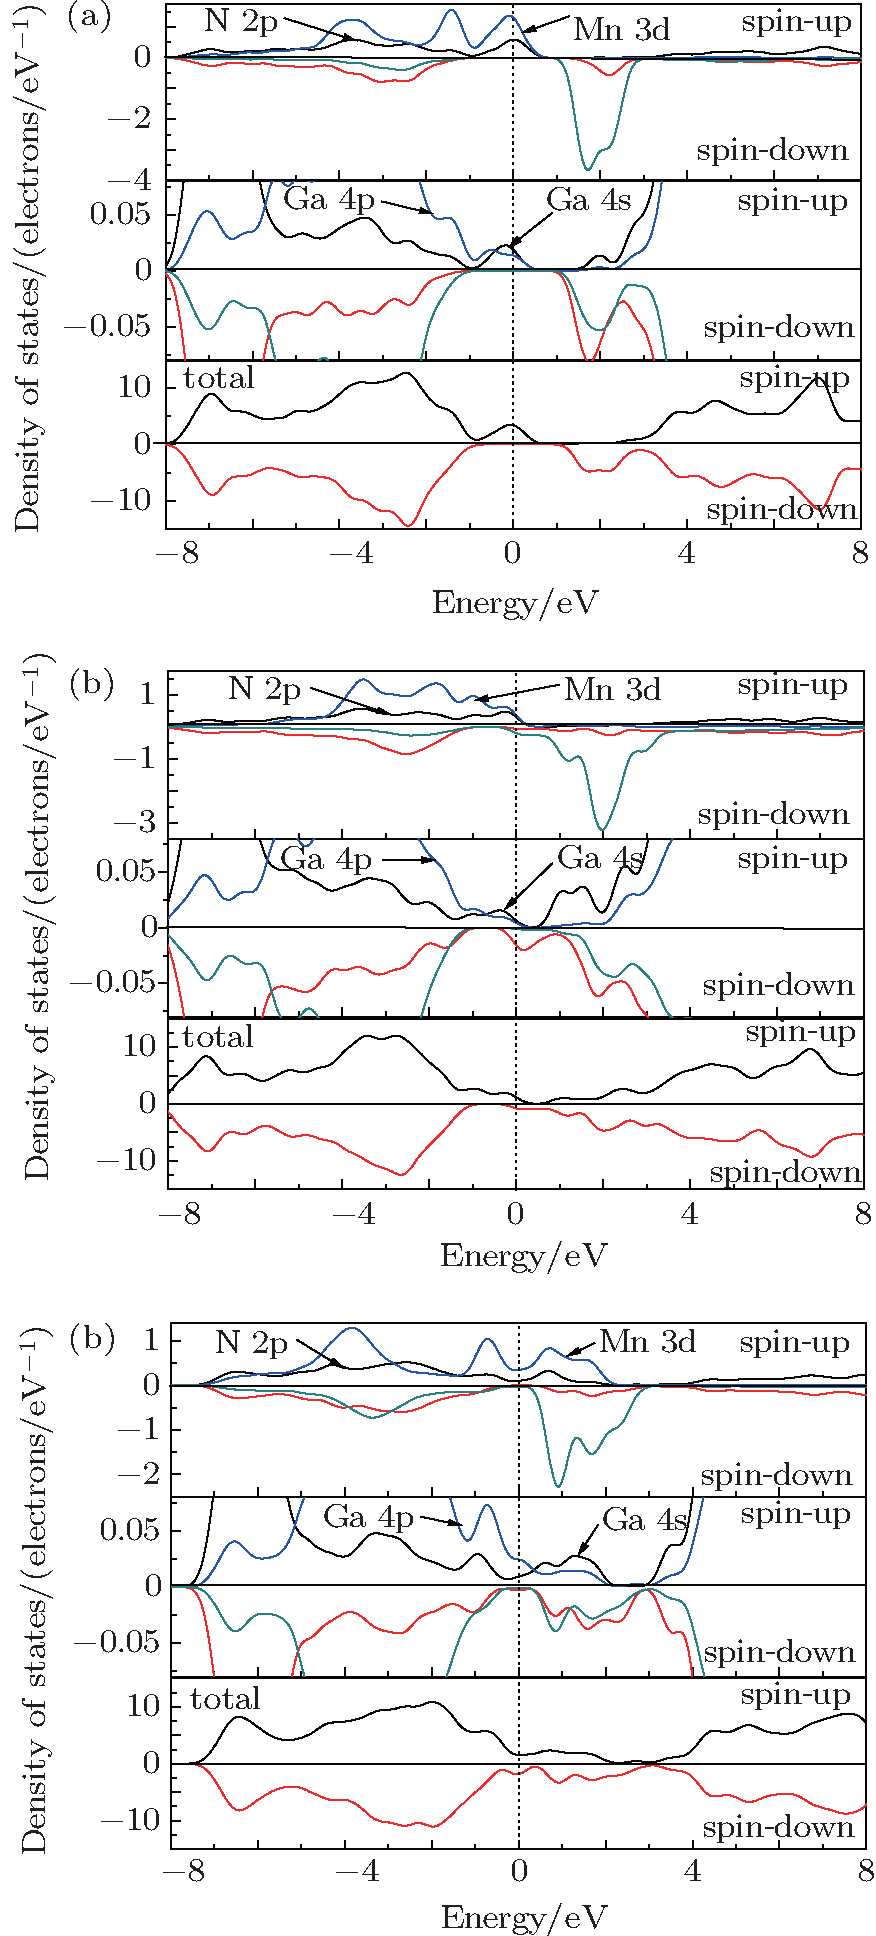
Role of vacancy-type defects in magnetism of GaMnN
Xing Hai-Ying1, 2, Chen Yu2, Ji Chen3, Jiang Sheng-Xiang3, Yuan Meng-Yao2, Guo Zhi-Ying2, †, , Li Kun2, Cui Ming-Qi2, ‡, , Zhang Guo-Yi3, §,
School of Electronics and Information Engineering, Tianjin Polytechnic University, Tianjin 300387, China
Institute of High Energy Physics, Chinese Academy of Sciences, Beijing 100049, China
Research Center for Wide-band Semiconductors, Peking University, Beijing 100871, China


† Corresponding author. E-mail: zyguo@ihep.ac.cn

‡ Corresponding author. E-mail: cuimq@ihep.ac.cn

§ Corresponding author. E-mail: gyzhang@pku.edu.cn

Project supported by the National Natural Science Foundation of China (Grant Nos. 61204008, 11075176, and 11505211) and the National Key Basic Research Special Foundation of China (Grant No. 2013CB328705).

Abstract
Abstract

Role of vacancy-type (N vacancy (VN) and Ga vacancy (VGa)) defects in magnetism of GaMnN is investigated by first-principle calculation. Theoretical results show that both the VN and VGa influence the ferromagnetic state of a system. The VN can induce antiferromagnetic state and the VGa indirectly modify the stability of the ferromagnetic state by depopulating the Mn levels in GaMnN. The transfer of electrons between the vacancy defects and Mn ions results in converting Mn3+ (d4) into Mn2+ (d5). The introduced VN and the ferromagnetism become stronger and then gradually weaker with Mn concentration increasing, as well as the coexistence of Mn3+ (d4) and Mn2+ (d5) are found in GaMnN films grown by metal–organic chemical vapor deposition. The analysis suggests that a big proportion of Mn3+ changing into Mn2+ will reduce the exchange interaction and magnetic correlation of Mn atoms and lead to the reduction of ferromagnetism of material.

PACS: 75.50.Pp;63.20.dk;67.80.dj
1. Introduction

Diluted magnetic semiconductors (DMSs) have attracted a lot of attention due to their potential applications in spintronic technology.[1] Among the DMS materials, GaMnN is of particular interest and increasingly studied.[2] However, its potential applications remain far from being fulfilled as various experiments, which leads to controversial conclusions concerning the ferromagnetism in GaMnN.[29] Moreover, although Mn is known as forming deep acceptor levels located in the band gap of GaN, the electronic structure and valence states of Mn ions are still controversial,[1013] and the origin of experimentally observed ferromagnetism is still not fully understood. In our previous experimental studies,[9,1417] we observed the presence of N vacancy (VN) with the Mn concentration increasing and analyzed the coexistence of Mn3+ and Mn2+ in a GaMnN sample. The understanding of magnetism of GaMnN requires more knowledge of vacancy-type defects and their interactions with the Mn ions. Since current experimental studies cannot resolve the structure and properties of defects to an atomic level, theoretical calculation is a valuable complementary method, because it allows the investigations of the geometry and electronic properties of defects in relative isolation.

Some theoretical studies showed that the Ga vacancy (VGa) gives rise to ferromagnetism in the GaN system.[18,19] However, Mahadevan and Mahalakshmi found that the presence of VGa can destroy the ferromagnetic state in Mn-doped GaN.[20] For N vacancies (VN), few investigations have been performed on the effects of VN on valence states of Mn ions and magnetism in GaMnN. In this paper, first-principle calculations coupled with zero-field-cooled (ZFC) and field-cooled (FC) MT measurements, are carried out to investigate the changes of the electronic structure and valence states of Mn ions and magnetic properties with the presence of vacancy defects in GaMnN, and to further understand our previous experimental results. In addition, more knowledge of microscopic behavior may be helpful in further progress in the understanding and engineering of the GaMnN.

2. Calculation details

Our calculation is based on a 32-atom supercell model. The atomic positions and the unit-cell parameters are allowed to relax to the minimum energy configuration to investigate a variety of configurations of Ga15MnN16 (one substitutional Mn atom), Ga15MnN15 (one substitutional Mn atom and one VN), Ga14MnN16 (one substitutional Mn atom and one VGa), Ga14Mn2N15 (two substitutional Mn atoms and one VN), and Ga13Mn2N15 (two substitutional Mn atoms and one VGa). Then, via calculating the system total energy, we choose the stablest structures to study their electronic structures and magnetic properties. Two typical structures are shown in Fig. 1.

Fig. 1. Model structures of (a) GaMnN: VN and (b) GaMnN: VGa.

All the structure optimizations and density functional theory calculations are performed with the plane-wave pseudopotential method.[21] The Perdew–Burke–Ernzerhof (PBE) exchange–correlation functional under general gradient approximation (GGA) and ultrasoft pseudopotential (Usp) are used to describe the interactions between the valence electrons and the doped ions. The plane-wave cut-off energy is set to be 400 eV, other calculation parameters and calculation steps have been reported in Refs. [22] and [23]. The calculation accuracy has also been evaluated in Refs. [22] and [23].

3. Experimental details

The examined samples here were prepared by metal-organic chemical vapor deposition (MOCVD). The details of the growth conditions have been presented elsewhere.[24] Trimethylgallium (TMGa) and ammonia were used as gallium and nitrogen sources. Bis (monomethycyclopentadienyl) manganese ((MCp)2Mn) was used as a dopant source during the growth of GaMnN films. The Mn concentration of the GaMnN film was controlled by varying the ratio between the molar flow rates of Mn and Ga flowing into the reactor. In this paper, the samples denoted as A, B, and C were fabricated at doping concentration x values of 0.75%, 1.8%, and 2.0%, respectively. Our previous experimental results indicated that no second phase related to Mn was observed for the GaMnN sample in the ω−2θ scan curve and the samples were still long-range lattice ordering and symmetric after GaN had been doped with Mn, which identified that Mn occupied the Ga site in the GaMnN sample.[24,25] The dependences of magnetization on temperature and magnetic-field are investigated using a superconducting quantum interface device magnetometer (SQUID). ZFC and FC MT curves are obtained at temperatures ranging from 5 K to 400 K in an applied field of 200 Oe (1 Oe = 79.5775 A·m−1).

4. Results and discussion
4.1. Calculation results and discussion

To better understand the effects of vacancy-type defects on electronic structure and magnetic properties of GaMnN, some of the main details of Mn-doped GaN are recounted here, which has been studied previously.[22] The total and partial density of state of GaMnN are shown in Fig. 2(a). It can be seen that the Mn 3d states have been split into doublet e and pseudotriplet t2 states due to the crystal field. Mn replaces Ga in Ga3+N3−, Mn has a d4 configuration and its level lies in the middle of the gap, so the Fermi level (EF) is located in the t2 state of the Mn level which is partially filled, and the spin-polarized is induced at EF. The impurity level around EF mainly originates from the hybridization between Mn 3d and N 2p states with a small contribution of Ga sp states, such hybridization interaction mediates the magnetic interaction.[26] The total magnetic moment of 4.00 μB also mainly originates from Mn atom (3.96 μB) as shown in Table 1. The Mn atom induces the neighboring N atom with a magnetic moment of −0.12 μB, which further leads to a 0.08 μB of the surrounding Ga atom.

Fig. 2. Total and partial densities of states for (a) GaMnN, (b) GaMnN:VN and (c) GaMnN:VGa. The upper half for each panel is for spin-up and the other for spin-down.
Table 1.

Values of magnetic exchange parameter J, and magnetic moment M of Mn and its neighboring Ga and N for the lowest energy structures.

.

Compared with density of states of GaMnN, the partial density of states of Mn 3d electrons has obvious change with the introduction of vacancy defects, and then the total densities of states of these systems have been significantly modified. Figure 2(b) shows the total and partial densities of states of GaMnN:VN. As mentioned above, for GaMnN, the EF is located in the t2 state of the Mn band which is partially filled. The high-lying N vacancy state is higher than that of the Mn level.[27] The extra electrons provided by VN must transfer to the Mn states. The EF shifts toward the conduction band and the t2 state is completely filled. This electron transfer changes the d4 (Mn3+) configuration into d5 (Mn2+) configuration and results in forming neutral Mn–VN complex. The spin-polarized states around EF are significantly reduced, mobile holes and itinerant electrons decrease, the difference in density of states between spin up and down states decreases, which implies that the exchange interaction is reduced in such a system. The total magnetic moment in the cell is 4.87 μB, and almost all of the magnetic moment arises from the Mn atom (4.6 μB), consistent with a filled shell value of 5.0 μB. As discussed above, the VN gives the extra electrons to the system and the t2 state is completely filled, so the moment in the cell all comes from the Mn atom. The magnetic exchange interaction parameter J is calculated. J is the energy gain per Mn atom comparing the ferromagnetic (FM) and antiferromagnetic (AFM) state configuration, so it is defined J = (EAFMEFM)/2 which makes J positive for a ferromagnetic ground state.[28] The magnetic exchange interaction parameter J is listed in Table 1. The ferromagnetic state is stable with J being 89.5 meV (J > 0) in GaMnN. The presence of VN changes J from positive to negative, indicating that an antiferromagnetic ground state is favored with J ∼ −70.95 meV (J < 0). Because the additional electrons provided by VN change the d4 (Mn3+) to the filled d5 (Mn2+), the double exchange interaction decreases and antiferromagnetic superexchange becomes dominant.

Figure 2(c) shows the variations of the total and partial density of states with VGa. When a VGa is introduced into GaMnN, since the acceptor levels of VGa are lower than Mn levels in GaN,[19] electrons are transferred from the Mn states to VGa. This charge transfer significantly lowers the Mn 3d states, and EF shifts towards the valence band. The depopulation of the Mn states reduces the exchange splitting of Mn states. As a result, the exchange interaction is reduced considerably and the ferromagnetic state is destroyed. The small spin polarization arising from N 2p could be due to the interaction with Mn states. The magnetic moment in GaMnN:VGa is reduced, being 2.00 μB for the Mn atom, and being 3.26 μB for the total moment. The magnetic moment on the N atoms surrounding VGa is reverse (−0.38 μB). From the calculated J, we find that the VGa does not change the nature of magnetic coupling, which has a J ∼ 17 meV significantly smaller than that of GaMnN. However, the VGa indirectly modifies the stability of the ferromagnetic state by depopulating the Mn levels.

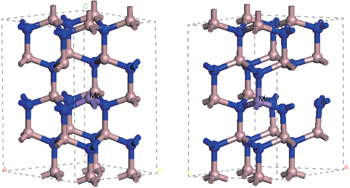
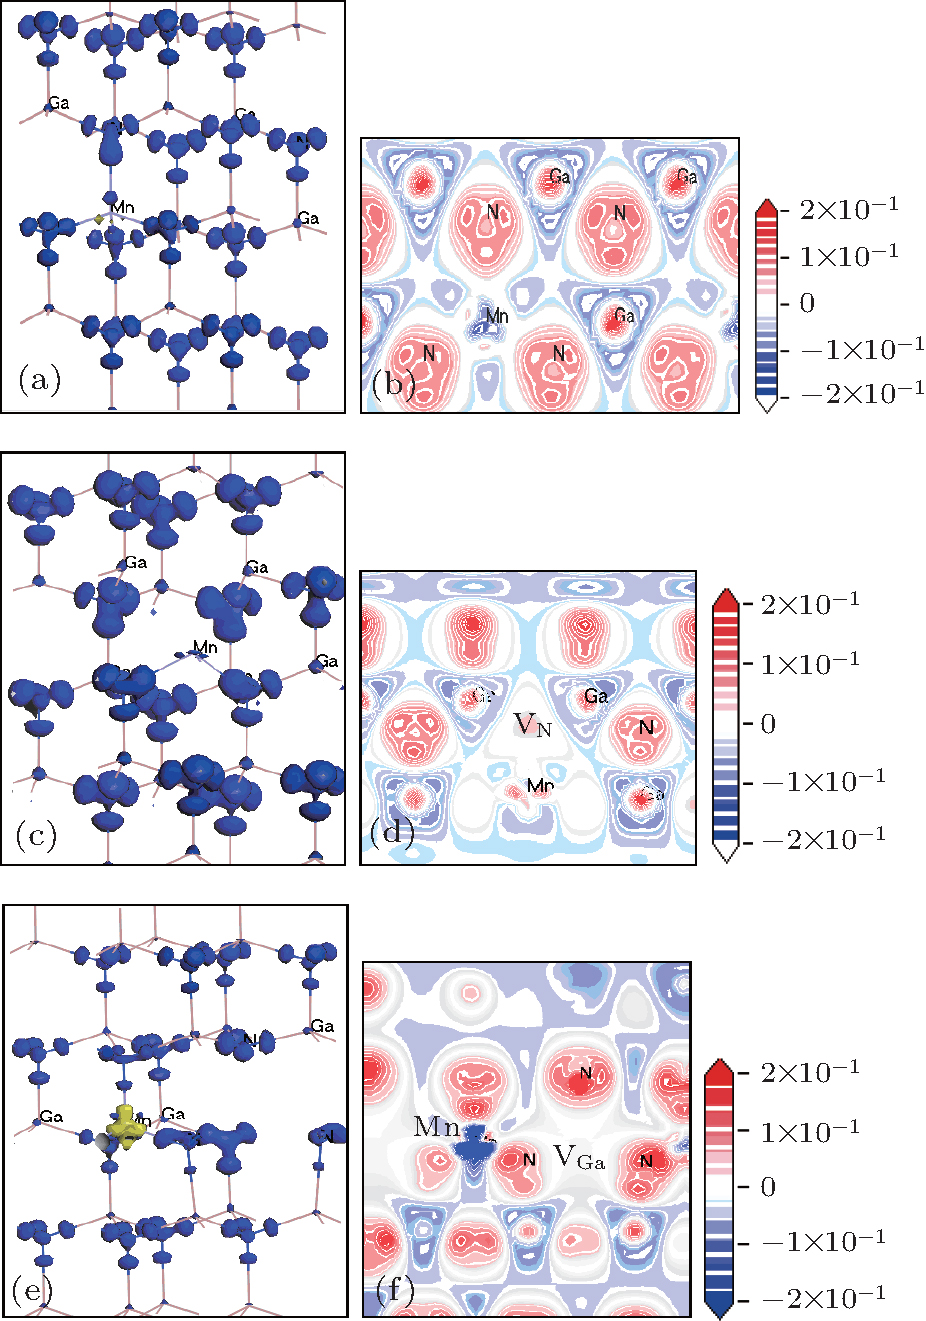
To investigate the charge transfers with the introduction of vacancy-defects in systems, we examine their electron density differences in Fig. 3. Figures 3(a) and 3(b), 3(c) and 3(d), and 3(e) and 3(f) correspond to GaMnN, GaMnN:VN, and GaMnN:VGa, respectively. Figures 3(d) and 3(f) show the corresponding two-dimensional distributions of the electron density on the plane passing through a vacancy and the nearest atoms around the vacancy. Compared with in GaMnN as shown in Fig. 3(a), the electron density increases around the Mn site in GaMnN:VN as shown in Fig. 3(c), while the electron density decreases around the Mn site in GaMnN:VGa as indicated in Fig. 3(e). In Figs. 3(b), 3(d), and 3(f), the electron densities are all linearly scaled in a color spectrum from red for the maximum electron density to blue for the minimum, and the white color represents the zero electron density. As shown in Figs. 3(b) and 3(d), the color around the Mn site changes from blue (in GaMnN) to red (in GaMnN:VN), and the color around the nearest-neighbor N site of Mn changes from red to white in the presence of VN. It suggests that the electrons transfer from the VN to the Mn ions. While in Fig. 3(f) (in GaMnN:VGa), the electron densities of the Mn site and the VGa are in the blue color for the minimum and the white color for zero, respectively, compared with those of the Mn site and the corresponding Ga site in Fig. 3(b). It indicates that the electrons transfer from the Mn ions to the VGa. That is, the electron accumulation and depletion suggest that the electrons transfer between Mn ions and the vacancy defects.

Fig. 3. Electron density differences for three systems: (a) and (b) GaN:Mn, (c) and (d) GaMnN:VN, and (e) and (f) GaMnN:VGa. In panels (a), (c), and (e), blue and yellow represent the electron density increase and decrease, respectively; in panels (b), (d), and (f), red and blue represent the electron accumulation and depletion, respectively).

Our previous work[14] and Obloh et al.[29] found that VN was likely to form under the higher growth temperature condition of MOCVD, and that our work identified it as VN-MnGa complex.[14] Moreover, our photoluminescence experiment[17] found that the intensity of yellow band (YL) bands decreased with the increase of Mn concentration in the sample, which was attributed to VGa.[30,31] This result indicates that the VGa concentration will decrease with the increase of Mn concentration in the sample. Another reason is that Mn replaces Ga sites in the GaMnN sample.[32] Our considerations thus should be focused on the VN.

As mentioned above, the presence of VN changes the Mn3+ (d4) configuration in GaMnN. Theoretical study has shown that the Mn–N bond length linearly decreases with the number of the d (Mn) electrons decreasing, which is due to the decreasing of Coulomb repulsion with the nearest N anions. The d (Mn) obtains electrons and Mn3+ (d4) change into Mn2+ (d5), so that the Coulomb repulsion between Mn and the nearest N anions increases. Hence, the calculated equilibrium Mn–N bond length increases from 1.94 to 2.01, the variation of the charge state changes the bond lengths by about 3.6%.[33] In this paper, the calculated values of Mn—N bond length are 1.992 Å and 2.054 Å in GaN:Mn and GaMnN:VN system, respectively, which shows that the bond length increases about 3.1%, which is in agreement with the result in Ref. [33]. The results of the density of state, charge density difference, and the calculated values of the Mn–N bond length, jointly indicate that there appears the Mn2+ (d5) in GaMnN system with the increase of VN, despite Mn replacing Ga in Ga3+N3−. Our previous experiment also found that the Mn3+ (d4) and Mn2+ (d5) coexisted in the sample.[17]

4.2. Experimental results and discussion

In order to further investigate the VN effects on magnetic properties of the GaMnN thin films, the dependences of magnetization on temperature and magnetic-field are measured by using SQUID. The measurements are performed under ZFC and FC conditions with an applied field of 200 Oe parallel to the film surface.
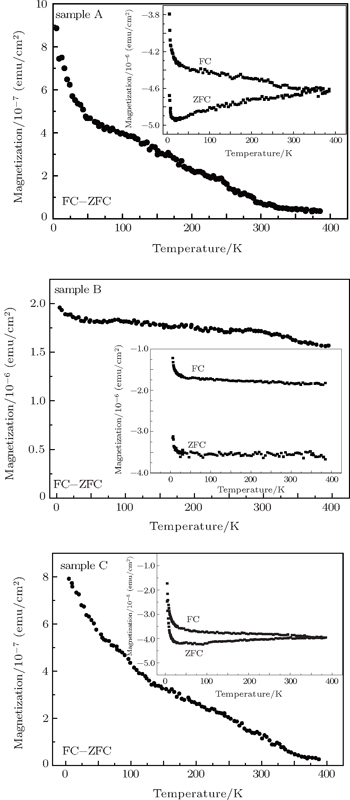
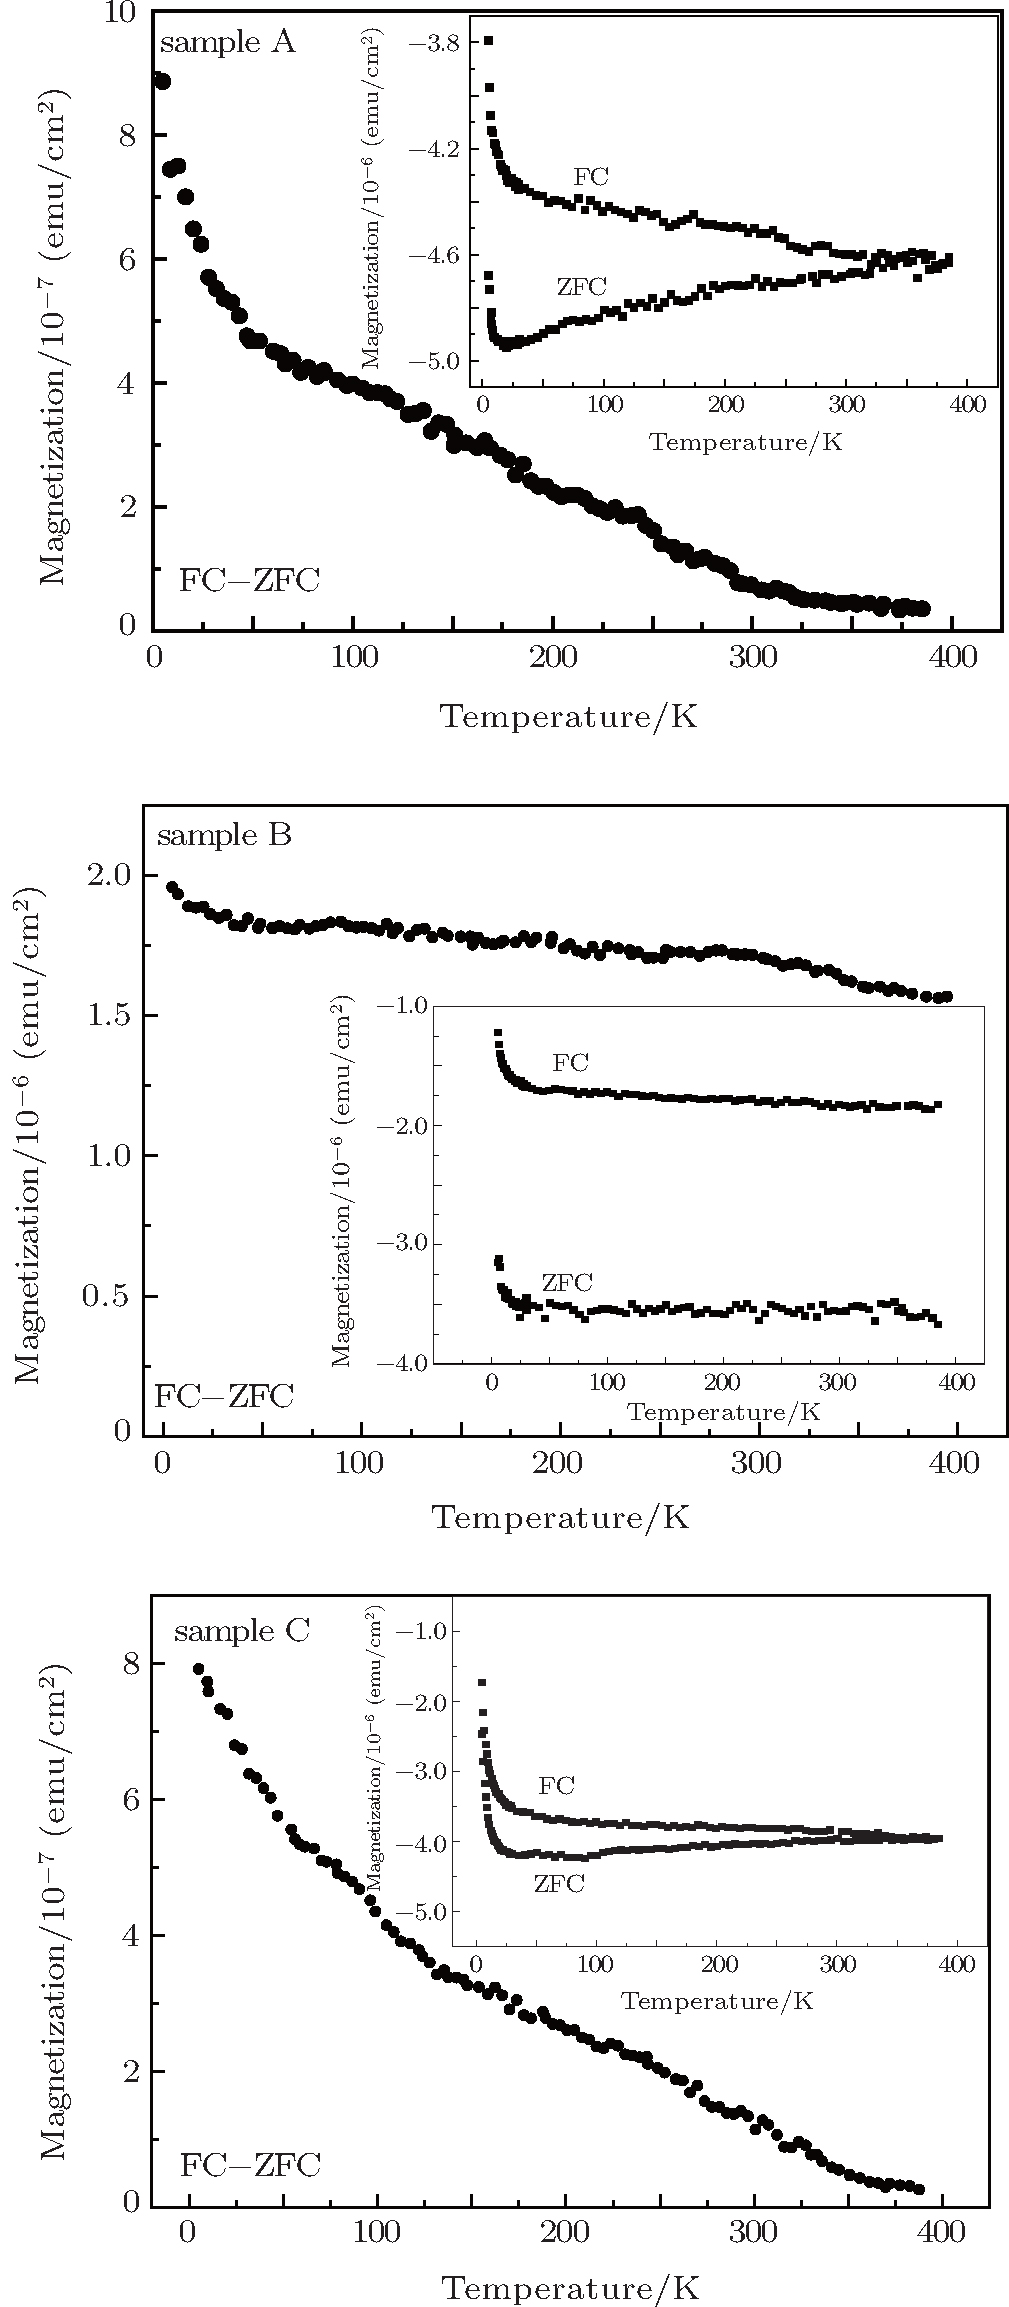
Figure 4 shows the ZFC and FC MT curves and the temperature dependent magnetization curves of the difference (ΔM) between the FC and ZFC magnetizations of the three GaMnN samples. By taking the difference between FC and ZFC, the para- and diamagnetic contributions to the magnetization can be subtracted, leaving only a measure of the hysteretic ferromagnetic regime.[34] The temperature dependences of the difference between FC and ZFC for samples A, B, and C are plotted in the main part of Fig. 4. In Fig. 4, the ΔMs for each of the three samples still displays a nonzero magnetization above room temperature. Therefore, all of the samples exhibit that the ferromagnetism still holds above room temperature. The magnetization for each of the GaMnN samples decreases continuously with the increase of temperature in the whole temperature range (from 5 K to 400 K) and there is no discontinuous change in the curve. Moreover, the magnetization of sample B decreases very slowly with the increase of temperature and remains even at 400 K. A comparison of ΔM among the three samples at 5 K reveals that ΔM increases from 8.86×10⁻⁷ emu/cm2 to 1.96×10⁻⁶ emu/cm2 as the Mn concentration increases from 0.75% to 1.8% and then decreases to 7.91×10⁻⁷ emu/cm2 as the Mn concentration increases further to 2.0%. In addition, as can be seen in the insets of Fig. 4, the divergence between the ZFC and FC curves becomes greater and then smaller as the Mn concentration increases, the ZFC and FC curves of the sample C with 2.0% Mn overlap each other in the low-temperature region. These findings show that the ferromagnetism of the GaMnN film becomes stronger and then gradually weaker as the Mn concentration increases.

Fig. 4. Temperature dependences of the difference between FC and ZFC in magnetization for samples A, B, and C. The inset of each panel shows ZFC–FC curves.
5. Conclusions

In this work, through the first principle calculation, we can infer that the VN or VGa existing in GaMnN influences the ferromagnetic state of the system. The VN can induce an antiferromagnetic state and the VGa indirectly modifies the stability of the ferromagnetic state by depopulating the Mn levels in GaMnN. The additional electrons provided by VN change the d4 (Mn3+) into the filled d5 (Mn2+), the double exchange interaction decreases and antiferromagnetic superexchange becomes dominant. Our previous experiment found that the VN was introduced with Mn concentration increasing and the Mn3+ (d4) and Mn2+ (d5) coexisted in the sample.[14,28] In the present study, the analyses of the ZFC and FC data show that the ferromagnetism of the GaMnN film becomes stronger and then gradually weaker with Mn concentration increasing. Thus, due to the presence of VN, a big proportion of Mn3+ changing into Mn2+ will reduce the exchange interaction and magnetic correlation of Mn atoms, leading to the reduction of ferromagnetism of material. It turns out that the additional VN changes the valence state of Mn ions, which is one of the reasons influencing the magnetic properties of GaMnN. The above analysis suggests that the position of EF and the relative position of Mn levels influence the magnetism of film, while their position closely depends on the optimum growth condition. Perhaps, just the difficulty in controlling the optimum growth conditions in experiment leads to various experimental results in GaMnN. Our work may be helpful for further understanding our previous experimental results and the origin of ferromagnetism in GaN-based diluted magnetic semiconductors.

Reference
1Žutić IFabian JSarma S D 2004 Rev. Mod. Phys. 76 323
2Nelson RykyBerlijn TomMoreno JuanaJarrell MarkKu Wei 2015 Phys. Rev. Lett. 115 197203
3Chen DDing ZYao SHua WWang KChen T 2008 Nucl. Instrum. Methods Phys. Res. Sect. 266 2797
4Granville SRuck B JBudde FTrodahl H JWilliams G V M 2010 Phys. Rev. 81 184425
5Stefanowicz SKunert GSimserides CMajewski J AStefanowicz WKruse CFigge S 2013 Phys. Rev. 88 081201
6Thaler G TOverberg M EGila BFrazier RAbernathy C RPearton S J 2002 Appl. Phys. Lett. 80 3964
7Kim K HLee K JKim D JKim H JIhm Y EDjayaprawira DTakahashi MKim C SKim C GYoo S H 2003 Appl. Phys. Lett. 82 1775
8Kane M HAsghar AVestal C RStrassburg MSenawiratne JZhang Z JDietz NSummers C JFerguson I T 2005 Semicond. Sci. Technol. 20 L5
9Yang X LWu J JChen Z TPan Y BZhang YYang Z JYu T JZhang G Y 2007 Solid State Commun. 143 236
10Jiang X ZYang X LJi CXing H YYang Z JWang C DYu T JZang G Y 2014 Chin. Phys. Lett. 31 067501
11Kunert GDobkowska STian LiReuther HKruse CFigge SJakiela R 2012 Appl. Phys. Lett. 101 022413
12Boukortt AHayn RVirot F 2012 Phys. Rev. 85 033302
13Pereira L M CWahl UCorreia J GDecoster SAmorim L Mda Silva M R 2012 Phys. Rev. 86 195202
14Yang X LZhu WWang C DFang HYu T JYang Z J.Zhang G YQin X BYu R SWang B Y 2009 Appl. Phys. Lett. 94 151907
15Yang X LChen Z TZhao L BZhu W XWang C DPei X DZhang G Y 2008 J. Phys. D: Appl. Phys. 41 245004
16Yang X LChen Z TWang C DHuang SFang HYang Z JChen D LYan W S 2008 J. Phys. D: Appl. Phys. 41 125002
17Xing H YXu Z CCui M QXie Y XZhang G Y 2014 Chin. Phys. 23 107803
18Dev PratibhaXue YuZhang Peihong 2008 Phys. Rev. Lett. 100 117204
19Kuang AnlongYuana HongkuanChena Hong 2010 Appl. Surf. Sci. 256 6040
20Priya MahadevanMahalakshmi S 2006 Phys. Rev. 73 153201
21Segall Lindan M DProbet P 2002 J. Phys.: Condens. Matter 14 2717
22Xing H YFan G HZhao D GHe MZhang YZhou T M2008Acta Phys. Sin.576513(in Chinese)
23Xing H YFan G HZhang YZhao D G2008Acta Phys. Sin.57450(in Chinese)
24Xing H YFan G HYang X LZhang G Y2010Acta Phys. Sin.59504(in Chinese)
25Xing H YNiu P JXie Y X 2012 Chin. Phys. 21 077801
26Sluiter M H FKawazoe YSharma PInoue ARaju RRout A CWaghmare U V 2005 Phys. Rev. Lett. 94 187204
27Li Y LFan W LSun H GCheng X FLi PZhao XJiang M H 2010 J. Solid State Chem. 183 2662
28Larson PSatpathy S 2007 Phys. Rev. 76 245205
29Obloh HBachem K HKaufmann UKunzer MMaier MRamakrishnan ASchlotter P 1998 J. Cryst. Growth 195 270
30Neugebauer JVan de Walle C G 1996 Appl. Phys. Lett. 69 503
31Saarinen KLaine TKuisma SNissila JHautojarvi PDobrzynski LBaranowski J MPakula KStepniewski RWojdak MWysmolek ASuski TLeszczynski MGrzegory IPorowski S 1997 Phys. Rev. Lett. 79 3030
32Gelhausen OMalguth EPhillips M RGoldys E MStrassburg MHoffmann AGraf TGjukic MStutzmann M 2004 Appl. Phys. Lett. 84 4514
33Bogusławski PBernholc J 2005 Phys. Rev. 72 115208
34Wang J QChen P PGuo X GLi Z FLu W 2005 J. Crystal Growth 275 393