

Density function theoretical study on the complex involved in Th atom-activated C–C bond in C2H6
[Wang Qing-Qing1, Li Peng2, Gao Tao1, †,  , Wang Hong-Yan3, Ao Bing-Yun4]
, Wang Hong-Yan3, Ao Bing-Yun4]


† Corresponding author. E-mail:
Project supported by the National Natural Science Foundation of China (Grant Nos. 21371160, 21401173, and 11364023).
Density functional theory (DFT) calculations are performed to investigate the reactivity of Th atom toward ethane C–C bond activation. A comprehensive description of the reaction mechanisms leading to two different reaction products is presented. We report a complete exploration of the potential energy surfaces by taking into consideration different spin states. In addition, the intermediate and transition states along the reaction paths are characterized. Total, partial, and overlap population density of state diagrams and analyses are also presented. Furthermore, the natures of the chemical bonding of intermediate and transition states are studied by using topological method combined with electron localization function (ELF) and Mayer bond order. Infrared spectrum (IR) is obtained and further discussed based on the optimized geometries.
Thorium has vast potential for the future development of application in nuclear power, which can supplement the shortage of the uranium resources effectively. In the application of the nuclear material, one of the challenges is the corrosive effect with environmental atmosphere, e.g. with water, oxygen, etc. Moreover, it is quite difficult to study the corrosive effect experimentally due to the virulence and radioactivity of Th atom. Therefore, it requires a reliable and accurate theoretical model to study the physical property of compounds involved in the process of corrosion.
Over the past few decades, reactions of actinide cations with the ordinary small molecules in the air have drawn considerable attention. The majority of these studies focused on analyzing the quite different electronic structures, the reactivity, and bonding of the actinide ions. Experimentally, Santo and Santos detected the following reaction products for the reaction of Th2+ with CH4:[1]


In addition, Li et al. studied many systems about the reactions of actinium (An = Th, U, Np, Pu, and relevant cation) with inorganic molecules including H2O and NH3[9–15] theoretically. They also obtained the similar mechanisms in all the studied reactions.
However, as far as we know, there are neither experimental data on the direct reaction of Th atom with C2H6 molecule nor theoretical studies on the geometries nor the topological analysis of the reaction products. The main objective of the present work is to give an insight into the reaction of Th atom with C2H6. The paper reports the molecular structures and topological analyses of all the intermediates involved in the activation process of C−C. The bonding evolution during the reaction pathways is investigated by Mayer bond order and electron localization function (ELF). We analyze the roles of 5f orbitals by means of total density of states (TDOS), partial density of states (PDOS) and overlap potential density of states (OPDOS).[16] In addition, the IR spectrum of the intermediate is investigated based on the optimized geometry.
All theoretical calculations were carried out with the Gaussian09 package[17] using density functional theory (DFT). The B3LYP[18–20] hybrid functional (Becke’s three-parameter hybrid functional with the Lee, Yang and Parr correlation functional) was adopted for all intermediate and transition states along the reaction pathways. To assess the veracity of the current calculation scheme, we also adopted other methods including pure GGA PW91,[21,22] the Meta-GGA TPSS,[23] the PBE0,[24] and PBE.[25] In all calculations the Stuttgart small-core relativistic effective core potential (RECP)[26] for Th atom was applied. The Stuttgart small-core RECP treated the 60 electrons in the inner core shells of thorium with pseudopotentials, and the valence shells by using a segmented contraction scheme of (5s5p5d5f6s6p6d7s). The split-valence shell Gaussian basis sets, 6-311++G(d,p),[27,28] were employed to handle C and H atoms in full optimization and frequency calculations (we refer to these results as B3LYP/SDD hereafter). The computational scheme was carried out successfully in a previous mechanism study of gas-phase actinide chemistry. All of the targeted structures were fully optimized in the gas phase, and the nature of special points was characterized by vibrational analysis to be either local minima or saddle points on the potential energy surface. We ensure that each transition state has only one imaginary frequency, and that this frequency is related to reactants and products by the intrinsic reaction coordinate (IRC) calculations. Because of the possibility of spin crossovers involved in the reaction pathways, we considered all possible spin states of Th (singlet, triplet, and quintet). We generally referred to this feature as two-state reactivity. We checked the 〈S2〉 values to evaluate whether spin contamination can influence the quality of the results. In all cases we found that the calculated values differ from S(S + 1) within less than 5%. IR spectra of intermediates were investigated based on the optimized geometries.
To obtain a full understanding of the nature of the bonding evolution along the reaction pathway, Mayer bond order[29] and ELF were performed with the Multiwfn[30] package. We replaced 6-311++G(d,p) with 6-311G(d,p) during the calculation of Mayer bond order because of the inaccuracy when there are diffusion functions. To understand the role of 5f electrons in the chemical bonds of thorium complexes, TDOS, PDOS, and OPDOS were calculated.
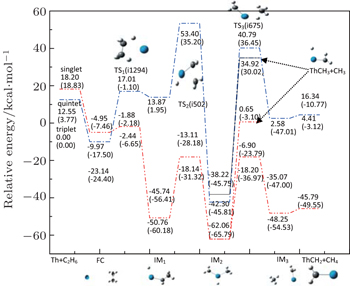
The reaction under study is involved in the C−C activation of Th + C2H6. The potential energy profile and the geometric structure corresponding to all of the intermediates and transition states involved in this system are shown in Fig.
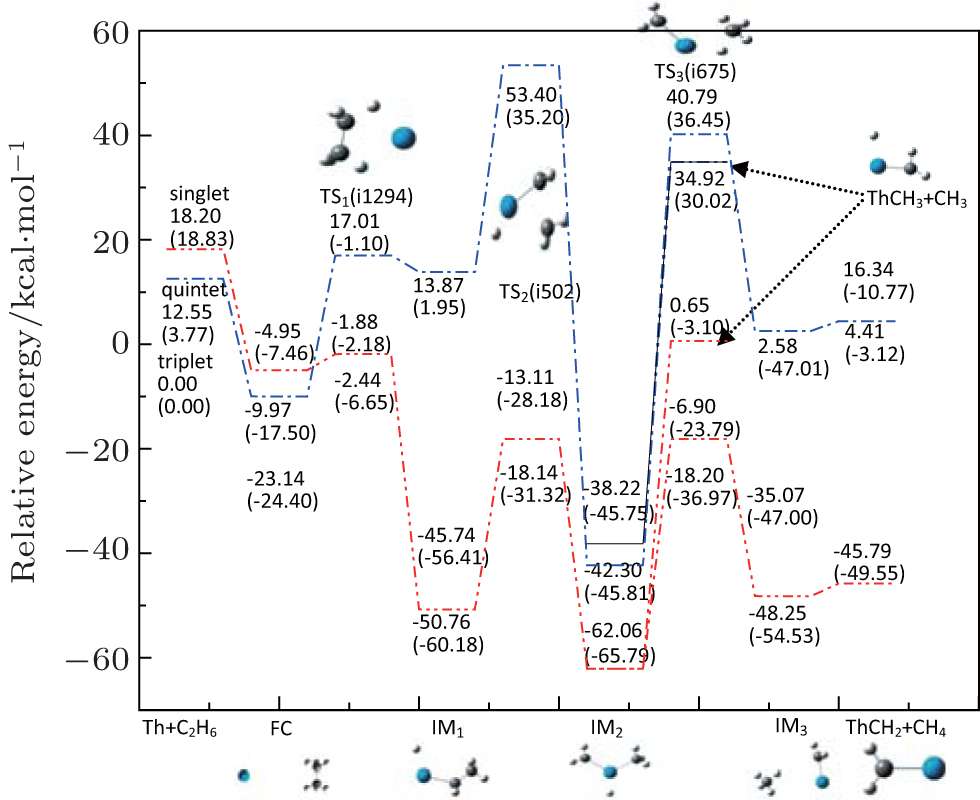 | Fig. 1. Geometric structures and potential energy profiles for the reaction of Th + C2H6, computed at the B3LYP/SDD and PW91/SDD (in parentheses) levels of theory. |
| Table 1. Activation barriers (kcal/mol) of the transition states. . |
From Fig.
For a system, when there are no experimentally determined structural parameters and energy values, it is important to study the system using different functionals to see whether they give consistent results. Therefore, in addition to the B3LYP/SDD and PW91/SDD levels of theory used in this study, we also investigate the potential energy surfaces at several other levels of theory, including the PBE0/SDD, PBE/SDD, BMK/SDD and TPSS/SDD. Table
| Table 2. Relative energies (kcal/mol) of the stationary points on the PathB potential energy surface. . |
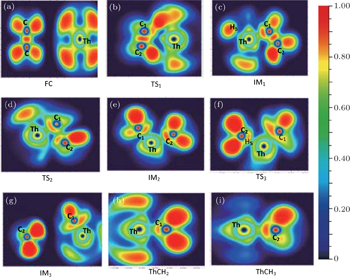
As previously mentioned, the bonding properties of all the species involved in the studied reaction pathways are investigated by using ELF function. The details of the analyses are as follows. The ELF projection figures of the compounds involved in the C−C activation are presented in Fig.
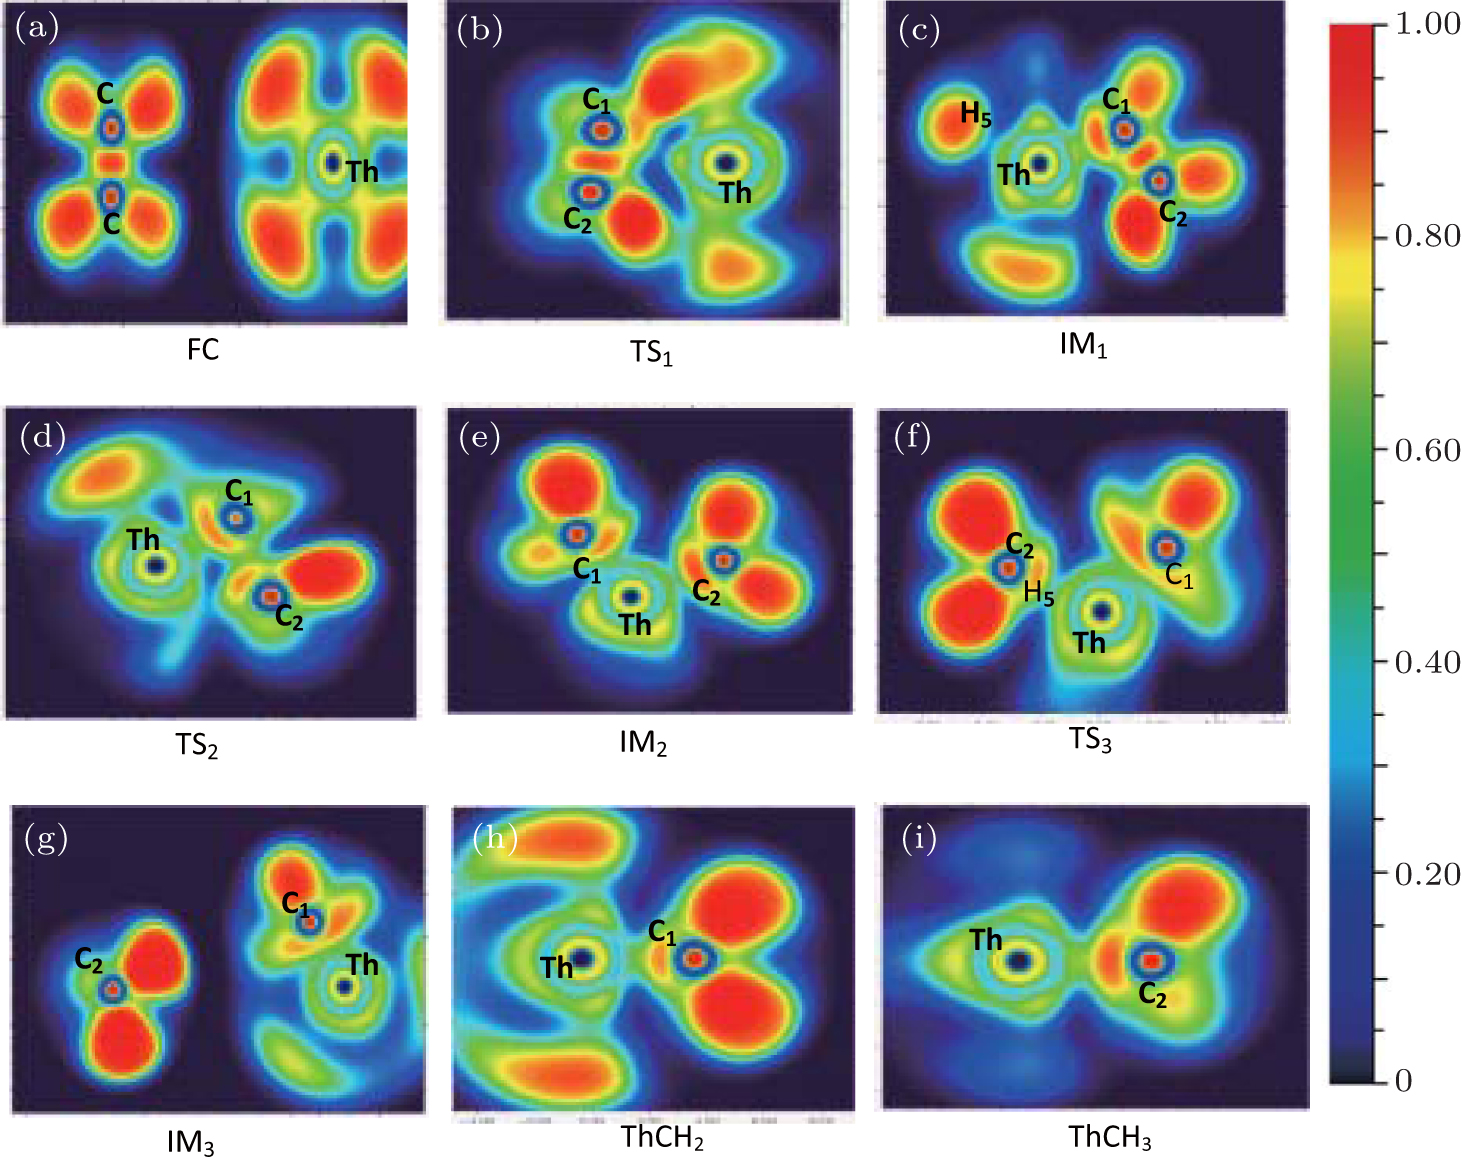 | Fig. 2. ELF projection map (η = 0.70) of stationary points on the C−C activation of TH + C2H6 reaction pathway at B3LYP/SDD level. |
In order to gain an in-depth understanding of the reaction mechanisms, we investigate the evolution of the bonds along the pathways using Mayer bond order. Figure
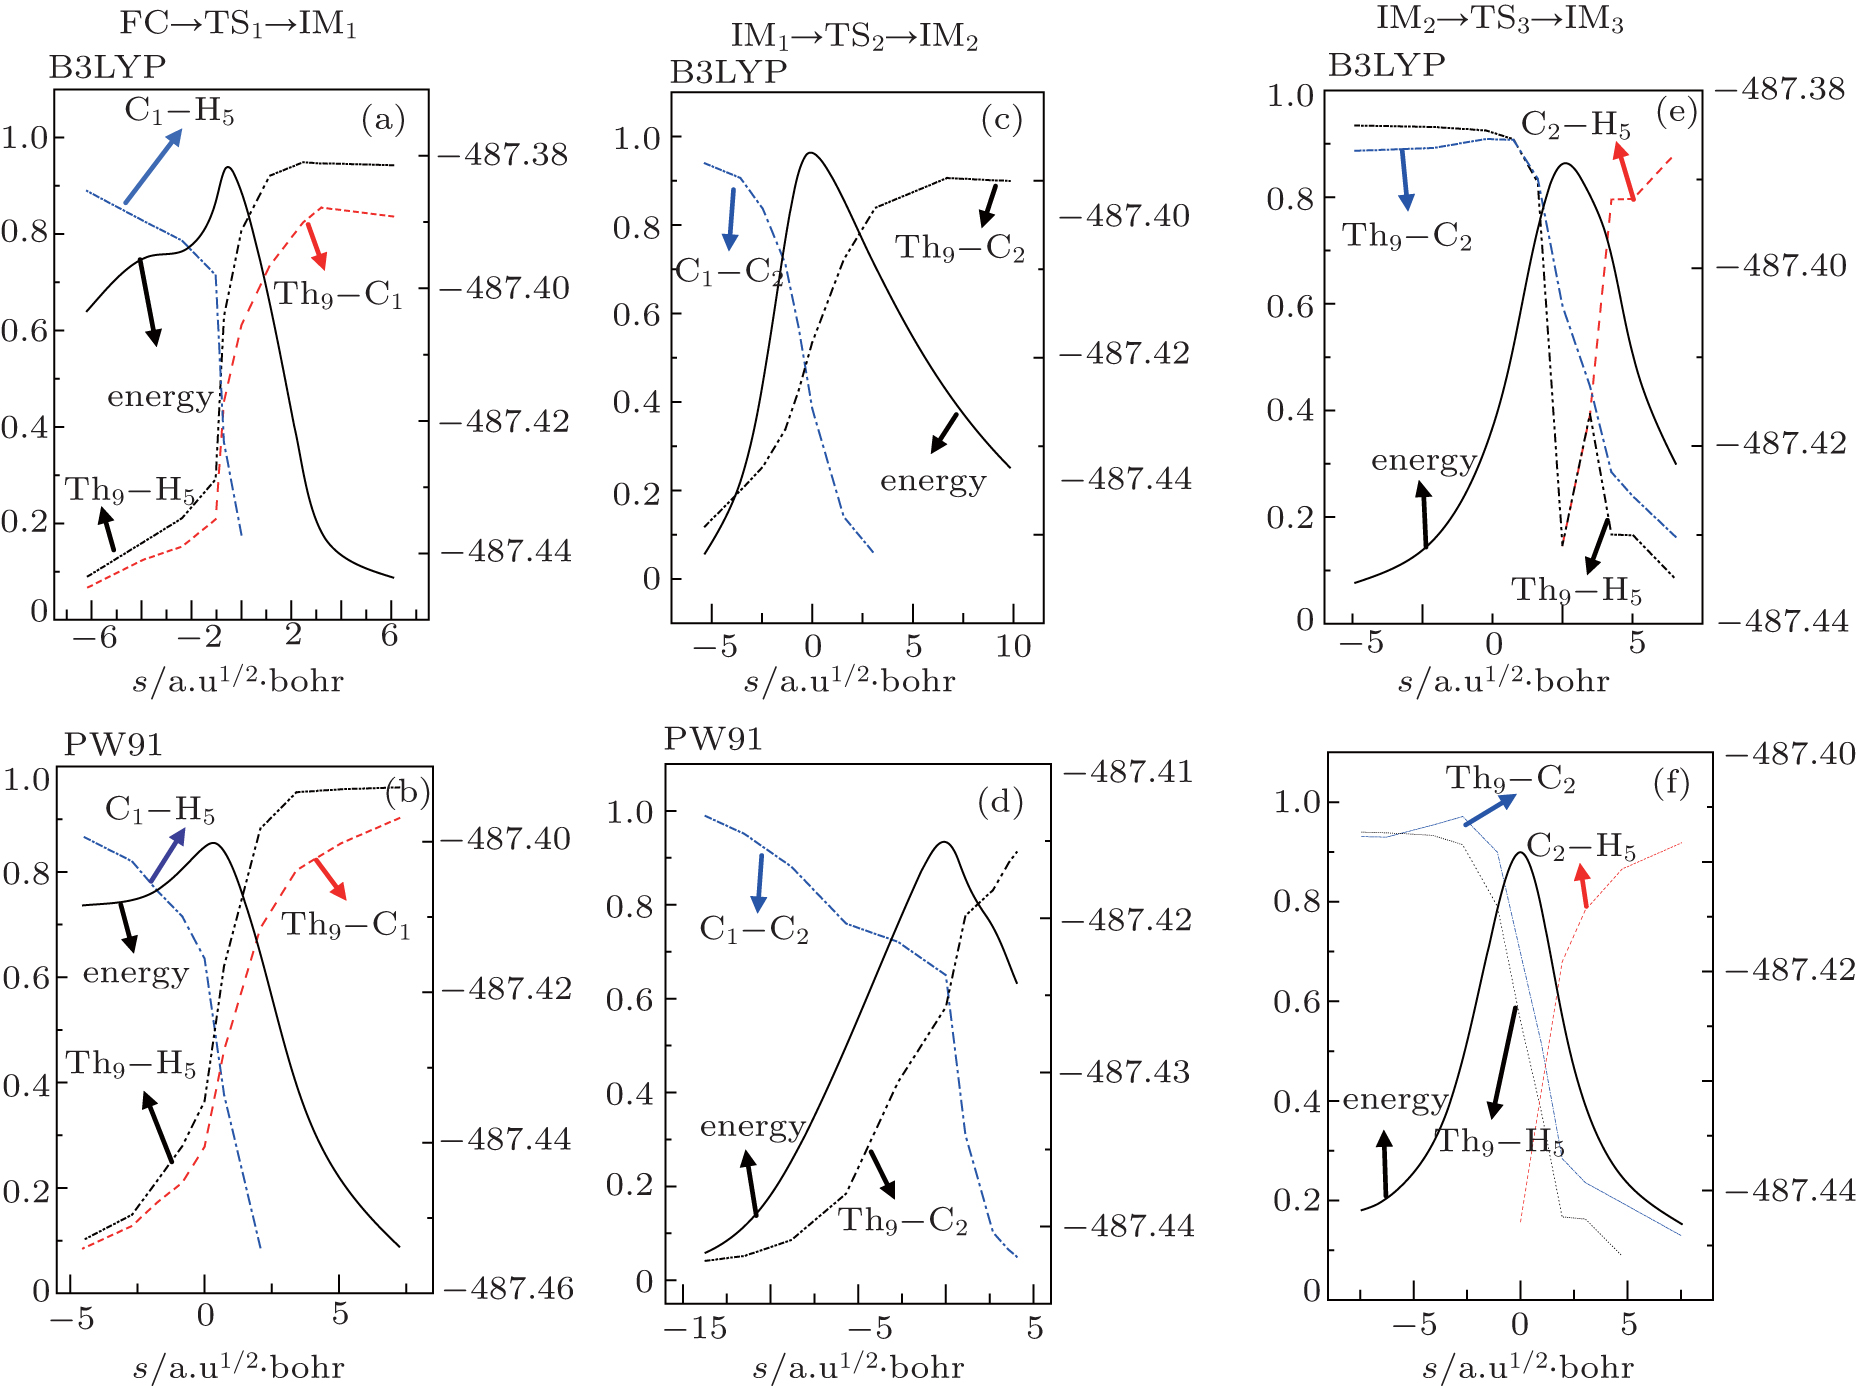 | Fig. 3. IRC energies and Mayer bond orders along the reaction coordinates, calculated at the B3LYP/SDD (above) and PW91/SDD (below) levels. Solid curves are for the energy, and dashed lines are for the Mayer bond order (the vertical axes represent the total energy/Hartree (right) and Mayer bond order (left), respectively). |
The solid lines represent total energy and the dashed lines represent different bonds in this pathway, respectively. From Figs.
As can be seen from Fig.
| Table 3. Mayer bond order analysis for all of the minima and transition states involved in the reaction of Th + C2H6 at the B3LYP/SDD level of theory. . |
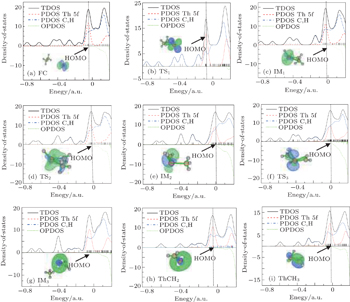
As is well known, the diffuse character of 5f orbitals, which are relatively spread out and close to the outermost 7s atomic valence orbital, may increase the size of the activation barrier.[31,32] To obtain more information about the roles that the 5f electrons and 5f orbitals play in thorium species, the TDOS, PDOS, and OPDOS are calculated. The TDOS, PDOS, and OPDOS drawings of all special points along the pathway are shown in Fig.
 | Fig. 4. The TDOS, PDOS, and OPDOS curves for all special points in the reaction of TH + C2H6 computed at the B3LYP/SDD levels of theory. |
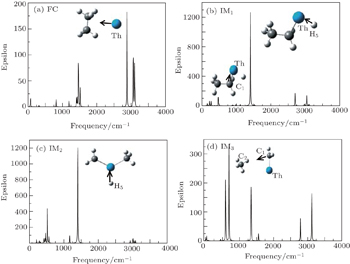
IR spectrum is an effective tool to identify the complexes based on the characteristic functional groups. The simulated infrared spectrum results of critical compounds (reactants, intermediates, and products) are shown in Fig.
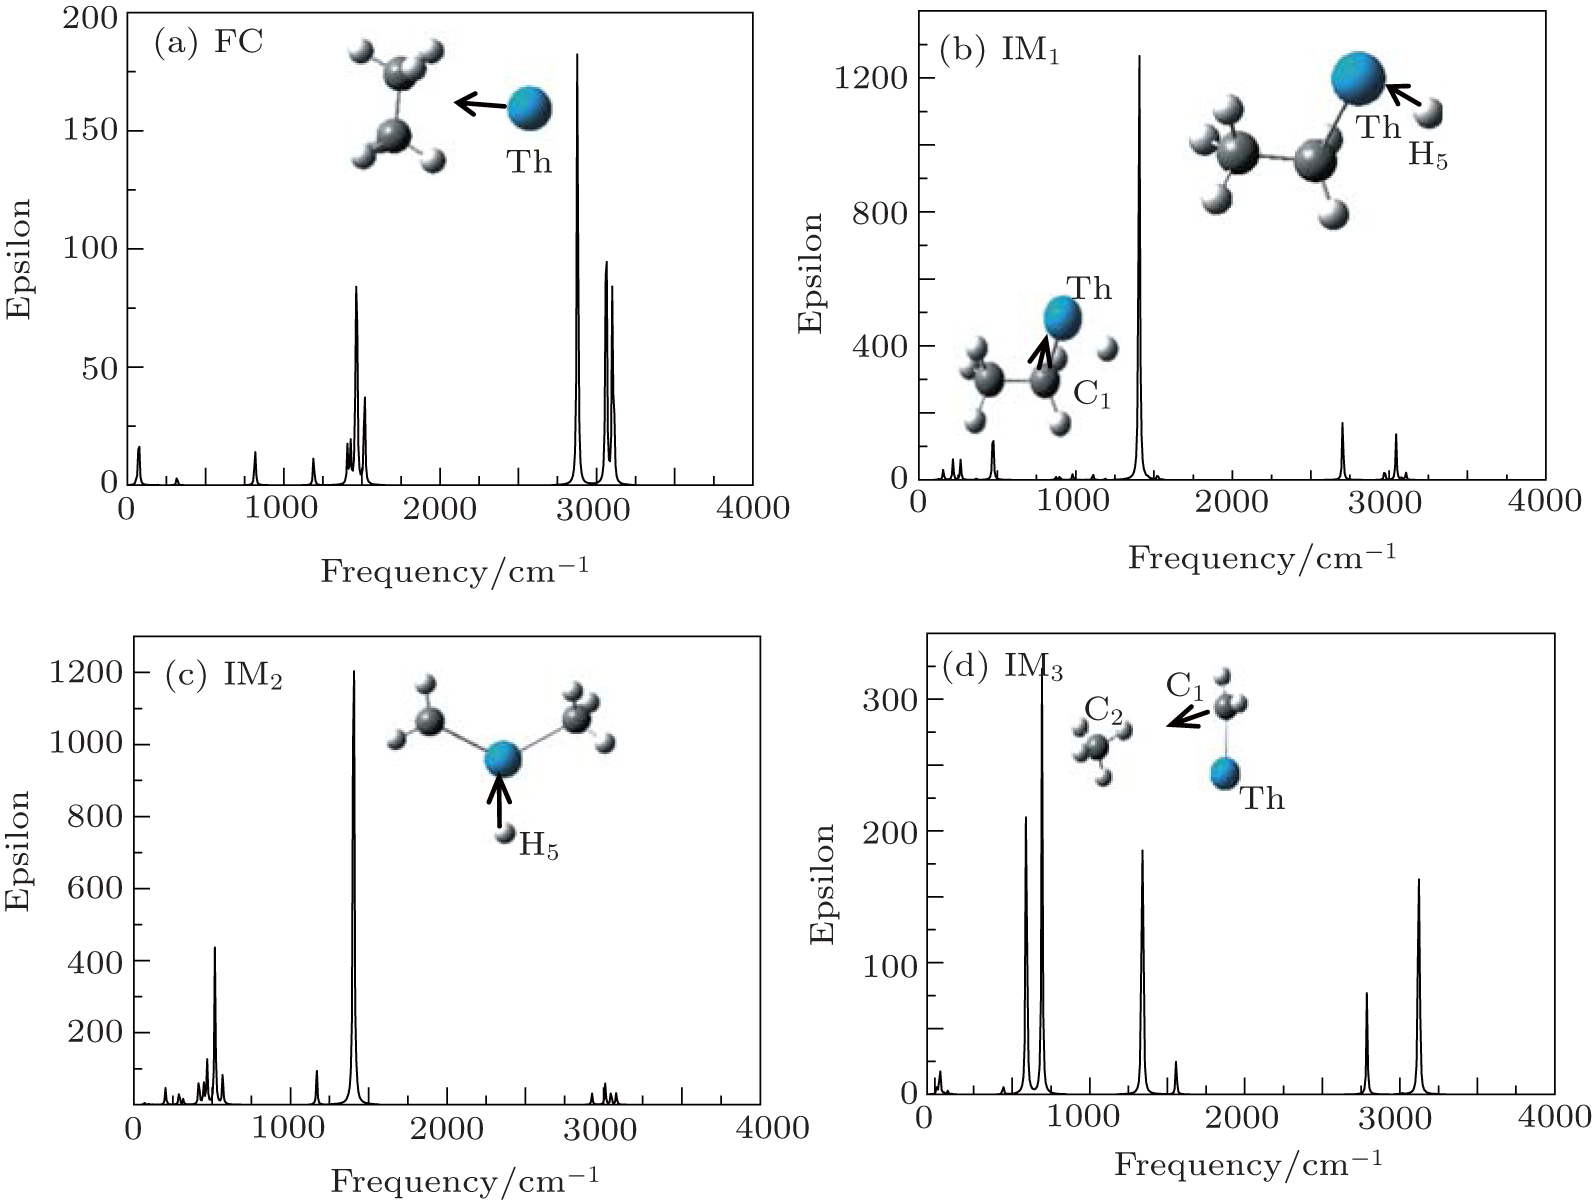 | Fig. 5. IR spectra of critical compounds (the unit of vertical axis is L/mol·cm−1. |
The calculated IR results show that FC has one characteristic peak (2890.12 cm−1). The peak is assigned to the closer vibration modes between the Th atom and C2H6 molecule. IM1 has two characteristic peaks (1404.92 cm−1 and 472.60 cm−1). The strongest peak is assigned to the asymmetrical stretching modes of Th atom and H5 atom, while the 472.60 cm−1 is from the stretching of Th atom and C atom. As for the intermediate IM2, the peak at 1403.87 cm−1 is from the stretching mode of Th−H5 bond. The weaker one at 68.33 cm−1 comes from asymmetrical stretching modes of Th−C1 bond and Th−C2 bond. The strongest peak corresponds to 765.85 cm−1 and is assigned to asymmetrical stretching of C1−C2 for the IM3. The second strongest IR absorption for the IM3 corresponds to the Th−C2 stretching mode calculated at 582.12 cm−1, and its IR intensity is 1.51 km/mole. In addition, the characteristic peaks at 1482.23 cm−1 (FC), 2788.45 cm−1 (IM3), and 1167 cm−1 (IM2) are mainly dominated by the stretching of C−H bond and out-of-plane deforming of methyl.
In this work, the theoretical calculations are performed to investigate the detailed mechanism of the C−C activation of C2H6 by Th atom. The present results contribute to a better understanding of the title reactions. The main conclusions can be summarized as follows.
| 1 | |
| 2 | |
| 3 | |
| 4 | |
| 5 | |
| 6 | |
| 7 | |
| 8 | |
| 9 | |
| 10 | |
| 11 | |
| 12 | |
| 13 | |
| 14 | |
| 15 | |
| 16 | |
| 17 | |
| 18 | |
| 19 | |
| 20 | |
| 21 | |
| 22 | |
| 23 | |
| 24 | |
| 25 | |
| 26 | |
| 27 | |
| 28 | |
| 29 | |
| 30 | |
| 31 | |
| 32 |