

Laser frequency locking based on the normal and abnormal saturated absorption spectroscopy of 87Rb
[Wan Jian-Hong, Liu Chang, Wang Yan-Hui†,  ]
]
]
|
|


† Corresponding author. E-mail:
Project supported by the National Natural Science Foundation of China (Grant No. 11174015).
We present a practical method to avoid the mis-locking phenomenon in the saturated-absorption-spectrum laser-frequency-locking system and set up a simple theoretical model to explain the abnormal saturated absorption spectrum. The method uses the normal and abnormal saturated absorption spectra of the same transition 52S1/2, F = 2–52P3/2, F′ = 3 saturated absorption of the 87Rb D2 resonance line. After subtracting these two signals with the help of electronics, we can obtain a spectrum with a single peak to lock the laser. In our experiment, we use the normal and inverse signals of the transitions 52S1/2, F = 2–52P3/2, F′ = 3 saturated absorption of the 87Rb D2 resonance line to lock a 780-nm distributed feedback (DFB) diode laser. This method improves the long-term locking performance and is suitable for other kinds of diode lasers.
The saturated absorption spectrum (SAS) is a widely used technique in laser frequency stabilization and atomic physics. In this technique, the laser beam is split into a weak probe beam and a strong pumping beam. These two beams are sent in opposite directions through one vapor cell. Because of the Doppler effects, only the atoms which are in the narrow range of axial velocity centered at v = 0 interact with both light waves and some peaks corresponding to the exact transition between the ground and excited states appear. At the same time, there are also some crossovers when the laser frequency is tuned exactly midway between two transitions if they are close enough. Owing to the saturation effect, the spectra are all peaks on the background of the Doppler-broadened absorption profile in a normal SAS.[1,2] The normal SAS is very useful for high resolution spectroscopy, but can also be unsatisfactory in other applications. For example, in an optically pumped rubidium beam frequency standard,[3] the detection laser is stabilized on the transition from F = 2 to F′ = 3 of the 87Rb D2 resonance line, but there are six peaks at the same time when the SAS method is used. Some groups proposed to shift or eliminate the close crossover peak with two lasers to avoid the influence of these undesired peaks.[4] However, these six peaks still exist and there is still some possibility of locking the wrong peak. Some SAS peaks can be inverted if the laser intensity is changed or the polarization is tuned. It is called abnormal SAS and some groups have done some theoretical and experimental work.[4–13]
Considering the similarities and dissimilarities between the normal SAS and abnormal SAS, we subtract the normal SAS and abnormal SAS to obtain a single peak spectrum of 87Rb. Obviously, using the single peak spectrum to lock the laser, one can avoid the mis-locking problem. In this paper, the mis-locking mainly means the laser locking of a wrong peak in the SAS. Meanwhile, we ensure that the laser keeps locking by using the digital locking method.
The rest of this paper is organized as follows. In Section 2, we first describe the apparatus of normal SAS and abnormal SAS, then we present the single peak spectrum that subtracts the normal SAS and abnormal SAS. Finally, we show the results of the long-term locking. In Section 3, we set up a theoretical model to explain the abnormal SAS. Conclusions are given in Section 4.
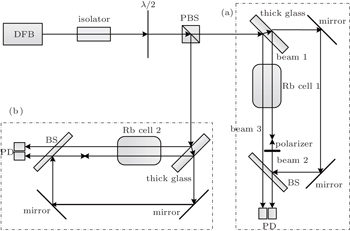
The experimental setup consists of a normal saturated absorption spectrum configuration and an abnormal saturated absorption spectrum configuration shown in Fig.
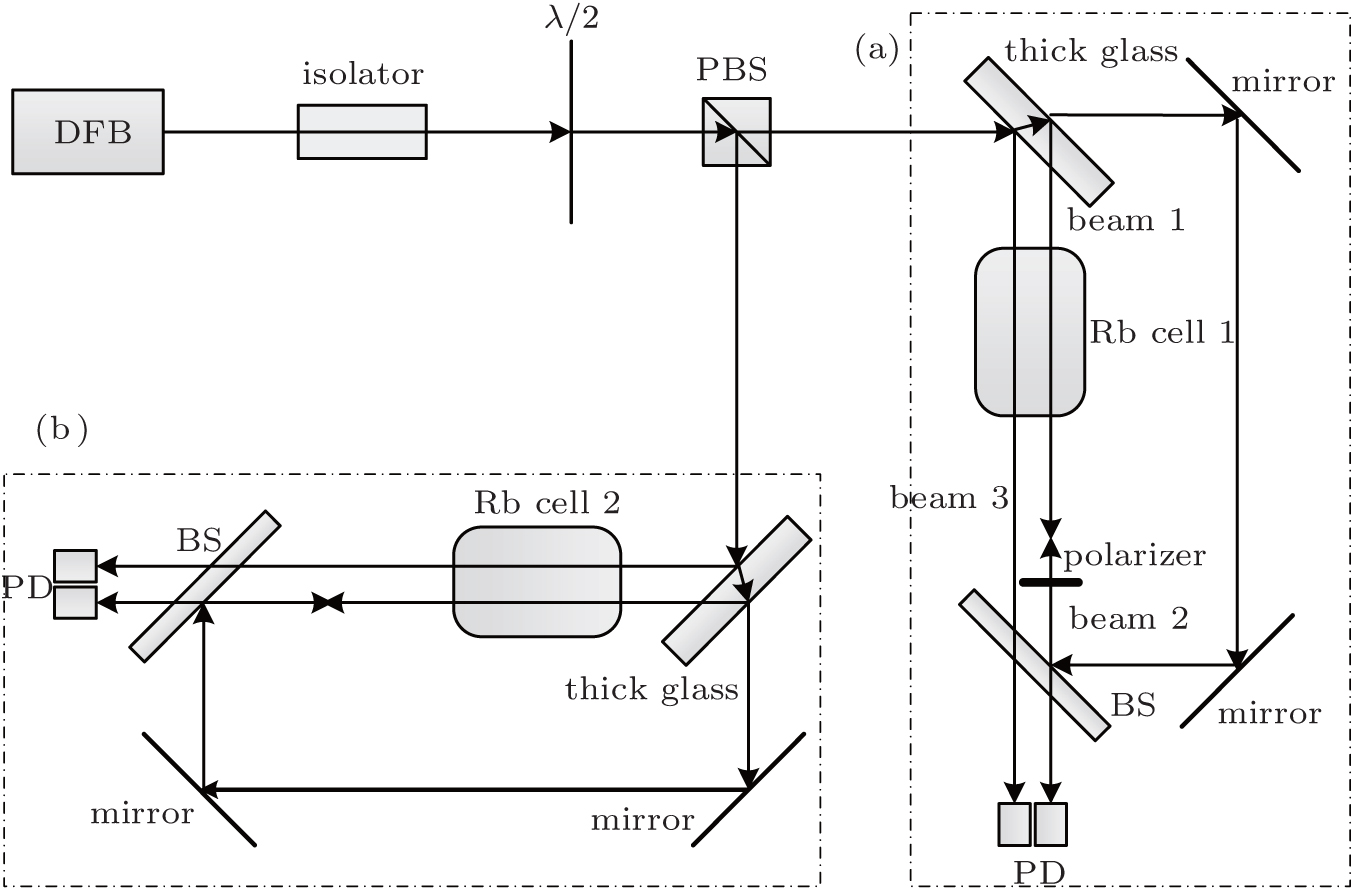 | Fig. 1. Experimental schematic diagram. DFB: distributed feedback laser, λ/2: half wave plate, PBS: polarizing beam splitter, BS: beam splitter, Rb: cell the rubidium cell, PD: photodiode. Part (a) is the experimental setup of the abnormal saturated absorption spectroscopy. Part (b) is the experimental setup of the normal saturated absorption spectroscopy. |
As shown in part (a) in Fig.
As shown in Fig.
We use an Rb cell to measure a cylinder with 20 mm in diameter and 50-mm long at room temperature. The 780-nm laser system is a commercial TOPTICA DL100 laser. The modulation frequency is 5 kHz. It provides a pumping beam power of 3.60 mW and a probe beam power of 0.40 mW for the abnormal SAS setup. Meanwhile, it provides a pumping beam power of 0.37 mW and a probe beam power of 0.06 mW for the normal SAS setup. The spot diameter of the laser beam is about 2 mm.
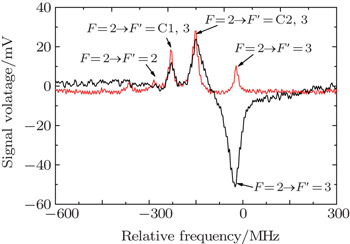
The experimental normal and abnormal saturated absorption spectra are shown in Fig.
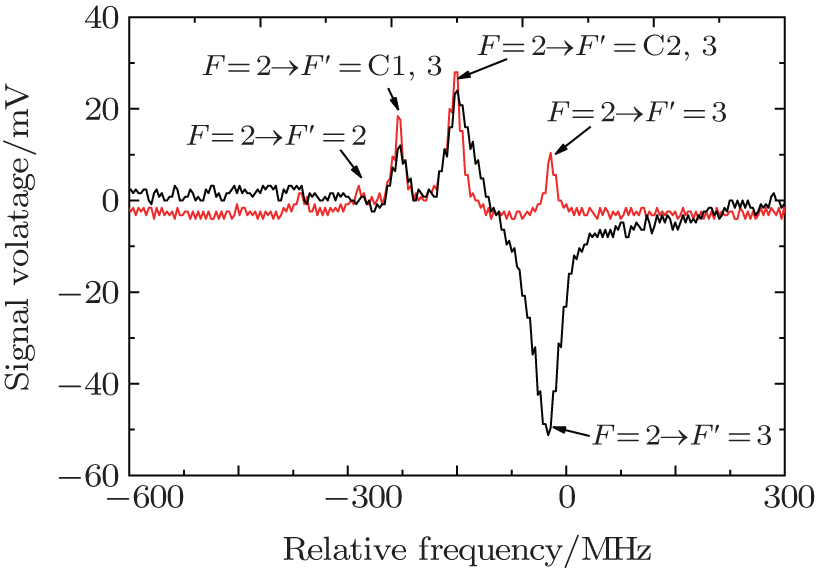 | Fig. 2. Saturated absorption spectra. In this figure, the black line represents the abnormal saturated absorption spectrum and the red line represents the normal saturated absorption spectrum. |
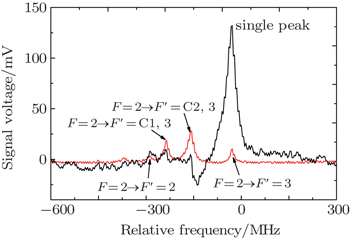
The single strong peak can be obtained when the two spectra are subtracted with the help of electronics. The optimal result is shown in Fig.
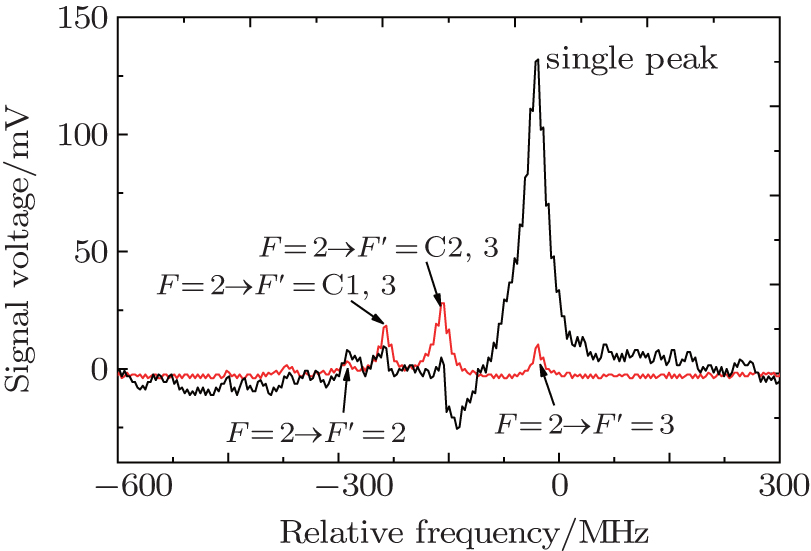 | Fig. 3. Spectrum (black) after subtracting two spectra and being magnified by one operational amplifier, and normal saturated absorption spectrum (red) being the same as that in Fig. |
Comparing the two spectra in Fig.
The result is shown in Fig.
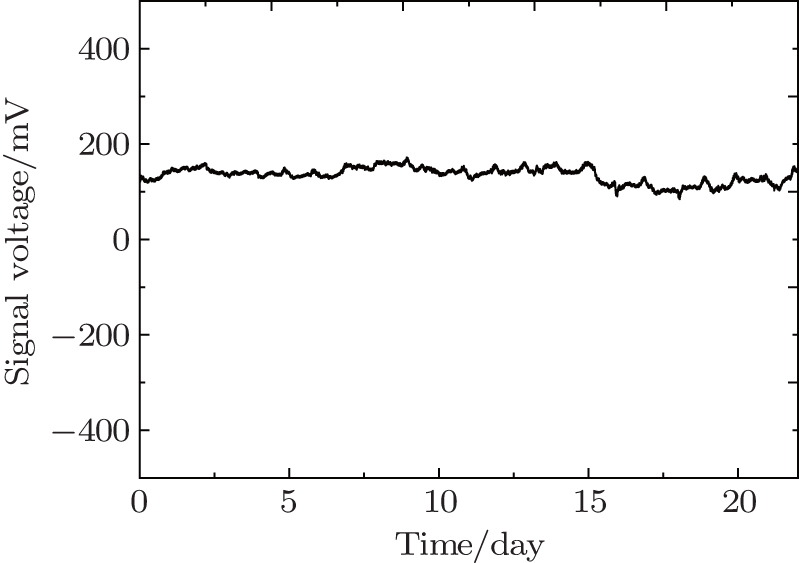 | Fig. 4. Result of the laser locking. We obtain the photodiode voltage for 22 days. The laser remains in the locking state when the floating range of the photodiode voltage is 100 mV–200 mV. The sampling time of each point is 10 s. |
There have been many studies about the formation mechanism of the saturated absorption spectrum.[5,6] The four-level optical pumping model by Nakayama is a great method for predicting the theoretical saturated absorption spectrum.[7] Moon and Noh[8] obtained analytic solutions for the saturated absorption spectrum of 87Rb by calculating the rate equation model and the predicted accurate saturated absorption spectrum under all experiment conditions. At the same time, their theory is too complex to explain the abnormal saturated absorption spectrum. In this paper, we simplify Moon and Noh’s theory to study the formation mechanism of the inverse absorption peak on the basis of these studies.
In order to present the theoretical model as clearly as possible, we proceed in two steps: firstly, we describe the modification of the population of 87Rb atoms on each level due to the pump laser. Secondly, we analyze the change of the probe laser intensity. We use the rate equation to calculate the modification of the atoms. Before further discussion on the abnormal saturated absorption spectrum, we set up a simple model to explain the formation mechanism of the inverse absorption peak. In the theoretical discussion of this section, we set the laser as ideal monochromatic light unless otherwise stated.
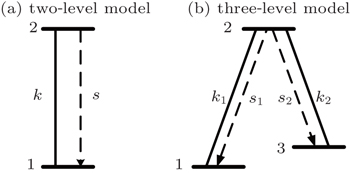
Firstly, we consider the two-level model which is shown in Fig.
 | Fig. 5. Level system for the simple model. The two-level model (a) and three-level model (b) are shown. In the figure k, k1, and k2 are stimulated emission rates, s, s1, and s2 are spontaneous emission coefficients. |
We list two rate equations of the three-level model, where equation (
Then, we consider the three-level model shown in Fig.
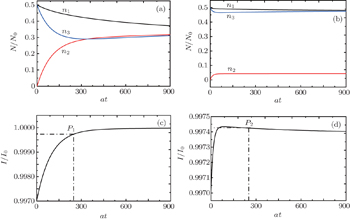
We calculate Eqs. (

 | Fig. 6. Theoretical simulation results. Panels (a) and (b) show the modification of the 87Rb atoms, panels (c) and (d) show the modification of the probe laser. In panels (a) and (b), the black line represents n1, the red line denotes n2, and the blue line refers to n3. In these panels, the t, N, I, I0, and N0 denote the time, modification of the number of atoms, modification of the probe laser intensity, probe laser intensity, and the number of atoms. The P1 and P2 are the points we select from panels (c) and (d), where the a = 1, b = 1, I0 = 1, k1 = 0.001, k2 = 0.005, s1 = 0.01, s2 = 0.05, n1 = n2 = 1/2, and n2 = 0. |
We calculate the modification of the probe laser intensity by using Eq. (


In the above subsection, the formation of the inverse absorption peak has been analyzed by setting up a simple model. In this subsection, we will calculate the saturated absorption spectrum of 87Rb.
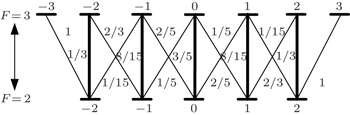
In the experiment, we obtain the normal and abnormal saturated absorption spectrum of the transition 52S1/2, F = 2–52P3/2, F′ = 3 of the 87Rb with one DFB laser (780 nm) simultaneously. The abnormal saturated absorption spectrum is created by using the probe and pumping laser beam of π-polarization. As is shown in Fig.

 | Fig. 7. Normalized transition probabilities between all magnetic sublevels in the transition 52S1/2, F = 2–52P3/2, F′ = 3 of the 87Rb D2 resonance line. The numbers near the line are the transition probabilities between the ground-state and the excited-state. The bold line represents the transition line which uses the π-polarization laser. |
The modification of the probe laser intensity is defined as

By combining Eq. (
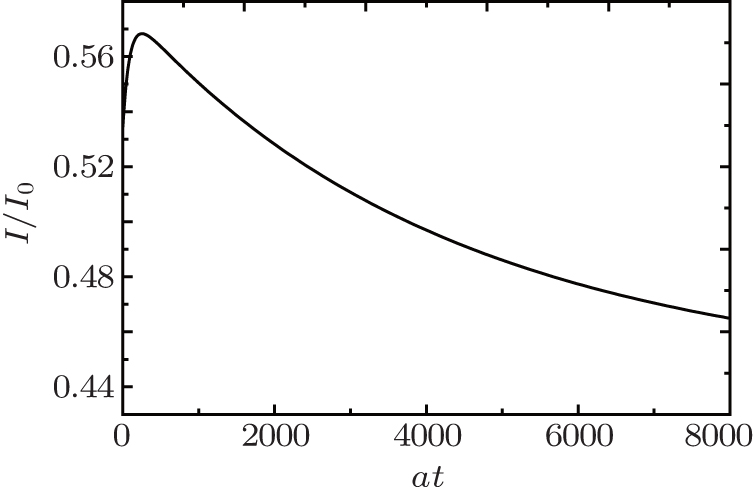 | Fig. 8. Modification of the probe laser intensity in the transition 52S1/2, F = 2–52P3/2, F′ = 3 of the 87Rb. The I, I0, t denote the modifications of the probe laser intensity, probe laser intensity, and time. |
We calculate the other transition of the 87Rb D2 resonance line, which uses the π-polarization laser with the same method as the above. Our calculation indicates that the inverse absorption peak is only feasible in the transitions 52S1/2, F = 2–52P3/2, F′ = 3 and 52S1/2, F = 1–52P3/2, F′ = C0,1 of the 87Rb D2 resonance line when the π-polarization light is used. We are also able to calculate the results under various conditions of laser polarization in the same way. The results are shown in Table
| Table 1. Absorption peak condition under various laser polarizations. . |
In the experiment, we observe the abnormal saturated absorption spectra of the transitions 52S1/2, F = 2–52P3/2, F′ = 3 of the 87Rb D2 line and obtain the single peak corresponding to the phenomenon to lock the DFB diode laser. We analyze the conditions of the abnormal saturated absorption spectrum and set up a simple theoretical model to explain it. This demonstration opens new possibilities for the laser frequency locking methods.
| 1 | |
| 2 | |
| 3 | |
| 4 | |
| 5 | |
| 6 | |
| 7 | |
| 8 | |
| 9 | |
| 10 | |
| 11 | |
| 12 | |
| 13 |