Zheng Gui-Li, Zhang Hui, Ye Wen-Jiang, Zhang Zhi-Dong, Song Hong-Wei, Xuan Li. Theoretical analysis of the influence of flexoelectric effect on the defect site in nematic inversion walls. Chinese Physics B, 2016, 25(3): 036101
Permissions
Theoretical analysis of the influence of flexoelectric effect on the defect site in nematic inversion walls
Zheng Gui-Li1, 2, 3, †, , Zhang Hui3, Ye Wen-Jiang3, Zhang Zhi-Dong3, ‡, , Song Hong-Wei4, Xuan Li1
State Key Laboratory of Applied Optics, Changchun Institute of Optics, Fine Mechanics and Physics, Chinese Academy of Sciences, Changchun 130033, China
University of Chinese Academy of Sciences, Beijing 100049, China
School of Sciences, Hebei University of Technology, Tianjin 300401, China
College of Electronic Science and Engineering, Jilin University, Changchun 130021, China
Project supported by the National Natural Science Foundation of China (Grant Nos. 11374087, 11274088, and 11304074), the Natural Science Foundation of Hebei Province, China (Grant Nos. A2014202123 and A2016202282), the Research Project of Hebei Education Department, China (Grant Nos. QN2014130 and QN2015260), and the Key Subject Construction Project of Hebei Province University, China.
Abstract
Abstract
Based on the experimental phenomena of flexoelectric response at defect sites in nematic inversion walls conducted by Kumar et al., we gave the theoretical analysis using the Frank elastic theory. When a direct-current electric field normal to the plane of the substrate is applied to the parallel aligned nematic liquid crystal cell with weak anchoring, the rotation of ±1 defects in the narrow inversion walls can be exhibited. The free energy of liquid crystal molecules around the +1 and –1 defect sites in the nematic inversion walls under the electric field was formulated and the electric-field-driven structural changes at the defect site characterized by polar and azimuthal angles of the local director were simulated. The results reveal that the deviation of azimuthal angle induced by flexoelectric effect are consistent with the switching of extinction brushes at the +1 and −1 defects obtained in the experiment conducted by Kumar et al.
The flexoelectric effect in nematic liquid crystal (NLC) is a mechanoelectrical phenomenon analogous to piezoelectricity in solids.[1,2] The direction of axial symmetry is given by the director n in uniaxial nematics which possess a long-range orientational order but no translational order. A strain-free nematic is invariant with respect to an inversion of its director, from n to −n. The splay and bend deformation will break this symmetry and polarize the material, and conversely an electric field will induce a deformation.[3,4] As proposed by Meyer in 1969,[5] the flexoelectric polarization is proportional to the deformation and written by
where e1 and e3 are the flexoelectric coefficients corresponding to splay and bend deformation, respectively. Research on the flexoelectricity of NLC material has always been a hot topic in LC field. Recent studies on the flexoelectric effect attracted new interest of considering[8] exploring flexoelectric coefficients,[9,10] stabilizing blue phases in chiral LC,[11] and flexoelectric response at defect site in nematic inversion walls.[12] In particular, Kumar et al. studied the electric field-induced structural distortions at +1 and −1 defects in a planarly aligned nematic phenyl benzoate.
Topological defects arise as a result of broken continuous symmetry and are ubiquitous in nature.[13–15] Commonly observed defects in the uniaxial nematic phase are typical point defects with topological charge S = ±1 and line defects with topological charge S = ±1/2.[16] The region where the presence of a defect causes apparent deviations from bulk ordering is referred to as the defect core.[17] Its linear dimension is roughly given by the correlation length of the order parameter field employed to describe the phase transition.[18] Nematic layers aligned planarly between unidirectionally rubbed plates with weak anchoring often exhibit narrow inversion walls containing several linear defects normal to the sample plane.[19] In 2006, Kumar et al.[12] sandwiched butyl 4-(4-ethoxyphenoxycarbonyl) phenyl carbonate (BEPC) between glass plates coated with ITO, which were rubbed unidirectionally on silk prior to cell construction and no surfactant material was used for securing a planar alignment. As seen between crossed polarizers, the inversion surface walls containing linear defects of charge ±1 were exhibited. When the substrates were applied a direct-current (DC) field, the extinction cross at a given defect was observed to rotate clockwise or anticlockwise, depending on the field direction. The extent of rotation was found to be linear with field, indicating its flexoelectric origin.
In a previous study, Tian et al.[20] investigated the interaction between a +1 defect whose nuclei is ‘circular’ nuclei (i.e., the director flux lines around the defect nuclei are circular) and the surface wall and flexoelectric response at the defect site, using the one-dimensional finite-difference iterative method based on the Landau–de Gennes theory. They found that the deviation of azimuthal angle of the director around the defect nuclei increases gradually with the increase of the electric field intensity. Therein, they only considered cylindrically symmetric solutions containing the +1 defect. However, the cylindrical symmetry is broken in the case of −1 defect, in which different phenomena need to be further researched.
The brief purpose of this paper is to give the theoretical analysis of the influence of the flexoelectric effect on the ±1 defect sites in nematic inversion walls based on the Frank theory. In Section 2, we first describe the structure of the defect site in the nematic inversion wall and obtain the free energy of NLC molecules around the defect site with an external DC electric field, and then deduce the equilibrium equations. Based on the equilibrium equations, the numerical results of the deviation of azimuthal and polar angles for the director around the defects site are simulated in Section 3. Meanwhile, we still analyze the influence of the surface anchoring strength and the flexoelectric effect on the simulated results and explain the experimental phenomenon conducted by Kumar et al. The conclusion is given in Section 4.
2. Theory
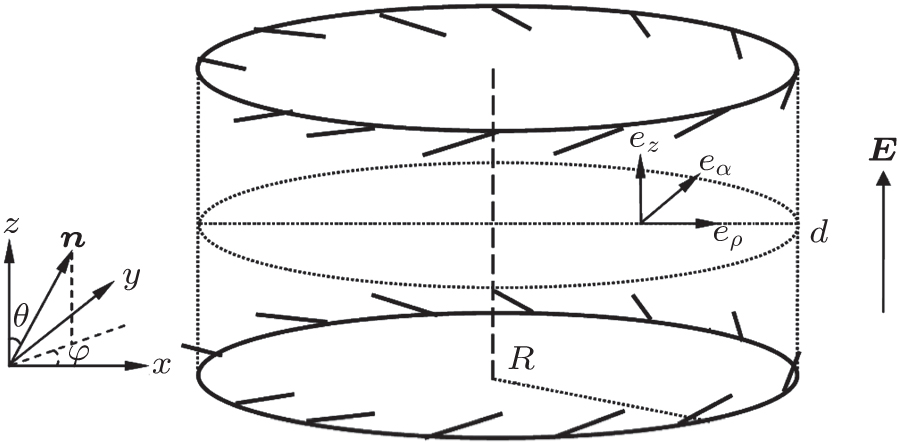
Let us consider NLC BEPC in the defect site confined between two plate substrates z = 0 and z = d with weak anchoring. The ±1 defects and two plate substrates can exhibit a cylinder-like structure (but generally without cylindrical symmetry), and the z axis of the cylinder is normal to the LC cell, as shown in Fig. 1, where R is the radius of defect and d is the thickness of NLC layer. A DC electric field E = Ez = U/d is applied to the cell along the z axis, where U is the external applied voltage. Following Ryschenkow and Kleman,[21] the typical defects appear in such peculiar samples when d < b (b is the extrapolation length). The experimental phenomenon about the typical defects is certainly related to the weakness of the anchoring and bulk energies, which practically forbid any fluctuation of the director through the thickness (∂/∂z ≈ 0), except in the vicinity of disclinations.
Fig. 1. Structure of defect site in nematic inversion wall.
To describe this cylindrical defect we introduce standard cylindrical coordinate (ρ, α, z) and the corresponding local frame (eρ, eα, ez). The director of NLC in cylindrical coordinate can be written as n = (nρ, nα, nz). On the other hand, the director of NLC in rectangular coordinate system (x, y, z) can be written as n = (nx, ny, nz) and the polar and azimuthal angles defining the local director are θ and φ. The coordinate transform can be done between rectangular coordinate and cylindrical coordinate. The azimuthal angle between the projection of director and x axis is φ = Sα + C, where S is topological charge and C is the constant angle. We assume that the deviation of azimuthal angle is β after applying the electric field.[22]
From the elastic continuum theory of LC, the bulk free energy density of the above system fbulk contains elastic, dielectric, and flexoelectric contributions, but because the value of dielectric anisotropy Δε for BEPC is very small,[12] the dielectric contribution can be ignored. Therefore, the bulk free energy density fbulk can be written as
where K11, K22, and K33 are the splay, twist, and bend elastic constants, K24 is the elastic constant of a divergence term which can be transformed to a surface integral by using Gauss’s theorem.[23] Through the free energy density integral, one can obtain the bulk free energy Fbulk as the following expression:
The surface energy density fs, describing the interaction between the NLC molecules close to the substrate and the substrate itself, is given by
where Ws is surface anchoring energy strength, θ0 is the polar angle of NLC easy direction and supposed to be π/4.[21] The surface energy can be read as
Taking into account the bulk free energy and the surface energy, the total energy of defect system Ftotal can be given by
where the total free energy density ftotal is
For the +1 defect, the NLC texture exhibits a cylindrical symmetry, so the director is independent of α and z and is just a function of radius ρ. The value of S is +1 and the value of C is 0 or π/2. Here, we choose C = π/2, then φ = Sα + C = α + π/2. Hence, the director profile in the mid-plane z = d/2 with E = 0 is shown in Fig. 2, which is similar to that shown in Fig. 5 of Ref. [12]. Then the director of NLC in cylindrical coordinate can be written as
Fig. 2. The director profile in the mid-plane z = d/2 for +1 defect without applied voltage.
Considering the effect of an applied electric field, the total free energy density ftotal can be given by
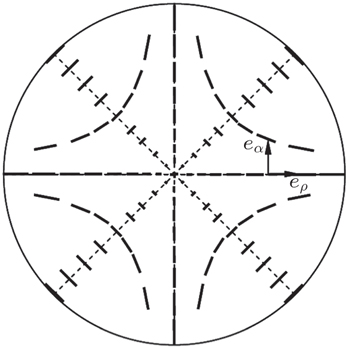
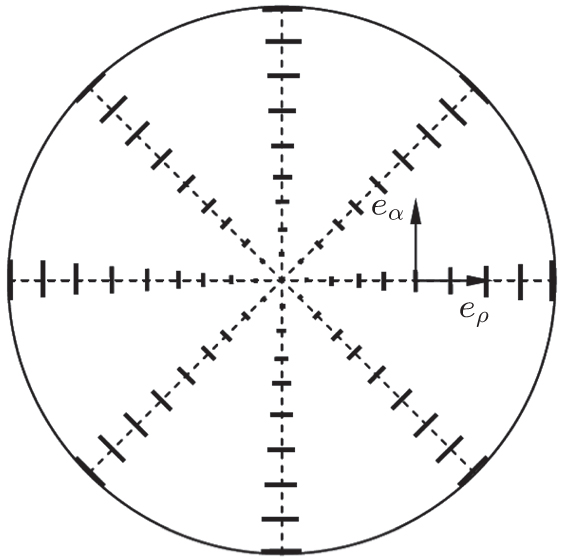
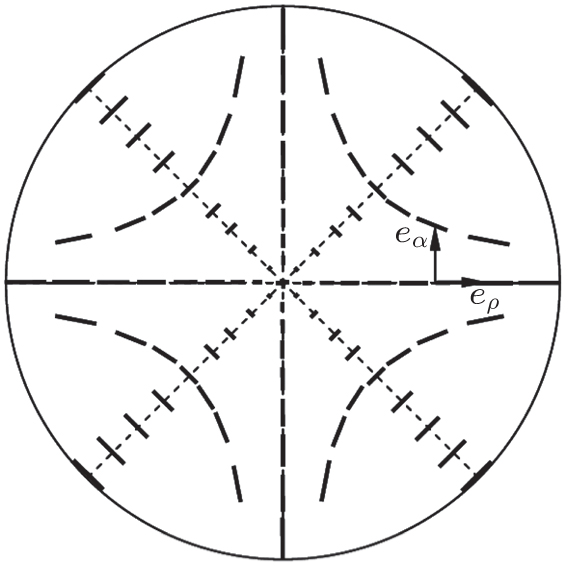
For the −1 defect, the cylindrical symmetry is broken. The director is the function of both α and ρ. The value of S is −1 and C = 0 is chosen, then φ = Sα + C = –α. Hence, the director profile in the mid-plane z = d/2 with E = 0 is shown in Fig. 3, which is also similar to the −1 defect in a wall normal to the easy axis given in Ref. [12]. Then the director of NLC in cylindrical coordinate can be written as
where θ = θ (ρ, α), β = β (ρ, α). Considering the effect of an applied electric field, the total free energy density ftotal can be calculated similarly to the +1 defect and given by
Fig. 3. The director profile in the mid-plane z = d/2 for −1 defect without applied voltage.
For a given applied voltage, the equilibrium configuration of NLC should make the total free energy density ftotal minimization, satisfying the following Euler–Lagrange equations:[1]
The boundary conditions for ±1 defects on the core of the defect (ρ = 0) and the lateral walls (ρ = R) are described as
and the variable α for −1 defect satisfies the periodic condition, namely θ (α + 2π) = θ (α).
Inserting the total energy density ftotal of +1 and −1 defect systems, Eqs. (9) and (11), into the Euler–Lagrange Eqs. (13) and (14) subjected to the boundary conditions, the equilibrium equations of θ and β for the +1 and −1 defects can be obtained. It is noted that the surface elastic K24 term does not appear in the theoretical frame under the boundary conditions (Eqs. (15) and (16)).
3. Simulation results and discussion
The change of NLC director is described by angles θ and β. In the numerical relaxation method,[24–27] the angles θ and β can be calculated by the following expressions respectively:
where
and γ1 is rotational viscosity coefficient for the NLC.
The stable solution of the angles θ and β must satisfy Eqs. (18) and (19). In the numerical calculations, a discretization with a time step is sufficient to guarantee the stability of the numerical procedure and equilibration times run enough to confirm the system to reach an equilibrium state. The parameters for LC and defect used in the numerical calculations are given as follows:[12,21]K11 = 15.8 × 10⁻¹² N, K22 = 6.0 × 10⁻¹² N, K33 = 17.9 × 10⁻¹² N, e1 – e3 = 5.0 × 10⁻¹² C/m, θ0 = π/4, d = 4.6 μm, R = 15.0 μm, γ1 = 0.1.
3.1. The effect of surface anchoring strength on ±1 defects
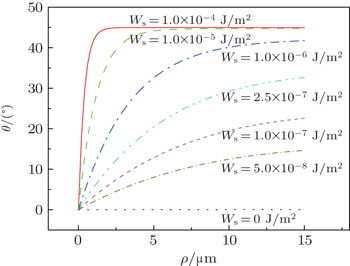
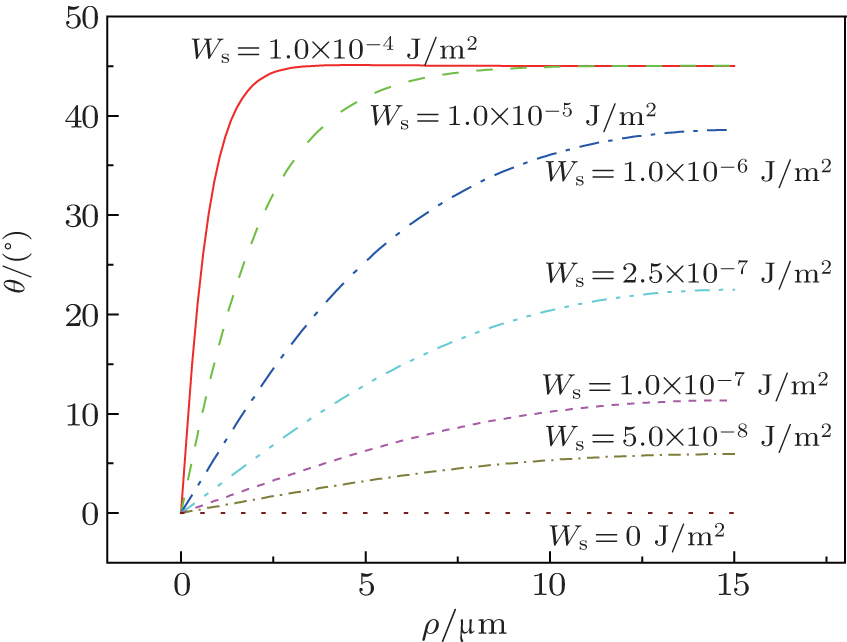
Similar to the parallel aligned cell, the surface anchoring strength of the substrate has an important influence on the orientation of LC molecules in ±1 defects. Figures 4 and 5 show the dependence of polar angle θ on radius ρ inside the +1 defect and −1 defect in 0° direction without external electric field. The values of surface anchoring strength are Ws = 1.0 × 10⁻⁴, 1.0 × 10⁻⁵, 1.0 × 10⁻⁶, 2.5 × 10⁻⁷, 1.0 × 10⁻⁷, 5.0 × 10⁻⁸, 0.0 J/m2. It is quite clear that the director near the defect nuclei tends to be along the direction of z axis and the angle θ will decrease with the surface anchoring strength Ws decreasing in a certain region in the ±1 defects. The director around the defect nuclei rotates clockwise around the ρ axis on their respective αz-plane with the increase of the surface anchoring strength Ws. In particular, polar angle θ tends to be close to π/4 which is the boundary conditions at z = 0 and z = d when the value of Ws is 10−4 J/m2.
Fig. 5. Polar angle θ versus radius ρ in 0° direction inside the −1 defect for different surface anchoring strengths Ws.
3.2. The influence of flexoelectric effect on the ±1 defects
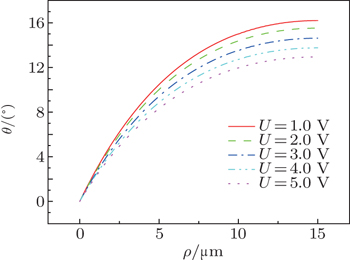
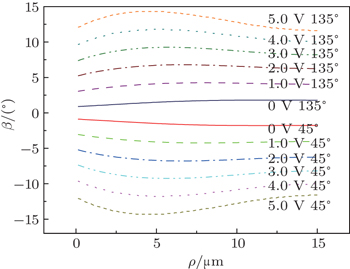
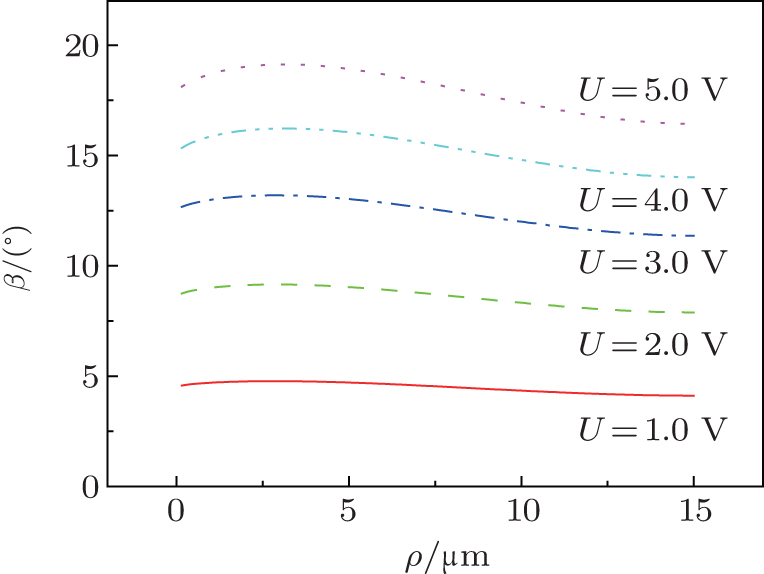
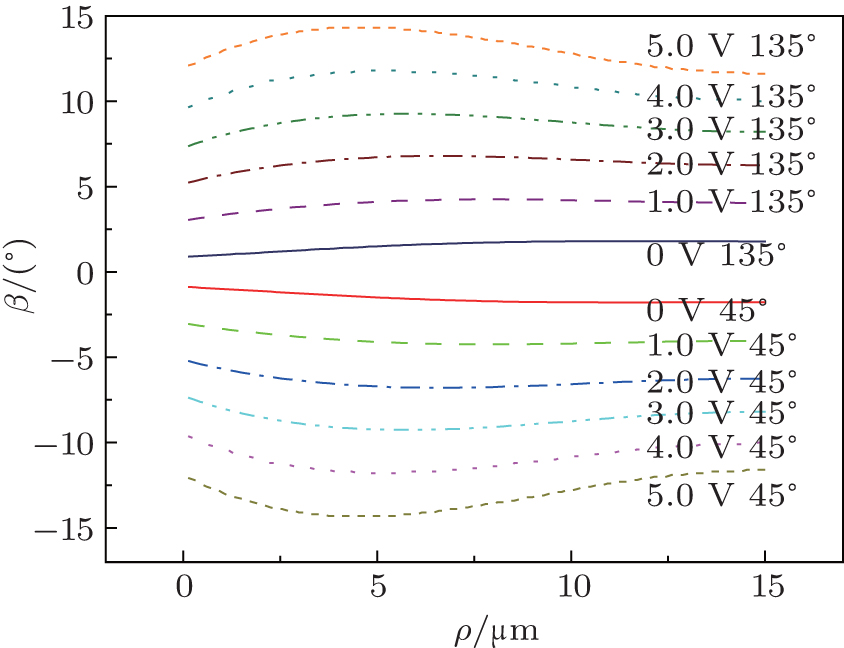
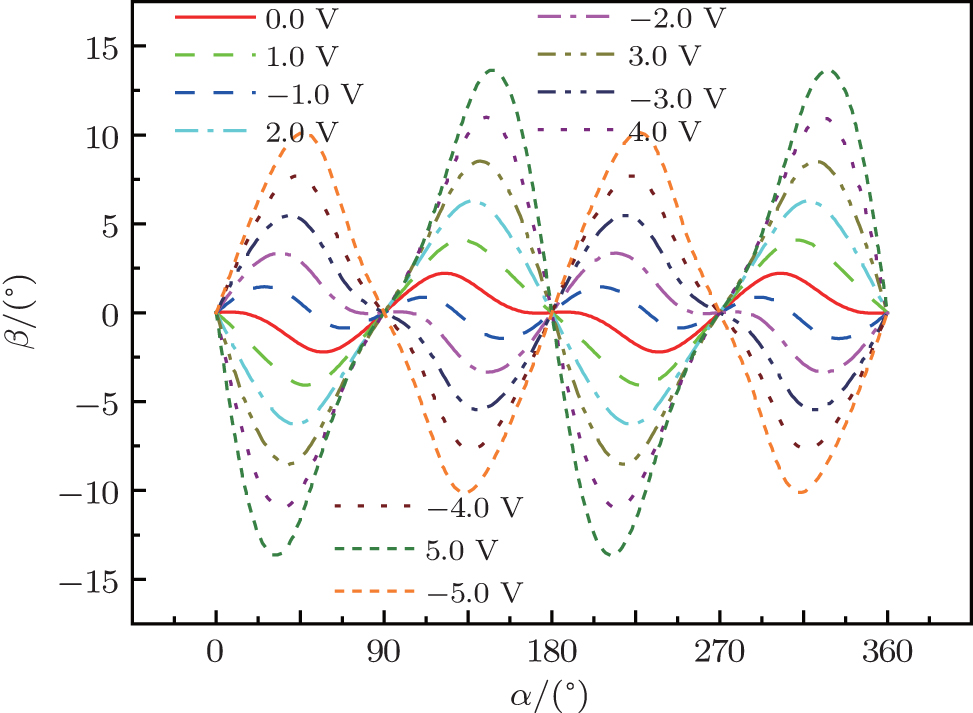
We simulate angles θ and β as functions of radius ρ inside the +1 defect for different external applied voltages. The typical director profiles of θ and β inside the +1 defect are given in Figs. 6 and 7, respectively. However, the phenomenon of switching of extinction brushes at −1 defect is significantly different from that at +1 defect.[12] The reason is that the angles of θ and β are not only the functions of radius ρ but also the functions of angle α at −1 defect. In order to display the director in different directions around the core of the −1 defect with different external applied voltages, we simulate angles θ and β as functions of radius ρ and angle α inside the −1 defect for different external applied voltages. Polar angle θ versus radius ρ in 45° direction and angle β versus radius ρ (except ρ = 0) in 45° and 135° directions inside the −1 defect are given in Figs. 8 and 9, respectively. Dependence of angle β on angle α at the lateral walls (ρ = R) for different external applied voltages are given in Fig. 10. The value of surface anchoring strength Ws is 1.0 × 10⁻⁷ J/m2 in these simulations.
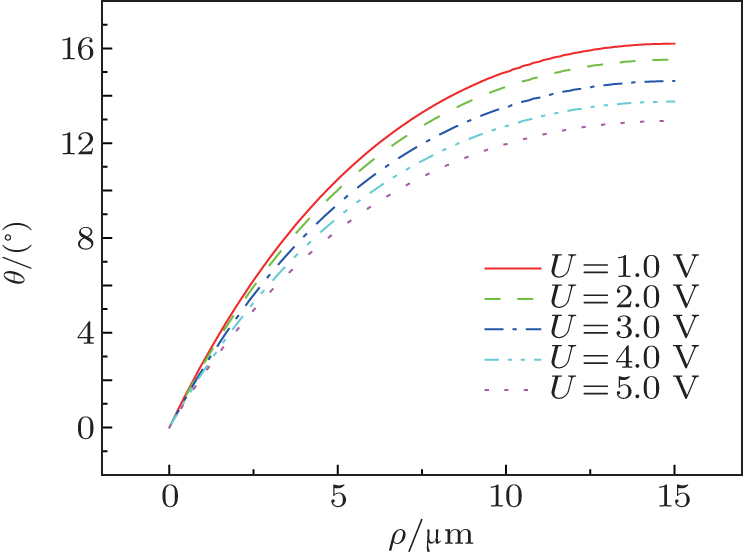
Fig. 8. Polar angle θ versus radius ρ inside the −1 defect in 45° directions for different external applied voltages.
For the +1 defect, figure 6 shows that polar angle θ decreases gradually with the increase of the external applied voltage, which illustrates the director tends to be along the direction of the z axis under the applied voltage. Figure 7 shows that the deviation of azimuthal angle β increases gradually with the increase of the external applied voltage, with β ≈ 20° for U = 5.0 V. However, the value of the angle β at the lateral boundary is smaller than it near the core of the defect. This is caused by the role of the surface wall. These simulated results can illustrate that the role of the surface wall will be enhanced with the increase of the radius, and the sense of rotation for the angle β will reverse when the field is reversed. Similar results were obtained in the previous research[17] based on the Landau–de Gennes theory.
Fig. 10. Deviation of azimuthal angle β versus angle α inside the −1 defect at the lateral walls (ρ = R) for different external applied voltages.
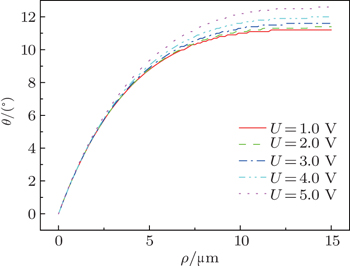
For the −1 defect, polar angle θ decreases gradually in the direction α = 0° and increases gradually in the directions α = 45° and 90° with the increase of the external voltage, the angle β versus radius ρ in 45° directions for different external applied voltages are shown in Fig. 8. Figure 9 shows that the deviation of azimuthal angle β in the directions α = 45°, 135° increases gradually in opposite senses, and the angle β is approximately 15° under external voltage with 5.0 V. However, the angle β in the directions α = 0°, 90° have no evident rotational motion with the increase of the external voltage. The results are consistent with the experimental phenomena produced by Kumar et al., where the brushes in the directions α = 45°, 135° were observed to rotate in opposite senses.[9] Also, for the angle β in the directions α = 45°, 135°, the sense of rotation reverses when the external applied electric field is reversed, which is essentially according with the experimental results of Kumar et al. However, a subtle difference between simulation results and experimental results of Kumar et al. exists for angle β with a given voltage and reversed one, which is induced by an approximate 1°–2° compensation with no external applied voltage as shown in Fig. 9.
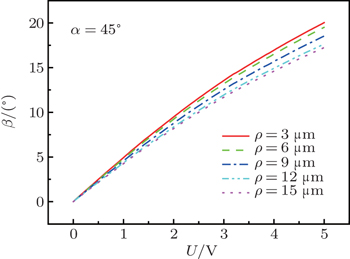
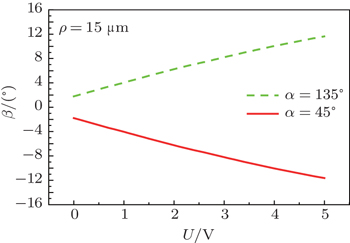
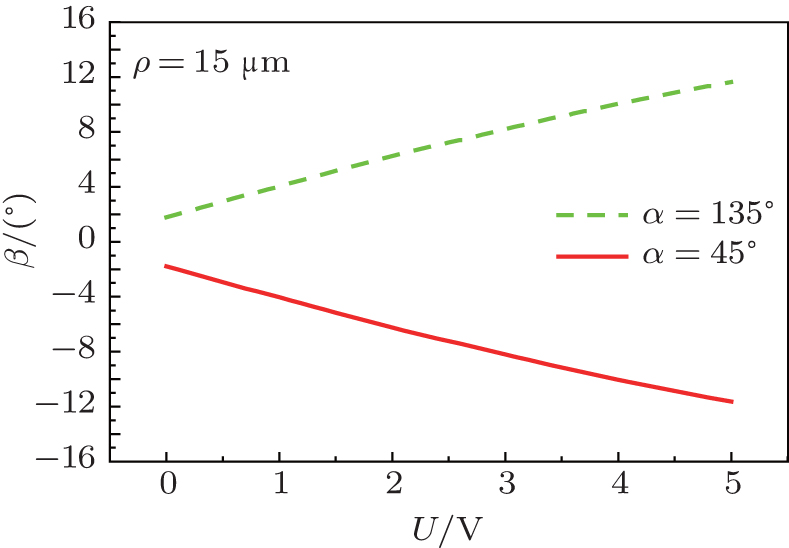
We still took out the angle β of the director for ρ = 3 μm, ρ = 6 μm, ρ = 9 μm, ρ = 12 μm, and ρ = 15 μm with different external voltages inside the +1 defect, as shown in Fig. 11. It illustrates that β is almost linear with the external applied voltage U. For a given voltage, the greater the radius, the smaller the angle β, and the difference is obvious with the increase of the voltage. Figure 12 shows the deviation of azimuthal angle β versus external applied voltages U inside the −1 defect with ρ = 15 μm in directions 45° and 135°. It also illustrates that β in directions α = 45° and α = 135° are linear with the external voltage, which is the same as the −1 defect in a wall along the easy axis given in the Fig. 13 of Ref. [12].
Fig. 12. Deviation of azimuthal angle β versus external applied voltage U inside the −1 defect with ρ = 15 μm in directions 45° and 135°.
4. Conclusion
In 2006, the experiment of flexoelectric response at defect sites in nematic inversion walls was conducted by Kumar et al. The corresponding theoretical analysis of the influence of flexoelectric effect on +1 defect has been done based on the Landau-de Gennes theory by Tian et al. However, no one has done a theoretical analysis of −1 defect because the cylindrical symmetry is broken in the −1 defect and the corresponding calculation process is more complicated than +1 defect regardless of the application of Landau–de Gennes theory and Frank theory. In this paper, the influence of flexoelectric effect on the ±1 defect sites in nematic inversion walls is investigated based on the Frank theory. On application of a DC electric field normal to the LC cell, which exhibits narrow inversion walls containing defects of charge ±1, the polar angle θ and the deviation of azimuthal angle β influenced by flexoelectric effect have been simulated for illustrative purpose. In this way, we characterize the field-driven structural changes at ±1 defect sites. For +1 defect, the deviation of azimuthal angle β increases gradually with the increase of the external applied voltage and the sense of rotation for the angle β will reverse when the electric field is reversed. For −1 defect, the deviation of azimuthal angle β in the directions α = 45°, 135° increases gradually in opposite senses, in a scissoring fashion, and deviation of azimuthal angle β in the directions α = 0°, 90° have no evident rotational motion with the increase of the external voltage. The angle β is linear with the external voltage U for the ±1 defects. These conclusions are consistent with the experimental results of Kumar et al. In a word, the influence of the flexoelectric effect on the ±1 defect sites in nematic inversion walls seems to account for the experimental results of Kumar et al., i.e., clockwise or anticlockwise rotation of extinction cross at ±1 defects. The theory model has a certain theoretical significance to research defects in liquid crystal.
Reference
1
XieY Z1998Physics of Liquid CrystalBeijingScience Press(in chinese)
2
ChandrasekharS1992Liquid Crystals2nd.CambridgeCambridge University Press
3
KrishnamurthyK SKumaraPTadapatriP2009J. Indian Inst. Sci.89255
4
BukaÁÉberN2013Flexoelectricity in Liquid CrystalLondonImperial College Press


 , Zhang Hui3, Ye Wen-Jiang3, Zhang Zhi-Dong3, ‡,