γ- and α-Ce phase diagram: First-principle calculation
[Zhang Lin†,  , Li Ying-Hua, Li Xue-Mei, Zhang Zu-Gen, Ye Xiang-Ping, Cai Ling-Cang]
, Li Ying-Hua, Li Xue-Mei, Zhang Zu-Gen, Ye Xiang-Ping, Cai Ling-Cang]
 |


† Corresponding author. E-mail:
Project supported by the National Natural Science Foundation of China (Grant Nos. 11272293 and U1230201), the Defense Industrial Technology Development Program (Grant No. B1520132001), and the Foundation of National Key Laboratory of Shock Wave and Detonation Physics of China (Grant No. 9140C670301140C67283).
Controversies about the phase diagram for the isostructural γ ↔ α phase transition of cerium have long been standing out for several decades. To seek insight into the problems, high-precision equations of state (EOS) for γ- and α-cerium are constructed based on first-principle calculation. Versus previous works, the strong anharmonic effects of ion vibration and the variation of magnetism of γ-cerium are stressed. The new EOS generally agrees well with experimental data regarding thermodynamics, phase diagrams, and phase transitions. However, new EOS predicts that another part of phase boundary in pressure-temperature space may exist except for the commonly known boundary. In addition, the well-known critical point seems to be a critical point for γ-cerium to translate from a stable state to an unstable state.
As the first of the rare-earth elements with f electrons, cerium is unique and continues to generate both theoretical and experimental works.[1–9] Among its intriguing physical and chemical properties, the most fascinating is the first-order isostructural phase transition. This involves a magnetic, high-temperature low-density γ phase and a nonmagnetic, low-temperature high-density α phase. At room temperature and a pressure of about 0.7 GPa, the γ-Ce collapses into α-Ce with a volume decrease of about 15%–17%, leaving the crystal structure unchanged as face-centered cubic (fcc).[10–13] Although it is a common consensus that the isostructural transition is tightly linked to the behavior of the 4f electron, the nature of the transition is still unclear.[14–26] The transition was first explained by the promotion of a f electron into spd orbital under pressure,[14] but it was refuted by experiments.[15,17] Nowadays two main theoretical pictures remain under debate: the Mott transition[12] and the Kondo volume collapse (KVC).[18] According to the Mott model, the transition is owing to the electron hopping between f orbitals, which changes drastically across the transition between the γ phase and α phase. In the KVC model, the transition is induced by the rapid change of the coherence temperature across the transition boundary, which affects dramatically the structure of the conduction spd electrons through the Kondo effect. Both models agree with many aspects in experiments, including photoemission and spectroscopy, as well as x-ray and neutron diffraction.[22–26] However, a recent theoretical study[8] argued that neither the KVC model nor the Mott model is sufficient to describe the isostructural transition.
The pressure–temperature (PT) phase diagram regarding to the transition between γ and α phases is extremely interesting because it is the only solid–solid transition in all elemental metals which has a phase boundary terminating at a critical point (CP), analogous to the well-known liquid–gas critical point. There are several puzzling questions about the γ- and α-Ce phase diagram, including the position of the CP (1.5 GPa, 480 K;[22] 1.75 GPa, 550 K;[27] 2 GPa, 600 K;[11] 2.05 GPa, 640 K[28]), and the possibility that the phase change continues as a second-order transition towards the melting line such that the critical point is in fact a tri-critical point.[22,24,29,30] Moreover, the fundamental interpretation and understanding of the CP remains unclear, and it seems difficult to theoretically reproduce the linear dependence between the transition temperature and pressure,[20,31] which was observed in experiments.[11] In order to have insight into these problems, we try to construct precise equations of state (EOS) for γ- and α-cerium based on first-principles calculation. Versus previous literatures,[20,21,31,32] our work pays more attention to the strong anharmonic effects of the ions that have been generally observed in rare elements. The variation in the magnetic moment of the γ-Ce atom has also been considered. Our calculations bring forward a different interpretation of the well-known CP, and predict that another part of phase boundary in pressure–temperature space may exist except for the commonly known boundary.
The equation of state is obtained by calculating the Helmholtz free energy, which is written as

Ab inito calculations were carried out by DFT+U method with the spin-dependent GGA and PAW-PBE pseudopotential implemented in VASP package.[33] During all ab initio calculations, the 5s25p64f15d16s2 were treated as valence electrons, and a 16× 16× 16 Γ-centered k mesh, 650-eV plane-wave kinetic cutoff was used. The self-consistence convergence energy was set to 10−7 eV to ensure high precision.
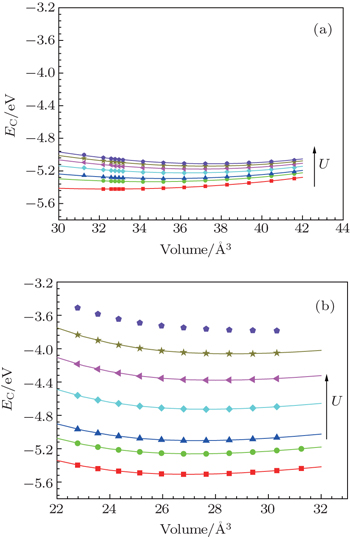
The appropriate values of U for Ce 4f electron have been debated in the literature.[31,32,34–36] Here, for every cell volume and electronic temperature, 7 values (1.0, 1.6, 2.0, 3.0, 4.0, 5.0, and 6.0 eV) are selected to carry out the calculations. Thereafter, the free energy is fitted to a parameterized function F(V,T,U) (U is treated as a parameter), and the most suitable values of parameter U for both γ- and α-Ce are finally determined by general comparison of the thermodynamic properties and phase diagram between theory and experiment.
We complete 9 different electronic temperatures from 100 K to 900 K with 100 K interval and 24 different volumes from 22.78125 Å3/atom to 41.59375 Å3/atom. The calculated cold energy and thermal electronic free energy are fitted to Vinet’s universal formula[37] and second-order homogeneous polynomial, respectively,

The ion vibration of rare-earth elements exhibits strong anharmonic effects. Thus, we use a quasi-harmonic model to predict the vibrational free energy

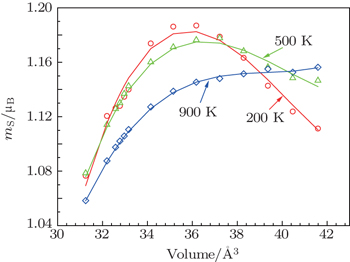
Until recently, no accurate expression exists for the magnetic free energy Fmag. Allen,[20] Johansson,[21] Laegsgaard,[31] and Wang[32] used the magnetic entropy to describe one atom of γ-Ce as Smag = KB ln[2J + 1.0] (J = 5/2) for the total angular moment of the 4f electron. This estimation is based on the assumption that the 4f orbits are filled with one electron all the time, but our ab initio calculations reveal the occupation of 4f and the total magnetic moment changes with the cell volume and electronic temperature. To take this change into consideration, we write the specific magnetic free energy of γ-Ce as

Figure
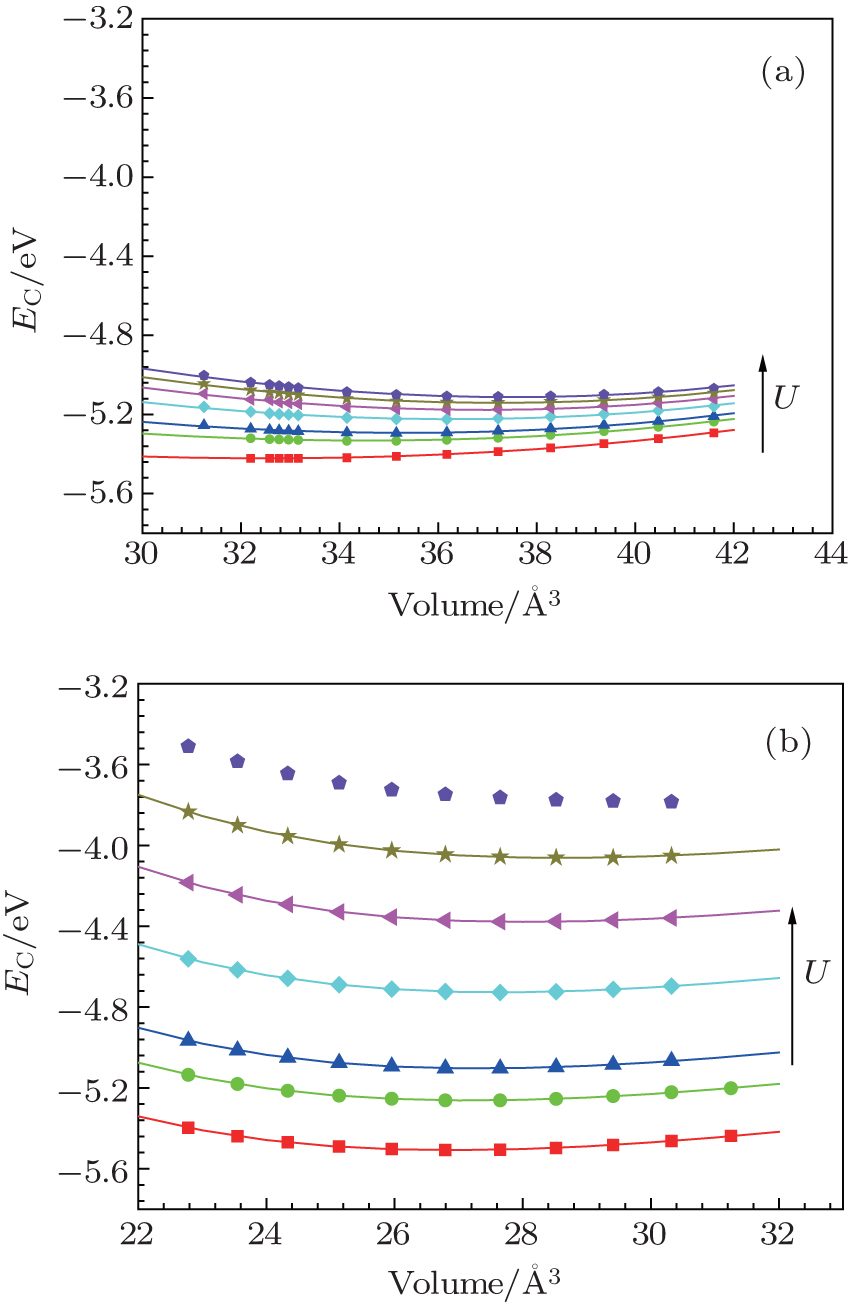 | Fig. 1. Cold energy calculated for U = 1.0, 1.6, 2.0, 3.0, 4.0, 5.0, 6.0 eV. (a) γ-Ce and (b) α-Ce. Scatter symbols are calculated data from ab-initio. Solid lines are fitted. |
By comparing theory and experiment on mass density, isotherms, phase diagram, as well as other thermodynamic data, the most appropriate values of U are 2.0 eV for γ-Ce and 1.5 eV for α-Ce, which are very close to Ref. [35] (1.5 eV) and Ref. [32] (1.6 eV). In Ref. [19], Liu et al. found that when fitting to Bremsstrahlung isochromatic spectroscopy data, the value of U should be 5.44 eV for γ-Ce and 5.34 eV for α-Ce, whereas 6.0 eV is most suitable for both γ- and α-Ce via 3d x-ray photoemission spectroscopy and the 4f photoemission. Accordingly, Laegsgaard and Svane[31] and Amadon et al.[34] used 6.0 eV in their ab initio calculations for γ- and α-cerium. The values determined here are much smaller than Liu et al. In fact, the parameter U is simply an empirical effective parameter introduced by the simplified Anderson single impurity model to describe the electron–electron on-site strong interactions. How to best determine its value remains a matter of debate. One well-accepted way is to examine the theoretical prediction and experimental measurement on a certain specific property. Thus, it is not inappropriate that the electronic property and thermodynamic property of cerium require different values of U due to different sensitivities. We note in Refs. [31] and [34] that the authors did not check the phase stability at zero pressure and temperature and used 6.0 eV as the value of parameter U for both γ- and α-Ce.
Figure
 | Fig. 2. Variation in the total magnetization moment of atom with U = 2.0 eV. Scatter symbols are calculated data from ab-initio. Solid lines are fitted results. |
There are a few model parameters in our EOS calculations, β in Eq. (
| Table 1. Parameter values obtained or used in this EOS calculation. . |
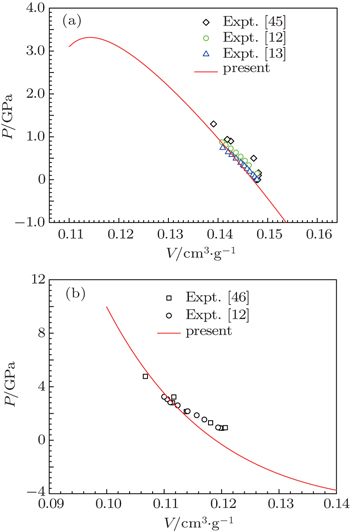
The pressure derivative of bulk modulus (B′) of γ-Ce is negative, which is consistent with the experimental measurements carried out by Jeong[12] and Decremps.[13] The V0 is larger than the experimental value at ambient conditions. It is reasonable to consider that the thermal expansion of γ-Ce is abnormal. The value of V0 for α-Ce is obviously smaller than the experimental measurements, which is a direct result of the smaller value for U (1.5 eV) in the DFT+U ab initio calculations. Increasing U to greater than 4.0 eV may increase V0 to the experimental value, but it increases the energy of α-Ce above that of γ-Ce. This conflicts with the experimental study which indicated that α-Ce is the stable phase at the vicinity of zero temperature and pressure.
Our calculated bulk modulus B of α-Ce is higher than the experimental measurement, but consistent with other first-principles calculations.[21,43,44] The discrepancy between theory and experiments reflects the limitation of DFT+U calculation. Figure
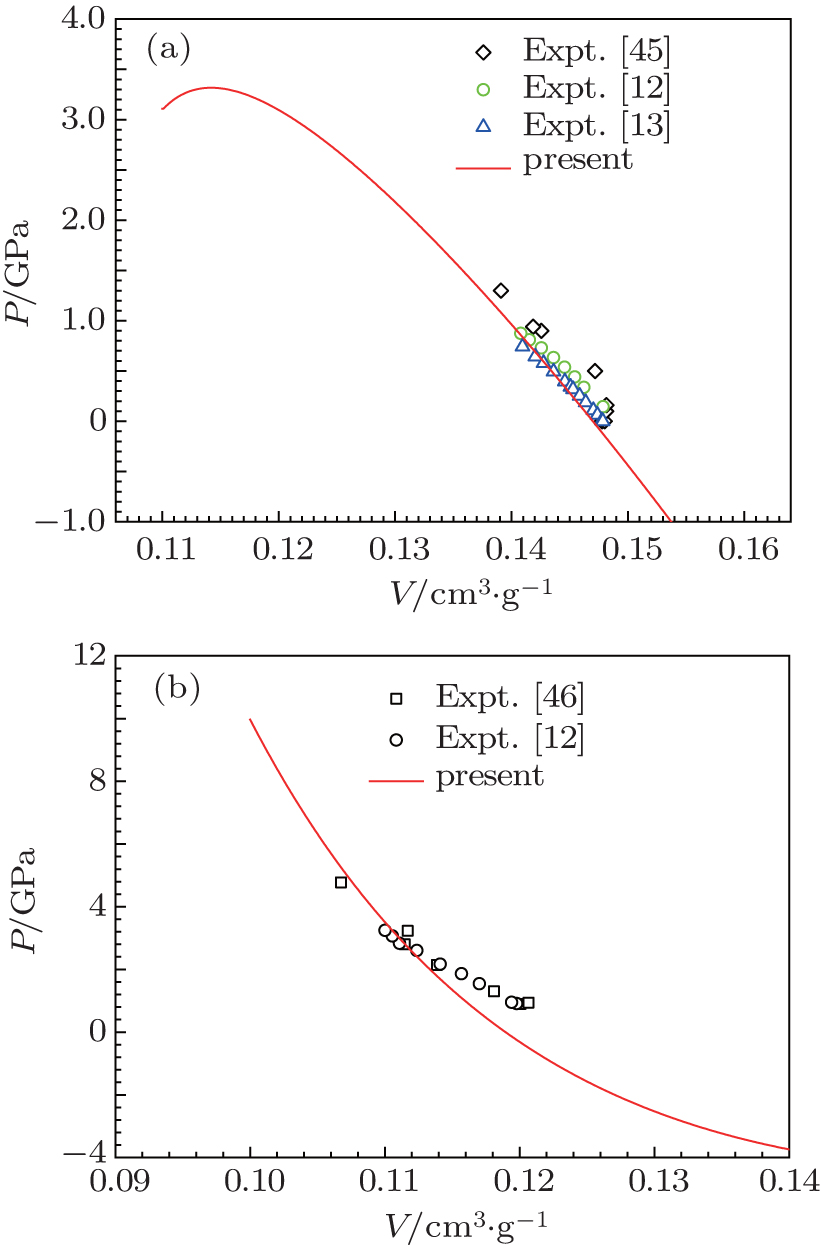 | Fig. 3. Calculated isotherm at room temperature. (a) γ-Ce, (b) α-Ce. |
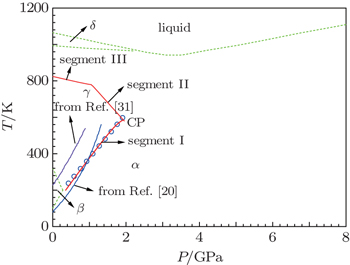
As a common knowledge, the phase boundary in P–T space can be achieved by calculating Gγ (P,T) = Gα (P,T) (Gibbs free energy). Our calculation predicts that the γ- and α-Ce phase boundary is composed of two segments, illustrated in Fig.
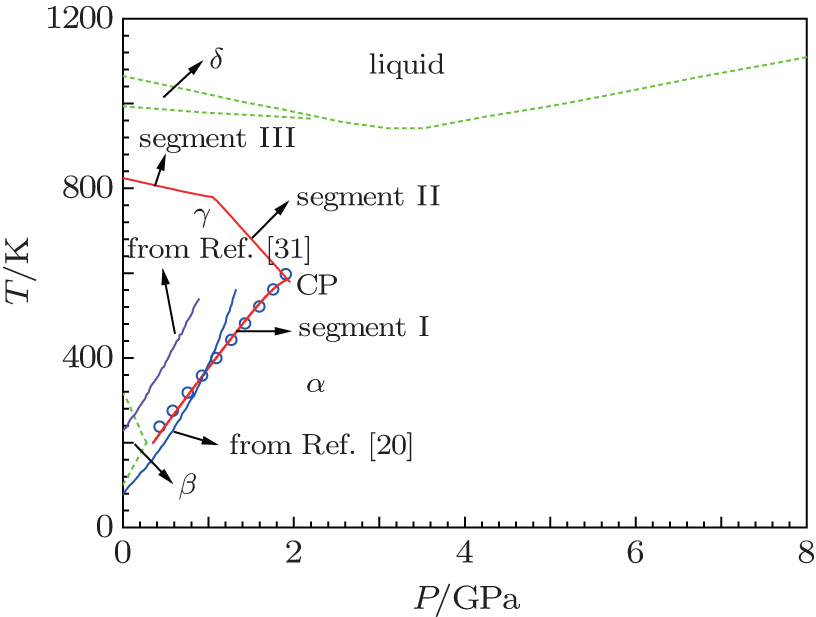 | Fig. 4. Phase diagram. Experimental data regard to the phase boundary between γ and α phases (open circle). The green dashed lines are from Ref. [11]. The blue and violet solid lines are the theoretical phase boundary for γ and α phases from Refs. [20] and [31], respectively. The segment I, II, and III are the theoretical lines of present work. Across segment I and III represents an event of first-order phase transition. Across segment II implies that γ-Ce becomes unstable. |
In a recent work,[22] Lipp et al. reported that the data of minimum in bulk modulus seems to imply that the commonly known phase boundary (segment I in this work) would continue toward the nearby region with minimum melting. This contradicts our prediction. However, it remains unclear what would be across the critical boundary (segment II). An intermediate meta-stable phase or some kind of pseudo-alloy[21,22,32] might explain their experiments.
In addition, at room temperature (298 K), our EOS predicts that the γ → α transition occurs at 0.71 GPa accompanied by a 17.7% volume collapse and a 1.56 KB/atom entropy change. This is in good agreement with experimental values of 0.7 GPa, 17%, and 1.54 KB/atom.[11–13,20]
In conclusion, high-precision two-phase equations of state for γ- and α-Ce were constructed to clarify puzzling problems and controversies about their phase diagram. Versus previous works, more attention was paid to the strong anharmonic effects of the ions that have been generally observed in rare elements. The variation in the magnetic moment of the γ-Ce atom has also been considered. The new EOS generally agrees well with experimental data regarding thermodynamics, phase diagrams, and phase transitions.
Moreover, the new EOS indicates that another segment of phase boundary for γ- and α-Ce (segment III in Fig.
| 1 | |
| 2 | |
| 3 | |
| 4 | |
| 5 | |
| 6 | |
| 7 | |
| 8 | |
| 9 | |
| 10 | |
| 11 | |
| 12 | |
| 13 | |
| 14 | |
| 15 | |
| 16 | |
| 17 | |
| 18 | |
| 19 | |
| 20 | |
| 21 | |
| 22 | |
| 23 | |
| 24 | |
| 25 | |
| 26 | |
| 27 | |
| 28 | |
| 29 | |
| 30 | |
| 31 | |
| 32 | |
| 33 | |
| 34 | |
| 35 | |
| 36 | |
| 37 | |
| 38 | |
| 39 | |
| 40 | |
| 41 | |
| 42 | |
| 43 | |
| 44 | |
| 45 | |
| 46 | |
| 47 | |
| 48 |