Zhang Lin†,  , Li Ying-Hua, Li Xue-Mei, Zhang Zu-Gen, Ye Xiang-Ping, Cai Ling-Cang
, Li Ying-Hua, Li Xue-Mei, Zhang Zu-Gen, Ye Xiang-Ping, Cai Ling-Cang Phase diagram. Experimental data regard to the phase boundary between
|
Zhang Lin†,
, Li Ying-Hua, Li Xue-Mei, Zhang Zu-Gen, Ye Xiang-Ping, Cai Ling-Cang |
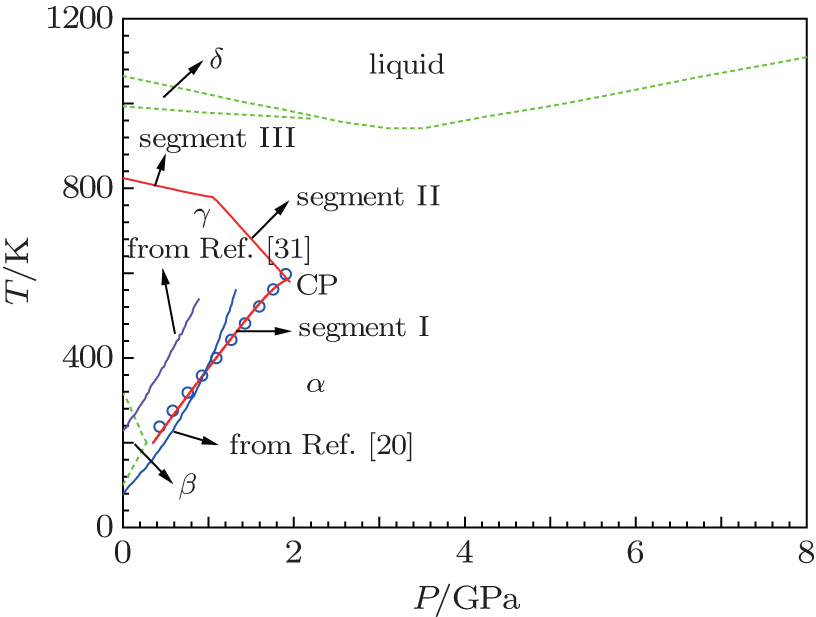
Phase diagram. Experimental data regard to the phase boundary between |
| |