Understanding oxygen reactions in aprotic Li-O 2 batteries
Ma Shunchao 1, 2, †, , Zhang Yelong 1, 2, †, , Cui Qinghua 1, 2 , Zhao Jing 1, 2 , Peng Zhangquan 1, ‡,
State Key Laboratory of Electroanalytical Chemistry, and Institute of Applied Chemistry, Chinese Academy of Sciences, Changchun 130022, China
University of Chinese Academy of Sciences, Beijing 100039, China


† These authors contributed equally.

‡ Corresponding author. E-mail: zqpeng@ciac.ac.cn

Project supported by the Recruitment Program of Global Youth Experts of China, the Strategic Priority Research Program of the Chinese Academy of Sciences (Grant No. XDA09010401), the Science and Technology Development Program of Jilin Province, China (Grant No. 20150623002TC), and the Natural Science Foundation of Jiangsu Province, China (Grant No. BK20131139).

Abstract
Abstract

Although significant progress has been made in many aspects of the emerging aprotic Li-O 2 battery system, an in-depth understanding of the oxygen reactions is still underway. The oxygen reactions occurring in the positive electrode distinguish Li-O 2 batteries from the conventional Li-ion cells and play a crucial role in the Li-O 2 cell’s performance (capacity, rate capability, and cycle life). Recent advances in fundamental studies of oxygen reactions in aprotic Li-O 2 batteries are reviewed, including the reaction route, kinetics, morphological evolution of Li 2 O 2 , and charge transport within Li 2 O 2 . Prospects are also provided for future fundamental investigations of Li-O 2 chemistry.

1. Introduction

Aprotic Li-O 2 batteries have much greater gravimetric energy density than the traditional Li-ion technologies, making them promising candidates for future energy storage systems. [ 1 9 ] The aprotic Li-O 2 battery, initially introduced by Abraham et al ., [ 10 ] is typically composed of a Li metal anode, an aprotic Li + electrolyte, and an air cathode, in which the active material (O 2 ) of the cathode is drawn from the atmosphere. Currently, the aprotic Li-O 2 battery development encounters substantial scientific and technological challenges that impede its practical applications including high charging over-potential (which limits round-trip efficiency), [ 11 , 12 ] poor stability of cathodes and electrolytes (which decreases cycle life), [ 13 15 ] deposition of insulating Li 2 O 2 product (which degrades the cell’s capacity), [ 16 , 17 ] and safety issues associated with Li metal anodes. [ 18 , 19 ] Most of these challenges are related to the oxygen reactions occurring in the positive electrodes of the aprotic Li-O 2 cells. Therefore, to tackle these issues effectively, an in-depth understanding of the oxygen reaction mechanisms is crucial. In this review, we summarize a few fundamental aspects of the oxygen electrode reactions in aprotic Li-O 2 batteries, including the reaction route, kinetics, morphological evolution of Li 2 O 2 and charge transport within Li 2 O 2 .

2. Oxygen reduction reactions (ORRs) in aprotic Li-O 2 batteries
2.1. ORR mechanisms

Without considering any of the possible parasitic side reactions, the fundamental chemistry of an aprotic Li-O 2 battery during discharge undergoes these possible elementary reactions: [ 20 24 ]

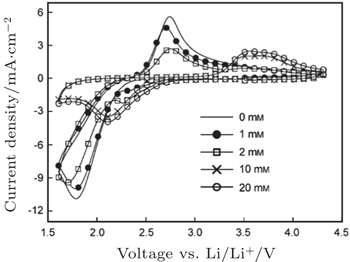
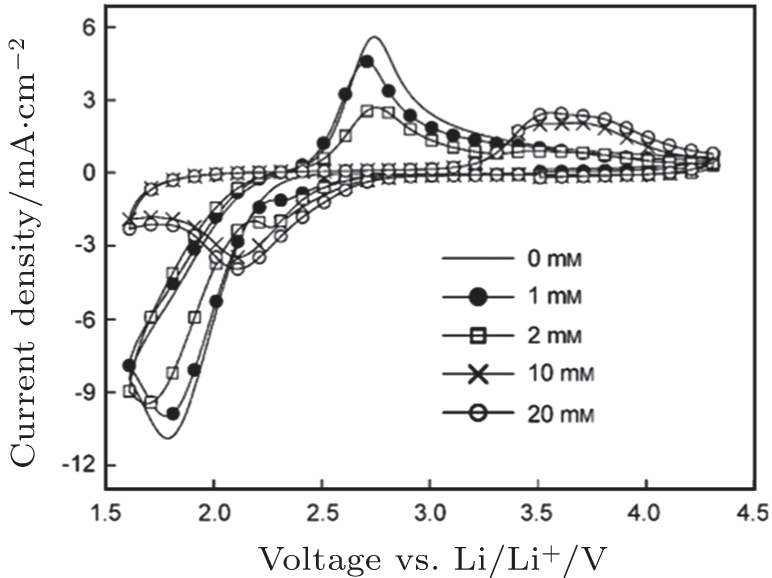
To identify the ORR mechanisms in aprotic Li-O 2 cells, several research groups investigated the ORRs with multiple techniques including voltammetry, [ 20 23 ] electrochemical surface-enhanced Raman spectroscopy (EC-SERS), [ 24 26 ] differential electrochemical mass spectrometry (DEMS), [ 27 ] etc. For instance, Laoire et al . studied ORRs in various organic solvents (such as acetonitrile [ACN] and dimethylsulfoxide [DMSO]) containing various cations (such as tetrabutylammonium [TBA + ] and alkali metal ions of Li + , Na + , and K + ) using cyclic voltammetry. [ 20 , 21 ] Meanwhile, the reaction between and Li + was also investigated by Peng et al. (Fig.  1 ). With the addition of Li + , the reduction peak appears at higher potentials, and with increasing Li + concentration, the magnitude of the new peak increases at the expense of the area under the original O 2 reduction peak, meaning that electrochemical reduction is followed by a chemical step. This subsequent chemical reaction severely depletes the amount of , leading to a shift of the potential toward higher voltages. These observations are consistent with the proposed ORR mechanisms illustrated by Eqs. ( 1 )–( 4 ), i.e., O 2 is first reduced to intermediate via a one-electron process (Eq. ( 1 )), the binds with Li + ions forming LiO 2 , an unstable intermediate (Eq. ( 2 )). Then, LiO 2 further transforms to Li 2 O 2 through either electrochemical reduction (Eq. ( 3 )) or chemical disproportionation (Eq. ( 4 )). Abraham et al . also used hard soft acid base (HSAB) theory to clarify this ORR process. According to the HSAB theory, alkali metal cations such as Li + ions, which represent hard acids, cannot efficiently stabilize , a relatively soft base. Hence, the unstable intermediate LiO 2 is prone to disproportionation, forming Li 2 O 2 , because is a strong base. [ 20 , 21 , 28 ]

Fig. 1. Cyclic voltammetry at a roughened Au electrode in O 2 saturated 0.1 MnBu 4 NClO 4 in CH 3 CN containing various concentrations of LiClO 4 as indicated. The scan rate was 1 V·s –1 . [ 24 ]

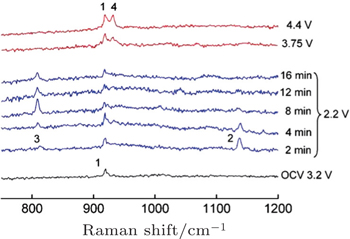
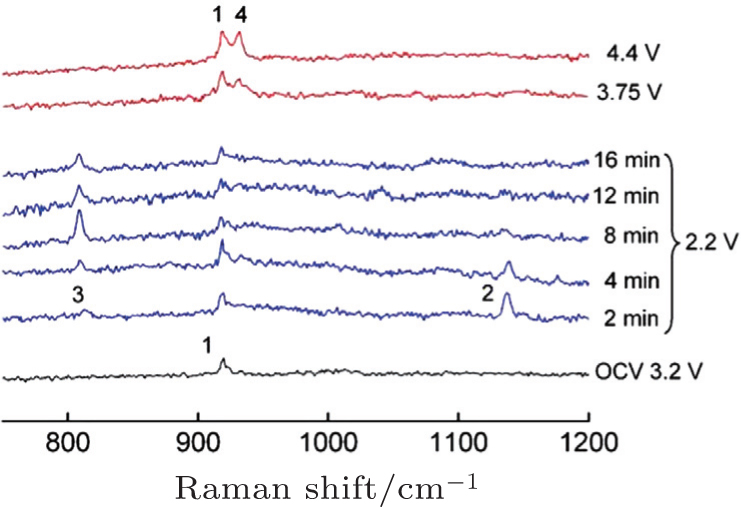
The proposed ORR mechanisms (Eqs. ( 1 )–( 4 )) were investigated by Peng et al . using EC-SERS. [ 24 ] With this spectroscopy-based technique, the reaction products and intermediates, which are crucial to the formulation of the ORR mechanisms in the aprotic Li + electrolyte, were identified directly. As shown in Fig.  2 , at the initial stage of ORRs, two newly formed species, LiO 2 (peak 2) and Li 2 O 2 (peak 3), can be identified; they are absent at open circuit potential, where no ORR takes place. Moreover, with the elapse of time, the signal associated with LiO 2 gradually decreases and vanishes, and only the signal of Li 2 O 2 remains. These observations clearly demonstrate that the unstable LiO 2 can transform to Li 2 O 2 via disproportionation, supporting the reaction mechanisms of either Eqs. ( 1 ), ( 2 ), and ( 4 ) or Eqs. ( 2 ) and ( 4 ).

Fig. 2. In situ SERS during O 2 reduction and re-oxidation on Au in O 2 -saturated 0.1 M LiClO 4 –CH 3 CN. Spectra collected at a series of times and at the reducing potential of 2.2 V versus Li/Li + followed by other spectra at the oxidation potentials shown. The peaks are assigned as follows: 1) C–C stretch of CH 3 CN at 918 cm –1 , 2) O–O stretch of LiO 2 at 1137 cm –1 , 3) O–O stretch of Li 2 O 2 at 808 cm –1 , and 4) Cl–O stretch of at 931 cm –1 . [ 24 ]

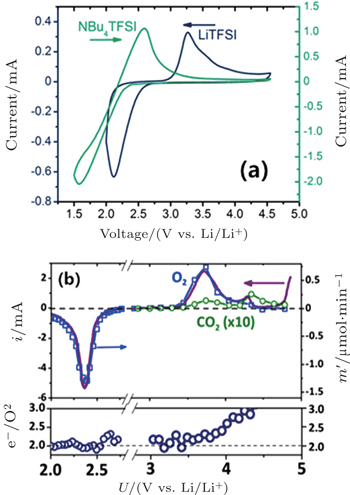
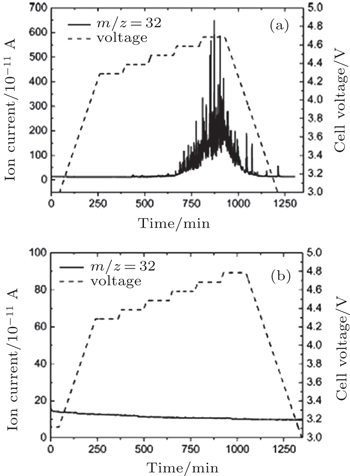
In addition, McCloskey et al . employed cyclic voltammetry (CV) and differential electrochemical mass spectrometry (DEMS) to study the oxygen reactions in aprotic Li-O 2 cells with a lithium bis(trifluoromethanesulfonyl)imide(LiTFSI)-dimethoxyethane (DME) electrolyte. [ 27 ] Interestingly, only one peak for ORRs was observed (Fig.  3(a) ). Their observations differ from many published results that demonstrated multiple peaks of ORRs in the cyclic voltammograms (CVs) and those peaks were attributed to one-electron processes. [ 20 , 21 ] McCloskey et al . argued that the extra reduction peaks in CVs are due to the presence of impurities, e.g., H 2 O. Moreover, the ∼2e /O 2 process forming Li 2 O 2 has been confirmed by DEMS experiments, as exhibited in Fig.  3(b) . This means that once the LiO 2 is formed, it quickly transforms to Li 2 O 2 by reaction (Eq. ( 3 )) or reaction (Eq. ( 4 )), and it cannot be thermodynamically stable, contrary to the suggestions of others. [ 20 , 22 24 ]

Fig. 3. (a) CVs showing O 2 reduction and re-oxidation in 0.5 M NBu 4 TFSI (green, right ordinate) and 1 M LiTFSI (blue, left ordinate). (b) Linear sweep voltammetry at 0.5 mV/s using the DEMS cell (XC 72 carbon cathode, 1 M LiTFSI in DME). The solid line is the current, and the points are O 2 (and CO 2 ) measured by the DEMS. e /O 2 was determined by comparing the current to the moles of O 2 consumed or evolved. [ 27 ]

Early CV studies of ORRs in aprotic solvents reported by Laoire et al . are excellent, but the reaction products and intermediates cannot be identified with certainty by these conventional electrochemical methods; [ 28 ] therefore, the mechanisms that were proposed based on CV measurements are questionable. The extra peaks of ORRs in CVs may be due to the existence of H 2 O in the electrolyte, as suggested by a recent work, [ 29 ] and the effects of residual H 2 O (or any proton sources) need further clarification. By EC-SERS, the ORR intermediate LiO 2 has been detected directly, which is very beneficial for the formulation of the ORR mechanisms. Spectroscopy-based techniques will continue to play a key role in better understanding the ORRs in various aprotic Li-O 2 batteries that incorporate a broad range of aprotic electrolyte solvents. However, DEMS experiments demonstrate that an overall two-electron process is obtained within the time resolution (seconds) of this technique, which means that LiO 2 may not be a stable intermediate and could rapidly transform to Li 2 O 2 . This contradiction between the DEMS and SERS results needs further study. So far, there is no consensus on the path of LiO 2 transformation to Li 2 O 2 under the conditions of Li-O 2 cell operation, i.e., whether it is dominated by electrochemical reduction or chemical disproportionation. Further investigations are urged, seeking a better understanding of ORRs in aprotic Li-O 2 batteries.

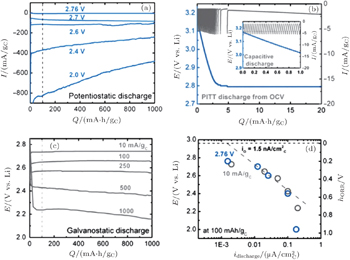
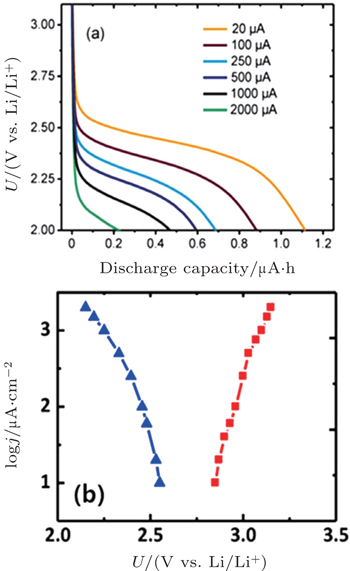
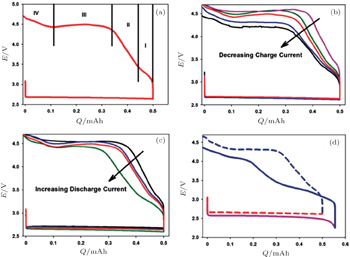
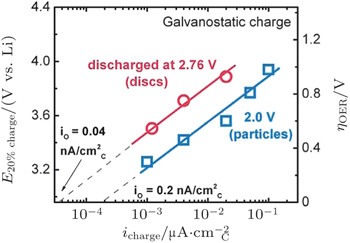
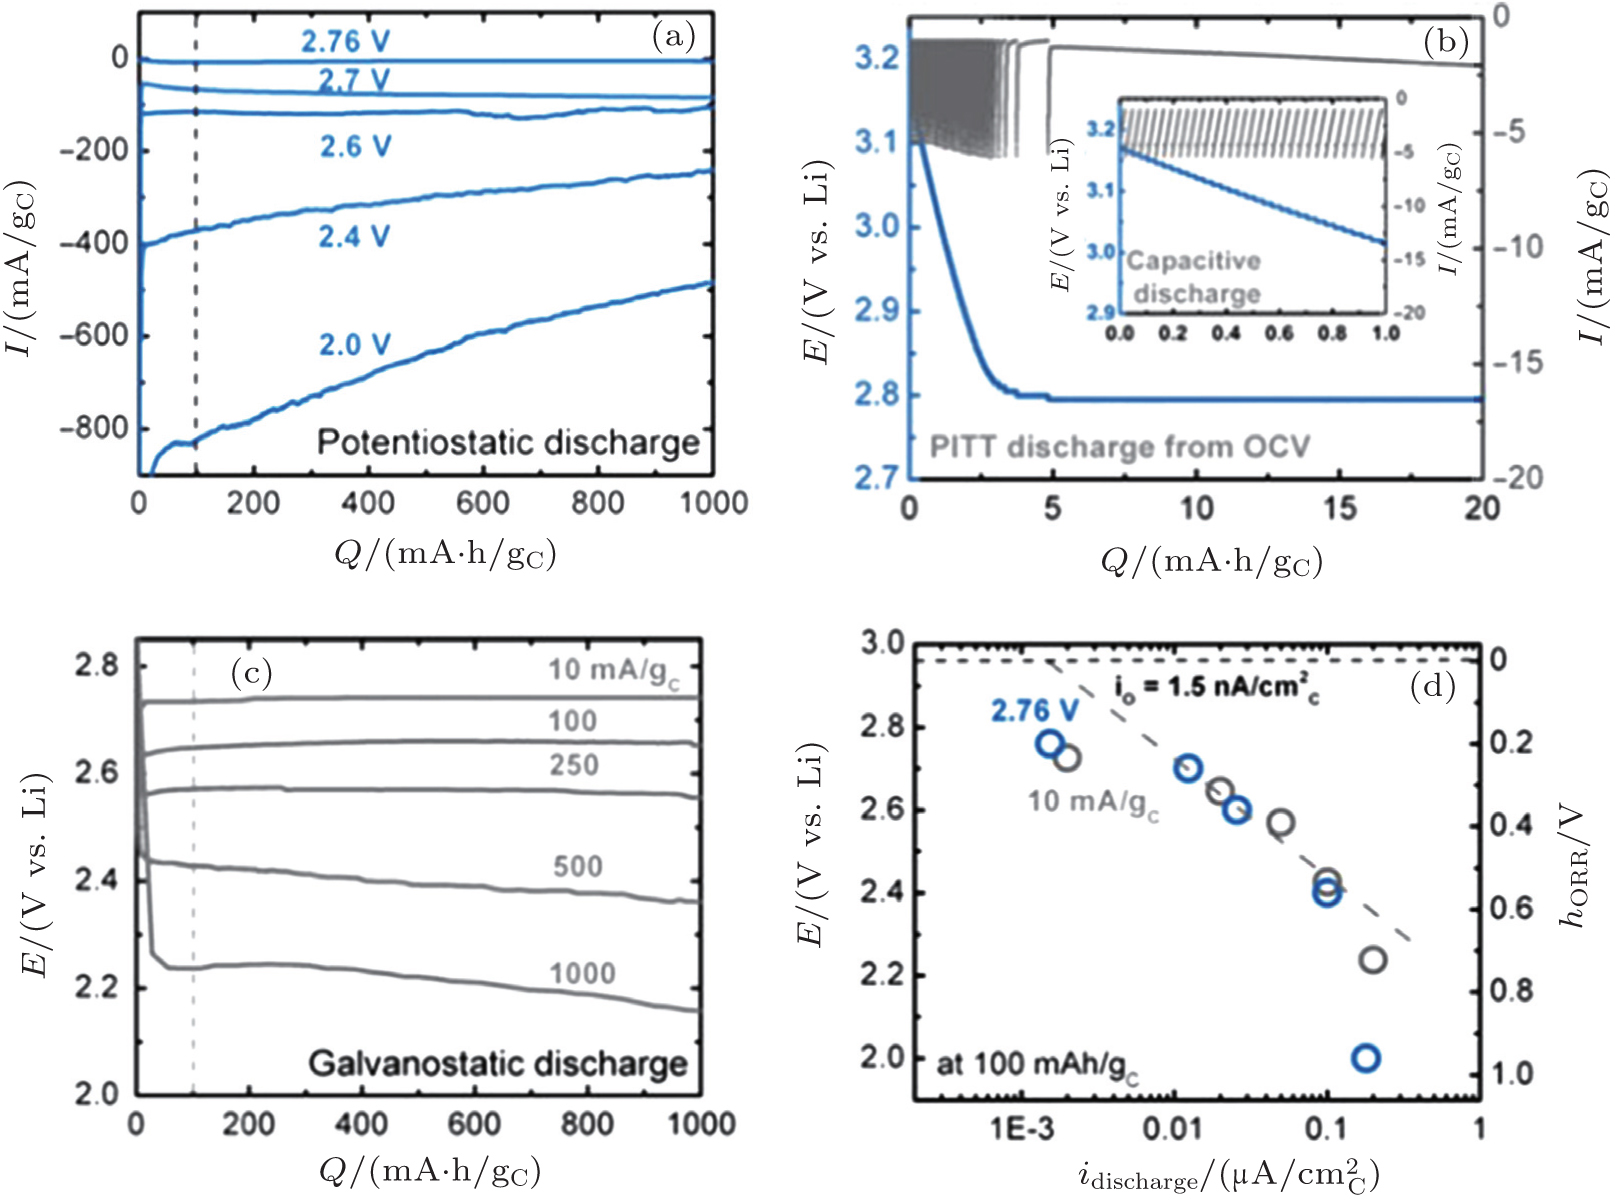
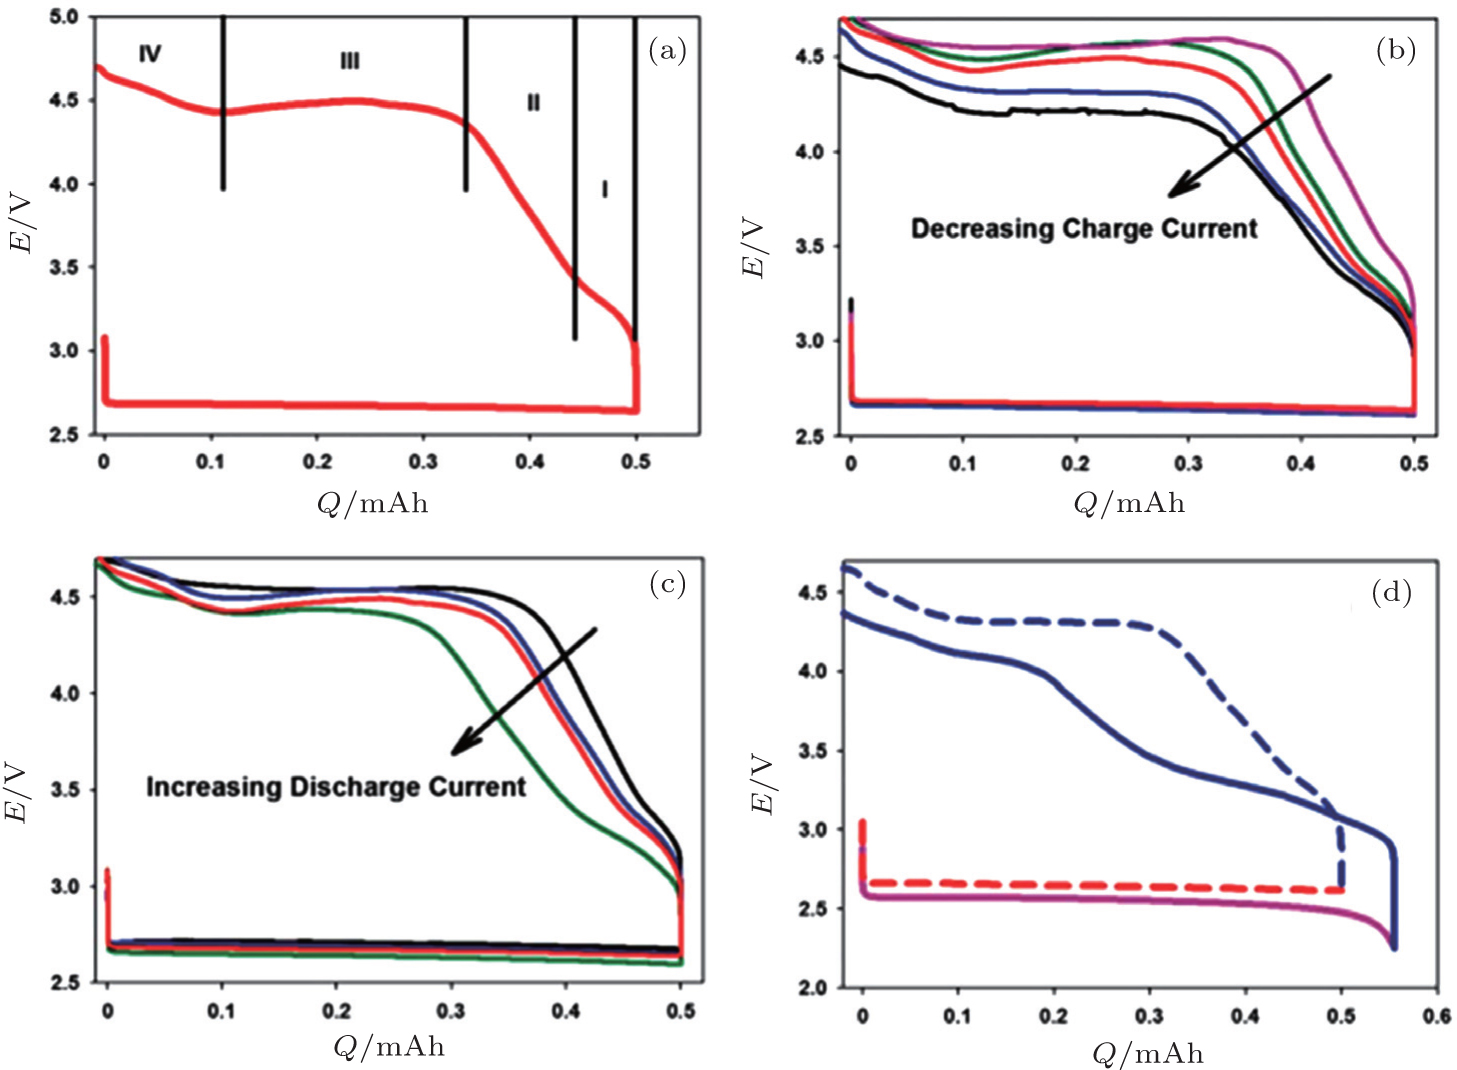
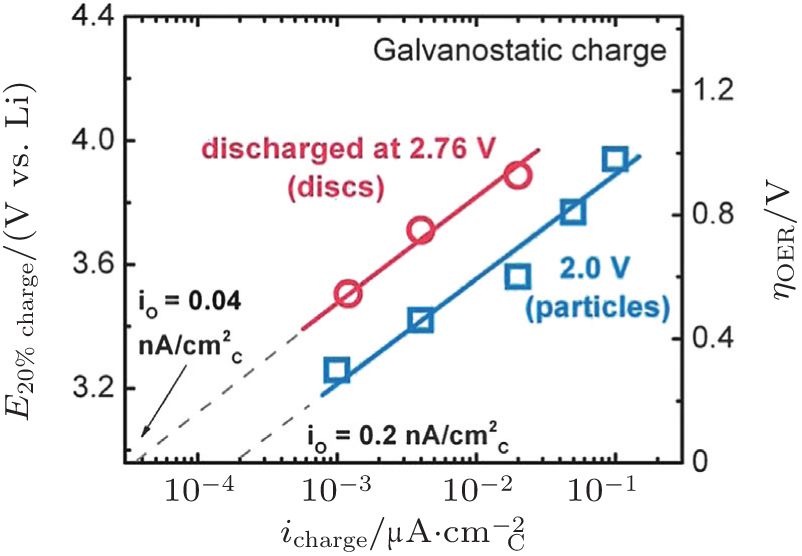
2.2. ORR kinetics

Understanding the intrinsic ORR kinetics and transport limitations associated with Li 2 O 2 formation is crucial to the development of aprotic Li-O 2 batteries with the desired rate capabilities. To explore ORR kinetics, Gallant et al . investigated the ORR over-potentials on a carbon nanotube-based cathode by using galvanostatic and potentiostatic intermittent titration (PITT) techniques. [ 30 ] Under potentiostatic conditions, the average current increases in magnitude as the voltage is reduced from 2.76 V to 2.0 V (Fig.  4(a) ). The acquired 2.76 V is the maximum potential at which nucleation of Li 2 O 2 on CNTs occurs, corresponding to the PITT discharge at open circuit potential, as shown in Fig.  4(b) . These results were further validated by a galvanostatic discharge test (Fig.  4(c) ). Moreover, the discharge potential plateaus present a linear relationship with log i galvano , described in a Tafel curve (Fig.  4(d) ), confirmed with a kinetically controlled ORR procedure. Notably, the measured Tafel slope differs from the reported results for other types of cathodes. [ 31 ] Although the physical origin of this difference is not understood, the different Tafel slopes observed on various carbon surfaces at low Li 2 O 2 coverage may reflect different nucleation kinetics of Li 2 O 2 .

Fig. 4. (a) Current vs. capacity of CNT electrodes discharged potentiostatically over a range of potentials between 2.0 V and 2.76 V. (b) PITT discharge of CNT electrodes from an open circuit (∼ 3.15 V) with a voltage step of 5 mV and a current cutoff per step of 1 mA/g C . Inset: zoom-in of the PITT response in the capacity range below 1 mA·h/g C , where the current corresponds to only capacitive discharge. (c) Voltage vs. capacity of CNT electrodes discharged galvanostatically between 10 mA/g C and 1000 mA/g C . (d) Tafel plot of voltage vs. carbon true surface area-normalized current for electrodes discharged potentiostatically (blue circles) from (a) and galvanostatically (gray circles) from (c). [ 30 ]

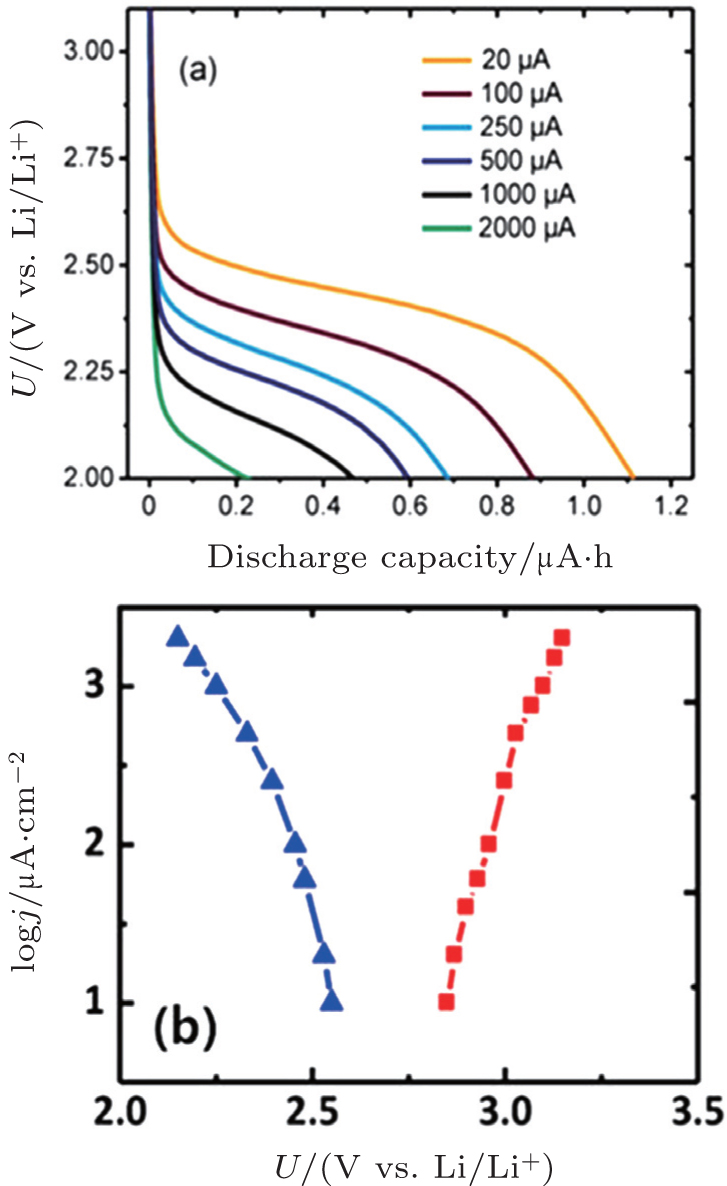
Many studies of discharge behavior and kinetic process using typical Swagelok-type cells with carbon cathodes were reported in the literatures, [ 30 , 31 ] however, Viswanathan et al . argued that these results may fully mask the fundamental kinetic behavior due to the cell’s intrinsic impedance. It is critical to eliminate the cell iR drop for measuring the fundamental kinetic over-potential. Therefore, Viswanathan and associates estimated the kinetic over-potentials by using a bulk electrolysis cell with a flat, polished, small-surface glassy carbon (GC) electrode. [ 32 ] Figure  5(a) shows galvanostatic discharge plots of Li-O 2 cell at various current densities i in the bulk electrolysis cell. The initial drop in potential is attributed to the kinetic over-potential, a linear decrease in potential with Q dis is ascribed to an iR drop through the thickening Li 2 O 2 film on the GC surface, and a “sudden death” is characterized by a rapid decrease in U . These authors discussed only the initial drop of potential U and its i dependence to probe the real kinetic behavior, because charge transport limitations for Li 2 O 2 growth dominate the electrochemistry during the later discharge. Figure  5(b) is the Tafel plot for the cell’s cycle, wherein it is plain to see that the kinetic over-potentials for discharge and recharge procedures are extremely small. These results imply that the electrical efficiency of a Li-O 2 battery is high in a discharge-recharge cycle if the battery is limited only by the kinetic over-potential.

Fig. 5. (a) Output potential during Li-O 2 galvanostatic discharge in the bulk electrolysis cell at the current densities given in the legend. (b) Experimental Tafel plots for Li-O 2 discharge (ORR, blue triangles) and for charging following discharge (OER, red squares). [ 32 ]
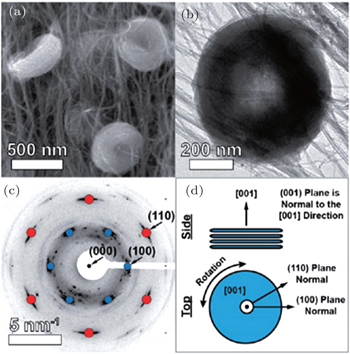
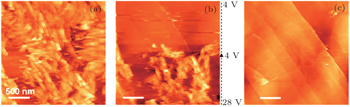
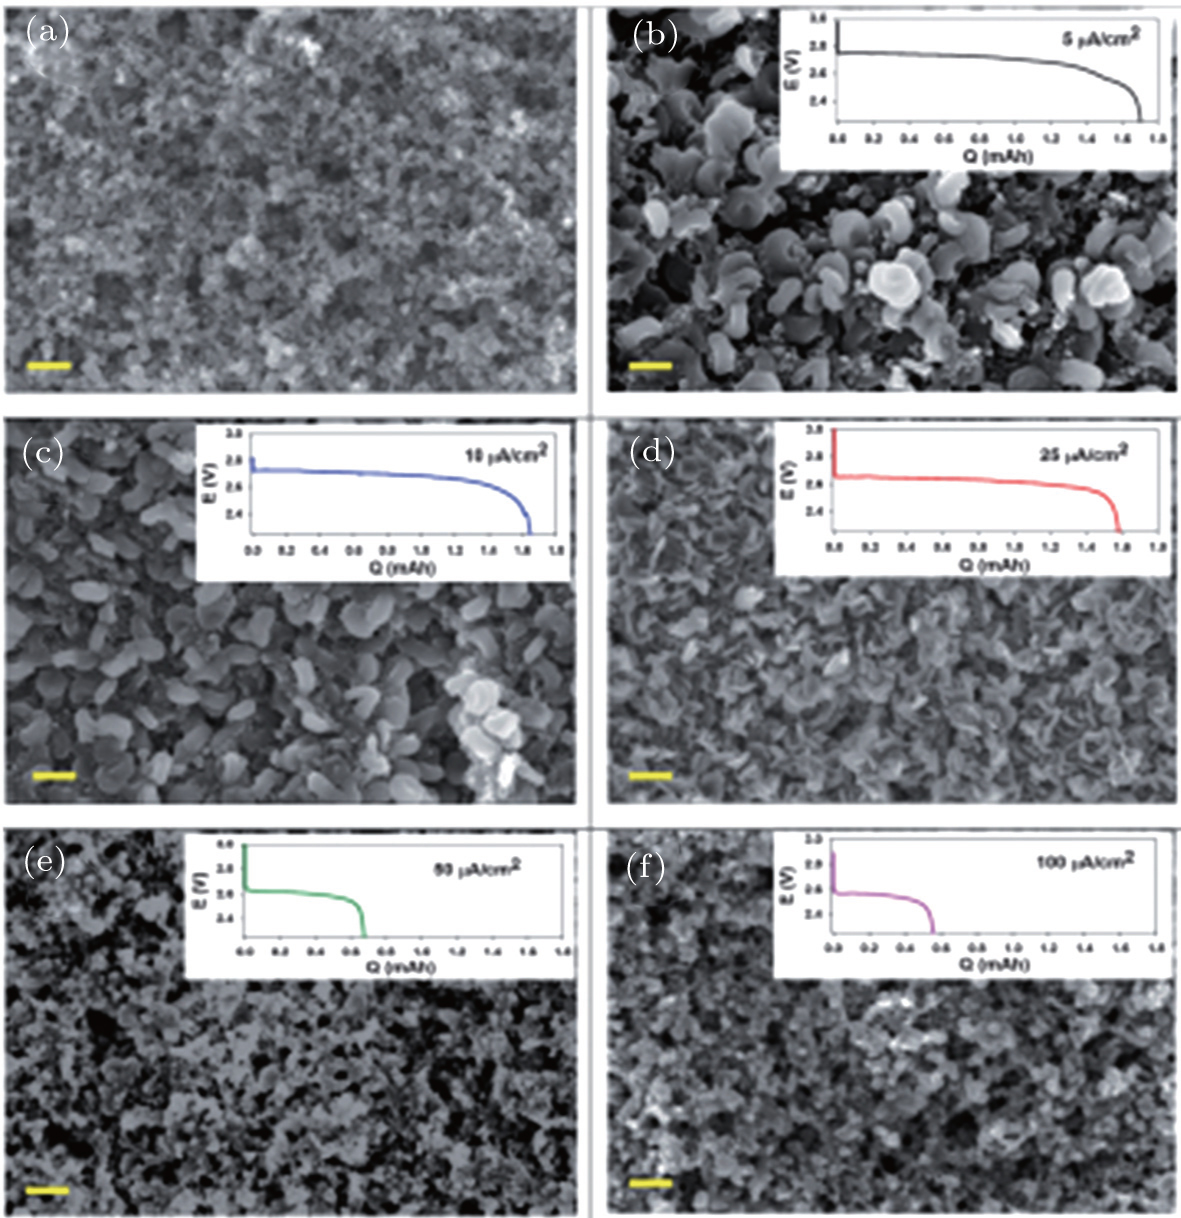
2.3. Li 2 O 2 morphology

The reported morphology of Li 2 O 2 formed on a cathode is also controversial. Viswannathan et al . reported homogeneous films of Li 2 O 2 deposited on a small-surface GC cathode in an electrolysis cell, observed by atomic force microscopy (AFM). [ 33 ] Adams et al . also observed the formation of a quasi-amorphous peroxide film at high current rates, as shown in Figs.  6(e) and (f). [ 16 ] However, at low current rates, toroid-shaped Li 2 O 2 products have been found (Figs.  6(b) 6(d) ) on a pristine carbon cathode (Fig.  6(a) ). Obtaining such small, poorly crystalline particles at high current density was ascribed to the direct second electro-reduction pathway (Eq. ( 3 )) due to the stronger adsorption of LiO 2 onto the Li 2 O 2 substrate at this high current rate. [ 16 ]

Fig. 6. FESEM images at a magnification of 20000 of (a) the pristine cathode and after full discharge at (b) 5 mA/cm 2 , (c) 10 mA/cm 2 , (d) 25 mA/cm 2 , (e) 50 mA/cm 2 , and (f) 100 mA/cm 2 , with the corresponding discharge curves shown as insets. Scale bar = 400 nm. [ 16 ]

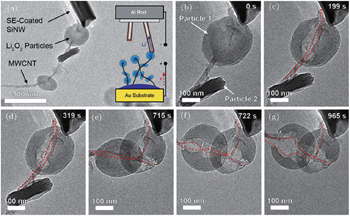
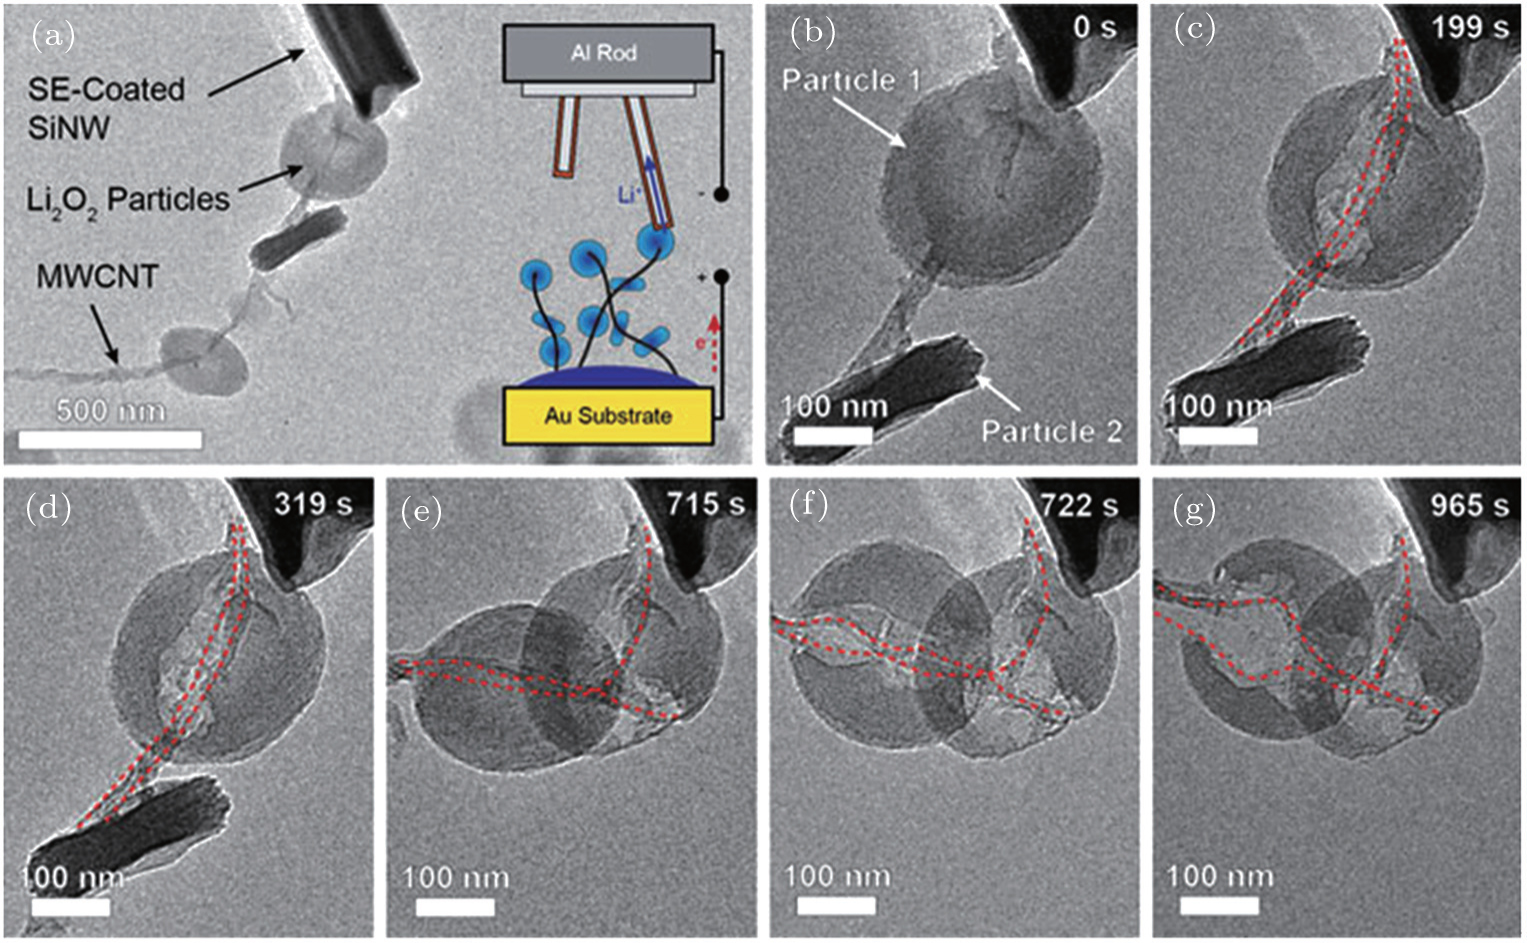
Other researchers also reported that the toroid-like Li 2 O 2 particles are formed on various types of carbon cathodes, especially at low discharge current density. [ 30 , 34 , 35 ] For instance, Shao-Horn and colleagues revealed the morphology evolution of these toroid-like products by using transmission electron microscopy (TEM), the formation originally began with the nucleation of small particles on the side wall of CNT and evolved upon continued discharge. The TEM investigation also showed that these toroids are highly crystalline with the Li 2 O 2 (0001) facet normal to the axis of the toroid as shown in Fig.  7 . It is worth noting that this observation of toroids has triggered much controversy about ORR mechanisms in aprotic Li-O 2 batteries, because the morphology is totally different from the films observed in an electrolysis cell, and the toroid-like Li 2 O 2 particles with poor electrical conductivity and large size (several hundred nanometers) can be electrochemically oxidized. In a recent work, the formation of the Li 2 O 2 toroids was ascribed to the existence of H 2 O impurity, [ 29 ] i.e., H 2 O induces some solubility of LiO 2 due to its high acceptor number, which helps validate the solution mechanism for Li 2 O 2 formation proposed by others. [ 16 ]

Fig. 7. Electron diffraction investigation of individual Li 2 O 2 particles. (a) SEM and (b) bright-field TEM images of toroid particles. (c) Simulated Li 2 O 2 [001] zone axis superimposed over an experimental diffraction pattern for the particle pictured in panel (b). (d) Side-view and top-view schematics of a stack of crystallite plates. [ 34 ]
3. Oxygen evolution reactions (OER) in aprotic Li-O 2 batteries
3.1. OER mechanisms

Understanding the Li 2 O 2 oxidation reactions is also crucial to the development of Li-O 2 cells with high energy efficiency and long cycle life. However, the Li 2 O 2 decomposition reactions at the cathode are complex and have not been fully understood so far. As for ORRs, the following mechanisms for Li 2 O 2 oxidation reactions have been proposed: [ 24 , 30 , 31 , 36 38 ]

The electrochemical decomposition of Li 2 O 2 to Li + and O 2 (Eq. ( 5 )) during charging has been qualitatively demonstrated by Ogasawara et al . [ 36 ] using in situ DEMS that showed the expected O 2 evolution. This work is the first piece of experimental evidence about the reversibility of the aprotic Li-O 2 cells, and it indicates the possibility of the successful operation of a rechargeable Li-O 2 battery (Fig.  8 ). To explore OER mechanisms directly, in situ SERS and DEMS studies were conducted by Peng et al . [ 24 ] Figure  2 shows the EC-SERS results of Li 2 O 2 decomposition, in addition to its formation. After applying a reducing potential of 2.2 V until only Li 2 O 2 was presented, the potential was switched to 3.75 V then to 4.4 V to decompose Li 2 O 2 . The SERS spectra collected at these oxidation potentials showed no evidence of LiO 2 , indicating that Li 2 O 2 decomposed directly to O 2 and Li + without passing through LiO 2 as an intermediate. Quantitative DEMS study showed the results of a Li 2 O 2 electrode charged with successive current steps (Fig.  9 ). As the current is increased, a concomitant increase occurs in both the cell potential and the m / z = 32 signal, due to the O 2 evolution on decomposing Li 2 O 2 during charging. DEMS results revealed that Li 2 O 2 decomposes directly in an one-step process to O 2 , that is, through reaction ( 5 ), which is consistent with the SERS results.

Fig. 8. Variation of ion current corresponding to O 2 evolution as a function of time. The voltage was increased by 100 mV every 120 min. (a) Electrode with Li 2 O 2 and (b) electrode without Li 2 O 2 . [ 36 ]
Fig. 9. Differential electrochemical mass spectrometry on oxidation of Li 2 O 2 , signal for m / z = 32 (O 2 ) and m / z = 44 (CO 2 ) in response to stepwise increase in oxidation current. Inset: m / z = 32 signal as a function of oxidation current, showing proportional relationship. [ 24 ]

However, Lu and Shao-Horn [ 31 ] speculated that the rising potential in the oxidation process is due to different mechanisms for OER (Fig.  10 ): a low over-potential process corresponds to Li de-intercalation at the surface (Eq. ( 6 )) followed by chemical disproportionation (Eq. ( 8 )), and a higher over-potential mechanism for an unspecified bulk oxidation process (Eq. ( 5 )). Gallant et al . [ 30 ] also proposed an alternative route for the Li 2 O 2 oxidation process, as shown in Fig.  11 : the lower over-potential is simply attributed to the 1e de-lithiation process; and the subsequent higher potential plateau is attributed to the oxidation of bulk Li 2 O 2 . In recent studies, Yang et al . [ 37 ] observed the existence of LiO 2 -like species in discharged products. These LiO 2 -like species were ascribed to the superoxide-like oxygen rich surfaces of Li 2 O 2 and/or small Li 2 O 2 clusters, indicating a possible reaction (Eq. ( 7 )). However, the decomposition path of Li 2 O 2 through LiO 2 has not been clarified, and the most compelling argument against these mechanisms is simply that they cannot be shown to agree with DEMS results, which show an e /O 2 ∼ 2 process (Eq. ( 5 )) for charging. Thus, we still have the key puzzle regarding the true mechanisms of OER in aprotic Li-O 2 batteries.

Fig. 10. Proposed reaction mechanism of Li-O 2 recharge. The OER process associated with stage I (sloping and catalyst-insensitive) is attributed to a de-intercalation process via a solid-solution route from the outer part of Li 2 O 2 to form LiO 2 -like species on the surface (Li 2 O 2 → LiO 2 + Li + + e ), where LiO 2 -like species disproportionate to evolve O 2 (LiO 2 + LiO 2 → Li 2 O 2 + O 2 ), yielding an overall 2e /O 2 OER process (Li 2 O 2 → 2Li + + O 2 + 2e ). The OER process at the flat potential plateau (stage II) is attributed to the oxidation of bulk Li 2 O 2 particles to form Li + ions and O 2 (Li 2 O 2 → 2Li + + 2e + O 2 ) via a two-phase transition. Lastly, a rising charge plateau after stage II has been assigned to the decomposition of carbonate-type byproducts and electrolyte. [ 31 ]
Fig. 11. Proposed charging processes for Li 2 O 2 , with disc (gray/red, typical dimensions ∼ 50 to 200 nm) or particle (gray/blue, typical dimensions < 20 nm) morphologies overlaid. Discs’ surfaces are largely O-rich (0001) with LiO 2 -like surface species, while particles consist of less O-rich (more stoichiometric) Li 2 O 2 surfaces. During the initial stage of charging (to ∼ 800 mA·h/g C for discs and to ∼ 600 mA·h/g C for particles), both discs and particles exhibit a sloping voltage profile attributed to solid solution-like surface de-lithiation. Upon further charging, discs and particles exhibit a voltage plateau at ∼ 3.4 V vs. Li, corresponding to bulk oxidation via a two-phase process, e.g., between Li 2 O 2 and LiO 2 . [ 30 ]
3.2. OER kinetics

Another key challenge of the aprotic Li-O 2 batteries is their high recharging over-potential (usually > 1 V), [ 39 43 ] corresponding to slow kinetics and easily leading to serious side reactions. So it is imperative to understand the kinetics of Li 2 O 2 oxidation in aprotic Li + electrolytes. The kinetics of OER is affected by the current density and morphology of the discharge products. Adams et al . [ 16 ] demonstrated that the current density of discharge indirectly influences the charging over-potential by determining the nature and morphology of the Li 2 O 2 . The charging profiles (Fig.  12(a) ) exhibit four regions characterized by distinct differences in slope. Figure  12(b) shows the results of the Li-O 2 cells that were discharged at the same density of 25 mA/cm 2 and then recharged at various rates. All charging profiles are lowered in over-potential with decreasing charging current density. Figure  12(c) shows that a gradual increase of discharge current also leads to a lower potential region I during charging. The faster discharge yields a charge profile with an extended region I at low potential comparing to the slower discharge (Figure  12(d) ).

Fig. 12. (a) A discharge–charge curve showing the regions of the charge portion; (b) cells discharged at 25 mA/cm 2 and then charged at different rates from 5–100 mA/cm 2 (colors of curves listed below); (c) cells discharged at different rates from 5–50 mA/cm 2 (colors of curves listed below) and then charged at 25 mA/cm 2 ; and (d) comparison of a cell fully discharged at 100 mA/cm 2 (pink curve) and then charged at 10 mA/cm 2 with a cell discharged at 25 mA/cm 2 to a similar capacity (red dotted curve) and then charged at 10 mA/cm 2 . In panels (b) and (c), black = 5 mA/cm 2 , blue = 10 mA/cm 2 , red = 25 mA/cm 2 , green = 50 mA/cm 2 , and pink = 100 mA/cm 2 . [ 16 ]

Recently, Lu et al . [ 31 ] investigated the reaction kinetics of the charging reactions of aprotic Li-O 2 batteries and found that the OER kinetics is much slower than ORR in Li-O 2 batteries. During Li-O 2 battery charging, OER occurs at high over-potentials (0.4–1.2 V), where the kinetics is sensitive to discharge/charge rates and catalysts, which can be ascribed to the oxidation of bulk Li 2 O 2 particles (Fig.  10 ). Mitchell et al. [ 44 ] also investigated the rate dependence of the OER over-potential of small particles, plotting the potential after the first 200 mA·h/g C of charge versus the carbon true surface area normalized current, in a Tafel plot (Fig.  13 ). The Tafel slope related to charging of small particles was ∼ 340 mV per decade. The exchange current density of the OER kinetics of small Li 2 O 2 particles was which is an order of magnitude smaller than noted on discharge. Viswanathan et al . [ 32 ] compared the unusual experimental Tafel plots with those obtained by first-principles theory and proposed that minimizing the cell impedance is a more important issue than the intrinsic OER kinetics for developing high rate aprotic Li-O 2 cells (Fig.  5(b) ).

Fig. 13. Tafel plot of galvanostatic charge voltage vs. carbon true surface area-normalized current for electrodes discharged under potentiostatic conditions at 2.76 V or 2.0 V vs. Li to 1000 mA·h/g C . The right-hand axis shows the OER over-potential referenced to the thermodynamic potential of Li 2 O 2 , E o (Li 2 O 2 ) = 2.96 V vs. Li. [ 44 ]
3.3. Morphology evolution during Li 2 O 2 decomposition

A few in situ and ex situ research facilities having the ability to visualize the Li-O 2 reaction with nanometer resolution were employed to have a closer look at the charging process. [ 31 , 43 47 ] For instance, Zhong et al . [ 35 ] initially studied the electrochemical oxidation process of Li 2 O 2 using in situ TEM. Figure  14(a) shows the in situ cell schematically assembled in a TEM chamber. The MWCNT/Li 2 O 2 positive electrode was prepared by a discharge process. A single Si nanowire electrode was brought into contact with individual Li 2 O 2 particles (Fig.  14(b) for a zoom-in view). In situ TEM imaging revealed that the preferential oxidation occurs at the MWCNT/Li 2 O 2 interface but not at the interface between Li 2 O 2 and the solid electrolyte (Figs.  14(c) 14(g) ). This observation suggests that electron transport in Li 2 O 2 ultimately limits the oxidation kinetics at very high over-potentials; however, the experiments with lower over-potentials and longer charging time need to be conducted.

Fig. 14. In situ TEM oxidation of Li 2 O 2 particles. (a) Schematic illustration of the in situ TEM microbattery superimposed over a low magnification TEM image of a solid electrolyte-coated Si nanowire contacting a single Li 2 O 2 particle. (b) Higher magnification TEM image of the particles in panel (a), showing a MWCNT bundle contacting two physically separated Li 2 O 2 particles labeled as particles 1 and 2, respectively. (c)–(g) Oxidation of particles 1 and 2 during application of a 10 V cell potential to the MWCNT/Li 2 O 2 positive electrode against the Si NW negative electrode. [ 35 ]

By constructing an all-solid-state Li-O 2 battery in an environmental scanning electron microscope, direct visualization of the discharge and charge processes of the battery was achieved by Zheng et al . [ 48 ] Different morphologies of the discharge product were observed, including spheres, conformal films, and red-blood-cell-like shapes with the particle size up to 1.5 μm; whereas upon charging, the decomposition initiated at the particle surface and continued along a certain direction, instead of from the contact point at electrode (Fig.  15 ). These findings indicate that the electron and lithium ion conductivities of Li 2 O 2 could support the growth and decomposition of the discharge product in their system.

Fig. 15. Charge processes of the Li-O 2 battery. Images captured at 0 s, 900 s, 1800 s, and 3200 s show the decomposition process of the spherical particle. Eight volts was applied on SACNT vs. Li metal to initiate the charge process. Red arrows indicate the position where the particle decomposed. Note that the electron beam was on only during image acquisition, to minimize the irradiation effect. [ 48 ]

In situ AFM has also provided clear-cut evidence for decomposition of Li 2 O 2 during the charging reaction. Real-time and in situ views of the Li 2 O 2 decomposition using electrochemical AFM (EC-AFM) are presented in Fig.  16 . [ 49 ] Details of the decomposition process have been observed at nano-/micrometer scale on a highly oriented pyrolytic graphite (HOPG) electrode. Upon charging, the Li 2 O 2 film is decomposed at the interface of Li 2 O 2 /HOPG and the decomposition potential is related to the thickness of Li 2 O 2 .

Fig. 16. In situ and sequential AFM topographic images of Li 2 O 2 nanoplates on HOPG upon OER in Li-O 2 cell. (a) Li 2 O 2 nanoplates acquired via the galvanostatic discharge at a cutoff potential of 2.2 V. (b) Potential-dependent view of HOPG electrode from 2.8 V (bottom) to 4.0 V (middle to top) at a sweeping rate of 5 mV/s. (c) Clean HOPG electrode at 4.0 V. The scale bars are 500 nm. [ 49 ]
4. Electron and ion transport in Li 2 O 2

Among relatively stable aprotic electrolytes, Li 2 O 2 has been widely identified as the main discharge product formed in the porous cathode of aprotic Li-O 2 batteries. As Li 2 O 2 is an insulator, poor conductivity eventually leads to the so called sudden death at the end of the discharge process. These observations have prompted researchers to investigate the electron and ion transport in Li 2 O 2 , which are very important for understanding the discharge and charge chemistries involved in Li 2 O 2 formation and decomposition mechanisms. [ 50 54 ] However, the mechanisms of charge transport through Li 2 O 2 remain elusive. Luntz et al. [ 54 ] presented both experimental and theoretical evidences that hole tunneling generally dominates charge transport through Li 2 O 2 in Li-O 2 discharge at practical battery current densities. Others [ 51 , 55 58 ] suggested that diffusion of isolated small polarons trapped at Li vacancies or charged defects governs the charge transport within Li 2 O 2 . Taken together, these observations motivate the understanding of the mechanism of charge transport through Li 2 O 2 mainly determined by two factors: [ 50 , 54 ] (i) the alignment of the Li 2 O 2 bands relative to the Fermi level in Li 2 O 2 in the electrochemical cell, and (ii) the formation energies, densities, and mobilities of various charged carriers (polarons, vacancies, impurities) at the battery potential.

Figure  17 shows graphically the possible electron and ion transport mechanisms related to the discharge process occurring at the cathode of a Li-O 2 battery. If the ORR process occurs at the Li 2 O 2 surface, the charge needs to transport though the discharge product (Figs.  17(a) 17(c) ). However, Li 2 O 2 , the main discharge product, is an insulator with a wide band gap of 4.2–4.5 eV. [ 55 , 56 ] Electronic conductivity is therefore considered to be a major limiter of the capacity of Li-O 2 batteries, because neither tunneling nor bulk conduction can provide appreciable current when the Li 2 O 2 film is more than ∼ 5 nm thick. [ 33 ] Likewise, defects such as surfaces, [ 57 ] interfaces, [ 58 ] grain boundaries, dislocations, and/or amorphous regions [ 16 ] can further enhance conductivity (Fig.  17(c) ) for the deposition of large discharge product particles.

Fig. 17. Possible discharge mechanisms for a Li-O 2 cell. [ 51 ]

Figure  17(d) illustrates a scenario in which ORR happens at the exposed surface of the electrode, followed by diffusion through the electrolyte or along surfaces of existing Li 2 O 2 . Obviously, the deposition of the Li 2 O 2 is not an electrochemical step but rather a chemical one. [ 56 , 59 ] Figure  17(e) illustrates a more exotic mechanism, in which the reduction happens at the buried electrode/Li 2 O 2 interface; in this case, the reactants presumably need to diffuse through the products’ grain boundaries or other extended defects.

Turning to OER, Figure  18 shows the two-stage electron and ion transport mechanism in the charging process of a Li-O 2 battery. That is, charging may initiate preferentially at a low potential (< 3.5 V) because of dissolution of thin product deposits or decomposition at/near the three-phase electrode/electrolyte/Li 2 O 2 boundary. Then, OER will conclude at a high potential in which thick Li 2 O 2 decomposes via polaron hopping. More efforts are needed to examine the various possibilities, especially for the location at which ORR and OER initiate.

Fig. 18. Proposed two-stage recharge mechanism for a Li-O 2 cell. [ 51 ]
5. Conclusion and prospects

This review summarizes the current state of knowledge and research about the fundamental aspects of the oxygen electrode reaction in aprotic Li-O 2 batteries. For the ORRs, O 2 is first reduced via a one-electron process to , which transforms to LiO 2 after binding with Li + ions and is further reduced to Li 2 O 2 through successive electrochemical reduction or chemical disproportionation. However, the oxidation of Li 2 O 2 is more complicated, and two different processes have been proposed: the de-lithiation reaction at low over-potentials, and bulk oxidation at higher over-potentials. The kinetics over-potentials for both discharge and recharge are small, regardless of the large potential losses caused by cell impedance. In addition, both hole tunneling and hole polarons contribute to charge transport through Li 2 O 2 in aprotic Li-O 2 batteries. Despite some technical challenges currently remaining, fundamental understanding of the mechanisms of oxygen electrode reactions is critical for the further development of aprotic Li-O 2 batteries.

Reference
1 Armand M Tarascon J M 2008 Nature 451 652
2 Girishkumar G McCloskey B Luntz A C Swanson S Wilcke W 2010 J. Phys. Chem. Lett. 1 2193
3 Bruce P G Freunberger S A Hardwick L J Tarascon J M 2012 Nat. Mater. 11 19
4 Peng Z Freunberger S A Chen Y Bruce P G 2012 Science 337 563
5 Lu J Li L Park J B Sun Y K Wu F Amine K 2014 Chem. Rev. 114 5611
6 Luntz A C McCloskey B D 2014 Chem. Rev. 114 11721
7 Chen Y C Xie K Pan Y Zheng C M Wang H L 2011 Chin. Phys. B 20 028201
8 Sun Y Liu L Dong J P Zhao B Huang X J 2011 Chin. Phys. B 20 126101
9 Luo G S Huang S T Zhao N Cui Z H Guo X X 2015 Chin. Phys. B 24 088102
10 Abraham K M Jiang Z 1996 J. Electrochem. Soc. 143 1
11 Débart A Paterson A J Bao J Bruce P G 2008 Angew. Chem. 120 4597
12 Ma S Sun L Cong L Cong L Gao X Yao C Guo X Tai L Mei P Zeng Y Xie H Wang R 2013 J. Phys. Chem. C 117 25890
13 Freunberger S A Chen Y Drewett N E Hardwick L J Bardé F Bruce P G 2011 Angew. Chem. Int. Ed. 50 8609
14 Chen Y Freunberger S A Peng Z Bardé F Bruce P G 2012 J. Am. Chem. Soc. 134 7952
15 OttakamThotiyl M M Freunberger S A Peng Z Bruce P G 2013 J. Am. Chem. Soc. 135 494
16 Adams B D Radtke C Black R Trudeau M L Zaqhib K Nazar L F 2013 Energy Environ. Sci. 6 1772
17 Fan W Cui Z Guo X 2013 J. Phys. Chem. C 117 2623
18 Hassoun J Croce F Armand M Scrosati B 2011 Angew. Chem. Int. Ed. 50 2999
19 Kumar J Kumar B 2009 J. Power Sources 194 1113
20 Laoire C O Mukerjee S Abraham K M 2009 J. Phys. Chem. C 113 20127
21 Laoire C O Mukerjee S Abraham K M 2010 J. Phys. Chem. C 114 9178
22 Allen C J Hwang J Kautz R Mukerjee S Plichta E J Hendrickson M A Abraham K 2012 J. Phys. Chem. C 116 20755
23 Trahan M J Mukerjee S Plichta E J Hendrickson M A Abraham K M 2013 J. Electrochem. Soc. 160 A259
24 Peng Z Freunberger S A Hardwick L J Chen Y Giordani V Bardé F Novák P Graham D Tarascon J M Bruce P G 2011 Angew. Chem. Int. Ed. 123 6475
25 Johnson L Li C Liu Z Chen Y Freunberger S A Ashok P C Praveen B B Dholakia K Tarascon J M Bruce P G 2014 Nat. Chem. 6 1091
26 Frith J T Russell A E Garcia-Araez N Owen J R 2014 Electrochem. Commun. 46 33
27 McCloskey B D Scheffler R Speidel A Girishkumar G Luntz A C 2012 J. Phys. Chem. C 116 23897
28 Abraham K M 2015 J. Electrochem. Soc. 162 A3021
29 Aetukuri N B McCloskey B D Garcia J M Krupp L E Viswanathan V Luntz A C 2015 Nat. Chem. 7 50
30 Gallant B M Kwabi D G Mitchell R R Zhou J Thompson C V Shao-Horn Y 2013 Energy Environ. Sci. 6 2518
31 Lu Y C Shao-Horn Y 2012 J. Phys. Chem. Lett. 4 93
32 Viswanathan V Nørskov J K Speidel A Scheffler R Gowda S Luntz A C 2013 J. Phys. Chem. Lett. 4 556
33 Viswanathan V Thygesen K S Hummelshøj J S Nørskov J K Girishkumar G McCloskey B D Luntz A C 2011 J. Chem. Phys. 135 214704
34 Mitchell R R Gallant B M Shao-Horn Y Thompson C V 2013 J. Phys. Chem. Lett. 4 1060
35 Zhong L Mitchell R R Liu Y Gallant B M Thompson C V Huang J Y Mao C X Shao-Horn Y 2013 Nano Lett. 13 2209
36 Ogasawara T Débart A Holzapfel M Novak P Bruce P G 2006 J. Am. Chem. Soc. 128 1390
37 Yang J Zha D Wang H H Lau K C Schlueter J A Du P Myers D J Sun Y K Curtiss L A Amine K 2013 Phys. Chem. Chem. Phys. 15 3764
38 Yang X Xia Y 2010 J. Solid State Electrochem. 14 109
39 Hummelshøj J S Blomqvist J Datta S Vegge T Rossmeisl J Thygesen K S Luntz A C Jacobsen KW Norskov J K 2010 J. Chem. Phys. 132 071101
40 McCloskey B D Scheffler R Speidel A Bethune D S Shelby R M Luntz A C 2011 J. Am. Chem. Soc. 133 18038
41 Sun B Wang B Su D Xiao L Ahn H Wang G 2012 Carbon 50 727
42 Højberg J McCloskey B D Hjelm J Vegge T Johansen K Norby P Luntz A C 2015 ACS Appl. Mater. Inter. 7 4039
43 Herrera S E Tesio A Y Clarenc R Calvo E J 2014 Phys. Chem. Chem. Phys. 16 9925
44 Mitchell R R Gallant B M Thompson C V Shao-Horn Y 2011 Energy Environ. Sci. 4 2952
45 Feng N He P Zhou H 2015 ChemSusChem 8 600
46 Yadegari H Li Y Banis M N Li X Wang B Sun Q Sun X 2014 Energy Environ. Sci. 7 3747
47 Harding J R Lu Y C Tsukada Y Shao Horn Y 2012 Phys. Chem. Chem. Phys. 14 0540
48 Zheng H Xiao D Li X Liu Y Wu Y Wang J Jiang K Chen C Gu L Wei X Hu Y Chen Q Li H 2014 Nano Lett. 14 4245
49 Wen R Hong M Byon H R 2013 J. Am. Chem. Soc. 135 10870
50 Varley J B Viswanathan V Nørskov J K Luntz A C 2014 Energy Environ. Sci. 7 720
51 Radin M D Siegel D J 2013 Energy Environ. Sci. 6 2370
52 Geng W T He B L Ohno T 2013 J. Phys. Chem. C 117 25222
53 Tian F Radin M D Siegel D J. 2014 Chem. Mater. 26 2952
54 Luntz A C Viswanathan V Voss J Varley J B Nørskov J K Scheffler R Speidel A 2013 J. Phys. Chem. Lett. 4 3494
55 Ong S P Mo Y Ceder G 2012 Phys. Rev. B 85 081105
56 Kang J Jung Y S Wie S Dillon A C 2012 Phys. Rev. B 85 035210
57 Radin M D Rodriguez J F Tian F Siegel D J 2012 J. Am. Chem. Soc. 134 1093
58 Zhao Y Ban C Kang J Santhanagopalan S Kim G H Wei S H Dillon A C 2012 Appl. Phys. Lett. 101 023903
59 Lu Y C Gallant B M Kwabi D G Harding J R Mitchell R R Whittingham M S Shao Horn Y 2013 Energy Environ. Sci. 6 750