


Influence of Al3+doping on the energy levels and thermal property of the 3.5MgO·0.5MgF2·GeO2:Mn4+ red-emitting phosphor
[Yuan Lin-lin, Xiao-Song Zhang, Xu Jian-Ping, Sun Jian, Jin Han, Liu Xiao-Juan, Li Lin-Lin, Li Lan† ]
]
]
|
|


†Corresponding author. E-mail: lilan@tjut.edu.cn
*Project supported by the National High Technology Research and Development Program of China (Grant No. 2013AA014201), the Natural Science Foundation of Tianjin City, China (Grant Nos. 11JCYBJC00300 and 14JCZDJC31200), and the National Key Foundation for Exploring Scientific Instrument of China (Grant No. 2014YQ120351).
A series of Al3+ -doped 3.5MgO·0.5MgF2·GeO2:Mn4+ red-emitting phosphors is synthesized by high temperature solid-state reaction. The broad excitation band at 300 nm–380 nm, resulting from the4A2 →4T1 transition of Mn4+, exhibits a blue shift with the increase of Al2O3 content. The observation of the decreased Mn4+O2 − distance is explained by the crystal field theory. The temperature-dependent photoluminescence spectra with various amounts of Al2O3 content are comparatively measured and the calculation shows that the activation energy increases up to 0.41 eV at the Al2O3 content of 0.1 mol. The maximum phonon densities of state for these samples are calculated from Raman spectra and they are correlated with the thermal properties.
With high energy conversion efficiency, low energy consumption, long lifetime, and environment-friendly, white light-emitting diodes (WLEDs) have stimulated the development of solid-state lighting technology.[1] In most commercial WLED devices with a typical internal structure, including blue GaN chip and yellow emitting YAG:Ce3+ phosphor, the low red emission intensity of YAG:Ce3+ phosphors gives rise to the poor color rendering index (CRI) and higher correlated color temperature. The one possible solution was found to adopt trichromatic phosphors combining the near-UV (NUV) LED chips.[2, 3] In addition, the high emission efficiency and thermally stable red-emitting phosphors are necessary to lower the thermal quenching at the high operating temperature (up to 425 K) of chips.[4]
Currently, the selected red-emitting phosphors for WLEDs are focused on nitrides- and sulfide-based compounds with activated centers, such as rare-earth ions[2– 6] and transition metal ions.[7– 9] Eu2+ -doped nitride phosphors with high color rendering indexes are regarded as good candidate red-emitting phosphors for WLEDs under UV or blue chip excitation.[2– 4] However, synthesis conditions are required, including high reaction temperature and the high pressure N2 gas. Although the higher emission efficiency from sulfide red-emitting phosphor, such as (Ca1 − x, Srx)S:Eu2+ , [5] has been achieved, [6] the poor thermal stability and sensitivity to moisture may restrict the stability and lifetime of the device. Mn4+ -activated dialkali hexafluorometallate hosts, such as BaSiF6, [7] ZnSiF6, [8] and K2SiF6, [9] are found to match well with the emission wavelength of InGaN chip and can achieve highly efficient red luminescence.
It is generally considered that energy level structure and electronic transition probability of luminescence centers are highly interrelated with the crystal field strength of the ligands.[10] Bachmannet et al.[2] found a red-shift in the Eu2+ emission band when replacing part of Sr2+ ions by Ca2+ ions in the host of SrSi2O2N2. They suggested that an increased crystal field splitting lowered the energy difference between 5d– 4f state of Eu2+ . Dai et al.[10] investigated the PL spectra of Eu2+ -doped KSrPO4 when substituting part of K+ cations by Na+ cations in the host. A red-shift in 430-nm band was attributed to the shift of Eu2+ 5d energy level which was influenced by contraction and distortion of the unit cell. As the feature of the outside 3d electrons, [11] the energy level of transition metal ions are much affected by the crystal field strength of the matrix.[12] For Mn4+ -activated Ln2Sn2O7 (Ln = Lu3+ , Y3+ , and Gd3+ ), the increased Mn4+ – O2 − bond length induced the decrease in crystal field strength and energy level difference between 4A2 and 4T2.[13]
In consideration of the formation of stable polyhedron structure, Al3+ co-doping has a significant role in crystal field strength and luminescence properties.[14– 16] The increase of Al3+ addition in ZnGa2O4:Cr3+ induced a blue-shift of the excitation spectra due to the increase of crystal field strength.[17] The deep red luminescence of the Mn4+ ion in 3.5MgO· 0.5MgF2· GeO2, which was derived by replacing part of MgO in 4MgO· GeO2 with MgF2, had given rise to an increasing luminescence intensity.[18, 19] In addition, the two broad excitation bands in a range of 300 nm– 480 nm make it suitable for UV and blue LED chips. In this paper, 3.5MgO· 0.5MgF2· (1− 2x)GeO2· xAl2O3:0.01Mn4+ (0 ≤ x ≤ 0.15 mol) phosphors are synthesized by the high temperature solid-state reaction method. The influence of foreign Al3+ ions on energy levels of the Mn4+ ions and thermal properties of phosphors are also discussed.
Powder samples were prepared by the high temperature solid-state reaction of mixtures with appropriate molar ratios for 3.5MgO· 0.5MgF2· (1− 2x)GeO2· xAl2O3:0.01Mn4+ (0 ≤ x ≤ 0.15 mol) with starting materials consisting of MgO, MgF2 of 99.9% purity, GeO2, Al2O3 of 99.999% purity, and MnO2 of 99.99% purity. The mixture was thoroughly mixed and transferred to a corundum crucible, which was heated at 1100 ° C for 6 h under atmosphere. After cooling to room temperature, the as-prepared samples were completely ground.
The crystal structures of powder samples were characterized by using a Rigaku 2500/PC x-ray diffractometer (XRD) with Cu Kα radiation source (0.1542 nm) at 40 kV and 150 mA. The scanning electron microscope (SEM) images and energy dispersive spectroscopy (EDS) spectra were obtained by field emission scanning electron microscopy (FESEM, HITACHI SU8010). Photoluminescence (PL) and excitation (PLE) measurements were performed by Jobin Yvon FL3 fluorescence spectrophotometer with a 450-W xenon lamp as an excitation source. Temperature-dependent PL spectra were measured at temperatures ranging from 300 K to 540 K by the same spectrophotometer with home-made heating equipment. Raman spectra were recorded using a RENISHAW InVia Raman microscope and an argon ion laser operating at 785 nm. All of the measurements were carried out in ambient atmosphere.
The XRD patterns for phosphor samples are revealed in Fig. 1. The samples each have an Mg28Ge10O48-like structure that belongs to orthorhombic symmetry with space group Pbam and cell parameters a = 14.343 Å , b = 10.196 Å , and c = 5.908 Å , which were reported by Von Dreele et al.[20] and Bless et al.[21] No diffraction peak shift is observed in any of the samples with different doping amounts of Al3+ . Considering the ion valence state and electro-negativity, Ge4+ could be substituted by Al3+ ions to keep the electric neutrality by substituting F − into O2 − sites.[21, 22] For similar effective ionic radii of Ge4+ (r = 0.39 Å , CN = 4) and Al3+ (r = 0.39 Å , CN = 4), Al3+ substituted in host lattice can be determined as no detectable change in cell volume. The SEM images and EDS spectra for the as-prepared phosphors at Al2O3 concentrations of 0, 0.05, 0.1, and 0.15 mol are shown in Fig. 2. Similar particle morphologies of polyhedra and sizes are observed for all of the samples. The atomic ratios for all cations in samples, which are summarized in Table 1, are consistent with the molar ratios of raw materials.
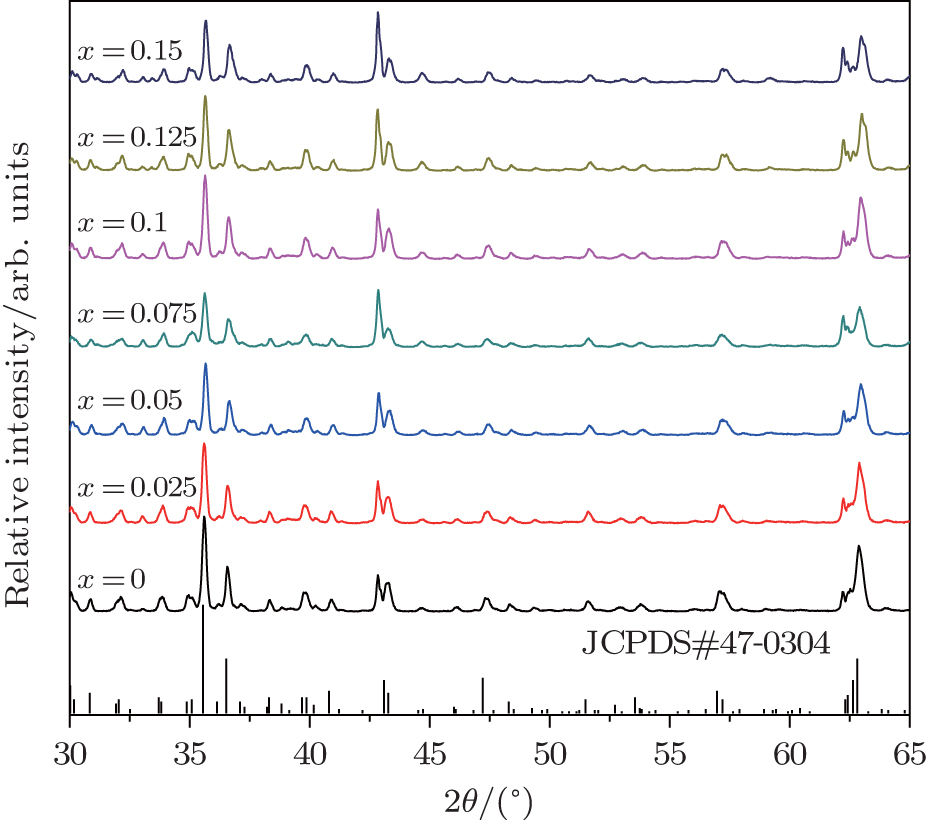 | Fig. 1. The XRD patterns for the 3.5MgO· 0.5MgF2· (1− 2x)GeO2· xAl2O3:0.01Mn4+ (0 ≤ x ≤ 0.15 mol) phosphors. |
 | Fig. 2. The SEM images and EDS spectra of the samples at Al2O3 content values of 0, 0.05, 0.1, and 0.15 mol. |
| Table 1. Atomic ratios of all elements doped with different amounts of Al2O3. |
 | Fig. 3. (a) Normalized PLE spectra of the samples with Al2O3 content values of 0, 0.05, 0.1, and 0.15 mol for the 657-nm emission of Mn4+ . The inset shows the variation of peak position for wavelength band 300 nm– 380 nm with Al3+ concentration. (b) The energy level diagram for the d3 configuration. |
The PLE spectra of 3.5MgO· 0.5MgF2· (1− 2x)GeO2· xAl2O3:0.01Mn4+ (x = 0, 0.05, 0.1, and 0.15 mol) are shown in Fig. 3(a). The two broad wavelength ranges of 300 nm– 380 nm and 380 nm– 480 nm correspond to the spin-allowed 4A2→ 4T1 and 4A2 → 4T2 transitions of Mn4+ ions, respectively.[18, 19] The higher-energy band peak shows the blue-shift from 334 nm to 320 nm with the increase of Al3+ concentration, whereas the lower-energy excitation band has no obvious change. As described by Von Dreele et al.[20] and Bless et al., [21] Mg2+ ions occupied the center of the octahedral coordination sites by six oxygen atoms with two different Mg2+ – O2 − bond distances. And Mn4+ ions were suggested to occupy Mg2+ sites of the center octahedral symmetry.[22] The bond distance calculated by Vienna ab-initio simulation package (VASP) is 2.164 Å for 


where Dq is the crystal field strength for octahedral symmetry, R is the distance between the central ion and its ligand, Z is the charge or valence of the anion, e is the charge of the electron, and r is the radius of the d-wave function. The increased crystal field strength from shortened Mn4+ – O2 − bond distance in the six-fold coordination brings about the shifts of 4T1 and 4T2 energy levels of Mn4+ , resulting in the observed blue-shift of 4A2 − 4T1 excitation band.
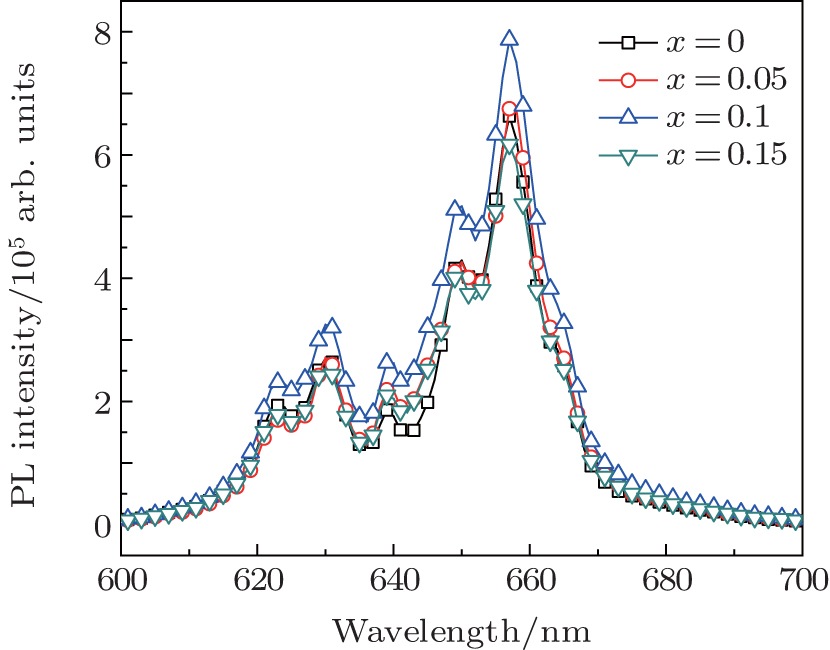 | Fig. 4. The PL spectra of the 3.5MgO· 0.5MgF2· (1− 2x)GeO2· xAl2O3:0.01Mn4+ phosphors with Al2O3 concentrations of x = 0, 0.05, 0.1, and 0.15 mol. |
Figure 4 shows the PL spectra of 3.5MgO· 0.5MgF2· (1− 2x)GeO2· xAl2O3:0.01Mn4+ phosphors with different Al2O3 concentrations of 0, 0.05, 0.1, and 0.15 mol. There are five sharp red emission peaks located at 623, 630, 639, 649, and 657 nm, respectively, which is ascribed to the different vibrational modes of 2E → 4A2 of Mn4+ ions. The two dominant peaks around 649 nm and 657 nm originate from Stokes vibrational band by the coupling of the asymmetric Mn4 + − O2 − deformation and stretching modes.[19, 22] Since the 2E → 4A2 transition is spin- and parity-forbidden, the two weak emission bands from the anti-Stokes can be observed at around 623 nm and 630 nm. And the peak at 639 nm, which seems to be weakest, is from the zero-phonon transition.[19, 22] Owing to their weak dependence on crystal field strength, the emission peaks for 2E energy level are almost unchanged.
A main obstacle in developing practical WLED technology is the thermal quenching of phosphors; i.e., the luminescent efficiency and color rendering index deteriorate with an increase of the operating temperature. Figure 5 shows the PL emission spectra of 3.5MgO· 0.5MgF2· (1 − 2x)GeO2· xAl2O3:0.01Mn4+ (x = 0, 0.05, 0.1, and 0.15 mol) phosphors under 400-nm excitation in a temperature range from 300 K to 540 K. Their main emission peak positions are kept at 657 nm for all samples, whereas the full width at half maximum (FWHM) is obviously broadened with the increase of the measurement temperature as shown in Fig. 6(a). This phenomenon is associated with the enhanced electron– phonon interaction by the increased population density of phonons at high temperature.[25] The normalized emission intensities under different measurement temperatures are displayed in Fig. 6(b).
 | Fig. 5. Temperature-dependent PL spectra of phosphors with Al2O3 concentration x = 0, 0.05, 0.1, and 0.15 mol under the excitation of 400 nm. |
 | Fig. 6. Temperature-dependence of (a) FWHMs and (b) normalized emission intensities of the 3.5MgO· 0.5MgF2· (1− 2x)GeO2· xAl2O3:0.01Mn4+ phosphors with x = 0, 0.05, 0.1, and 0.15 mol. |
As the temperature increases from room temperature up to 425 K, the emission intensities reach 45.7%, 49.8%, 72.5%, and 52.3% of initial intensity for x = 0, 0.05, 0.1, and 0.15 mol, respectively. The activation energy can be determined with fitting procedure by using the Arrhenius equation, [25, 26]

where I0 is the initial intensity, IT is the intensity at a given
 | Fig. 7. Fitted curves for ln[I0/IT)-1] versus 1/kT from Arrhenius equation. The symbols and straight lines represent the experimental data and fitted line under Al2O3 concentrations of 0, 0.05, 0.1, 0.15 mol, respectively. |
temperature T, c is a constant for a certain host, Δ E is the activation energy for thermal quenching, and k is the Boltzmann’ s constant. The thermal quenching data under different Al2O3 concentrations in Fig. 6(b) are fitted for the curves in Fig. 7. The slope values, which are indicated as Δ E, are 0.23, 0.30, 0.41, and 0.33 eV, respectively.
The nonradiative transition process at high temperature is usually associated with the enhanced electron– phonon interaction due to the increased population density of phonons.[25, 26] The influence of Al3+ doping on the phonon energy of 3.5MgO· 0.5MgF2· GeO2 is discussed according to Raman spectra in Fig. 8. Except for the band of octahedral MnO6[27] and tetrahedral GeO4 group, [28, 29] the emerging band at 702 cm− 1 for Al2O3 doping samples is ascribed to the stretching vibration of tetrahedral AlO4 groups.[30, 31] It was suggested in Refs. [23] and [32] that the nonradiative relaxation probability can be described by WNP = C[n(T) + 1]Pexp (− α Δ E), in which constant C is dependent on the phonon density of state ρ (ω P)[33] and expressed as C∝ ρ (ω )5 / 3. The maximum phonon density of state ρ m (ω P) is typically described as the integral area ratio of the band at 827 cm− 1– 867 cm− 1, corresponding to maximum phonon energy, to the whole band of the Raman spectrum. The values of ρ m (ω P) are calculated to be 0.1086, 0.1081, 0.0804, and 0.1051 for Al2O3 concentration x = 0, 0.05, 0.1, and 0.15 mol, respectively. The minimum value of ρ m (ω P) at 0.1-mol Al2O3 doping is consistent with the observed weak thermal quenching.
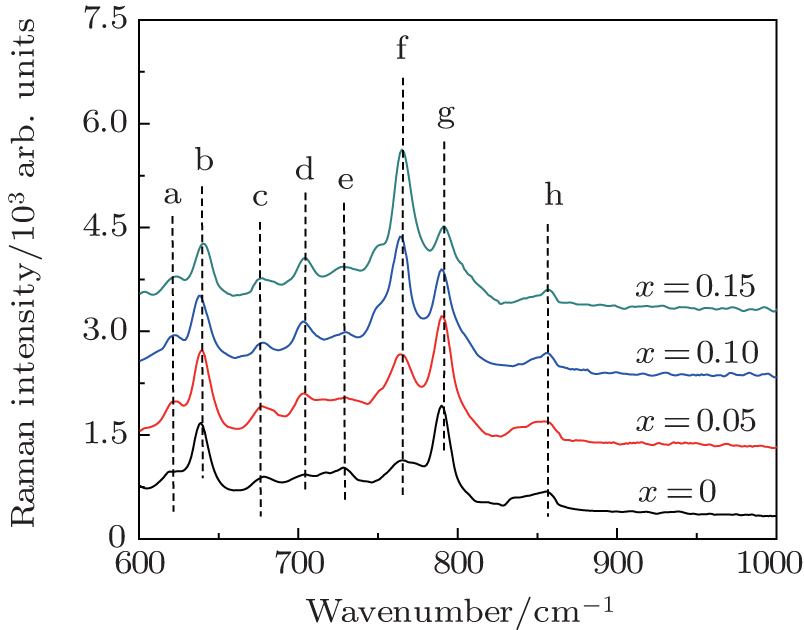 | Fig. 8. Raman spectra for Al2O3 content values of 0, 0.05, 0.1, and 0.15 mol at room temperature. The bands denoted as a and b are the asymmetric stretching modes of octahedral MnO6. The band d is due to the stretching vibration of tetrahedral AlO4. The symmetric stretching, antisymmetric stretching, and stretching vibration modes of tetrahedral GeO4 are assigned to c, f, g, e, and h, respectively. |
In this work, we synthesize a series of red-emission Mn4+ -activated 3.5MgO· 0.5MgF2· (1− 2x)GeO2· xAl2O3:0.01Mn4+ (0 ≤ x ≤ 0.15 mol) phosphors by high temperature solid-state reaction. The phosphors each exhibit a strong red emission under UV light excitation. The broad excitation band in 300 nm– 380 nm, which originates from the 4A2 → 4T1 transition of Mn4+ , is observed to be blue-shifted with the increase of addition Al2O3. We conclude that the crystal field strength Dq of the octahedral lattice structure could be changed by Al3+ additive due to the variation of Mn4+ – O2 − bond length. Temperature-dependent PL spectra are measured in a temperature range of 300 K– 540 K. The thermal stability is found to be optimal for 0.1 mol of Al3+ doping concentration with the activation energy of 0.41 eV. The maximum phonon density of state is used to explain the thermal quenching effect.
| 1 |
|
| 2 |
|
| 3 |
|
| 4 |
|
| 5 |
|
| 6 |
|
| 7 |
|
| 8 |
|
| 9 |
|
| 10 |
|
| 11 |
|
| 12 |
|
| 13 |
|
| 14 |
|
| 15 |
|
| 16 |
|
| 17 |
|
| 18 |
|
| 19 |
|
| 20 |
|
| 21 |
|
| 22 |
|
| 23 |
|
| 24 |
|
| 25 |
|
| 26 |
|
| 27 |
|
| 28 |
|
| 29 |
|
| 30 |
|
| 31 |
|
| 32 |
|
| 33 |
|