


Measurement of micro weld joint position based on magneto-optical imaging*
Cite this Article
Gao Xiang-Dong, Chen Zi-Qin. Measurement of micro weld joint position based on magneto-optical imaging* . Chinese Physics B, 2014, 24(1): 018103 
Permissions
Measurement of micro weld joint position based on magneto-optical imaging*
Corresponding author. E-mail: gaoxd666@126.com
Project supported by the National Natural Science Foundation of China (Grant No. 51175095), the Natural Science Foundation of Guangdong Province, China (Grant No. 10251009001000001), the Guangdong Provincial Project of Science and Technology Innovation of Discipline Construction, China (Grant No. 2013KJCX0063), and the Science and Technology Plan Project of Guangzhou City, China (Grant No. 1563000554).
Abstract
In a laser butt joint welding process, it is required that the laser beam focus should be controlled to follow the weld joint path accurately. Small focus wandering off the weld joint may result in insufficient penetration or unacceptable welds. Recognition of joint position offset, which describes the deviation between the laser beam focus and the weld joint, is important for adjusting the laser beam focus and obtaining high quality welds. A new method based on the magneto-optical (MO) imaging is applied to measure the micro weld joint whose gap is less than 0.2 mm. The weldments are excited by an external magnetic field, and an MO sensor based on principle of Faraday magneto effect is used to capture the weld joint images. A sequence of MO images which are tested under different magnetic field intensities and different weld joint widths are acquired. By analyzing the MO image characteristics and extracting the weld joint features, the influence of magnetic field intensity and weld joint width on the MO images and detection of weld joint position is observed and summarized.
Keyword:
81.20.Vj; 78.20.Ls; 42.62.–b; micro weld joint; magneto-optical imaging; laser welding
1. Introduction
It is required that the laser beam focus is controlled to follow the weld joint during laser welding, and thus accurately measuring the weld joint position is an essential prerequisite to obtain good welds. Laser welding has been widely used for its advantage in narrowly focusing laser radiation to a small area and generating high intensity heat source.[1– 3] Accurate seam tracking is the key to ensure laser welding quality. However, this narrow area of the laser weld fusion zone brings about problems of joint alignment and fit up.[4] In recent years, the main method of weld joint detection is based on machine vision. The information of the weld joint position is captured by a visual sensor, and the laser beam focus position is adjusted to follow the weld joint according to calculation of weld joint offset. Visual sensor is a very useful tool to capture objects, and the captured images contain plenty of information of the objective.[5– 7]
Due to factors such as concentrated welding energy, small laser spot diameter, narrow root opening, smoke, metal plume, and spatter during laser welding, it is difficult to use the machine visual method to directly obtain the micro weld joint information and realize accurate seam tracking. Usually the welding speed of laser is fast and the root opening is narrow, which make it more difficult to detect and track the micro weld joint. Several methods have been experimented to detect the weld position.[8– 10] For instance, seam tracking system LPF, welding monitor, and RoboFind have been commercialized for several years. The most popular technique used for weld joint detection is based on the principle of optical triangulation. However, when the width of a butt joint is less than 0.1 mm, the weld joint is too narrow to be measured directly by optical triangulation method. The technique of magneto-optical (MO) imaging, a nondestructive evaluation technique, is considered applicable to the detection of micro weld joint during laser welding. An MO sensor is applied to produce real time images of magnetic fields from workpiece surface and subsurface that are easy to interpret.[11, 12] This technique has gained great attention largely due to its simple operation, high accuracy, and high speed of inspection.[13– 17] MO imaging method is proved to be an effective way to detect and track the micro weld joint during laser welding. It is found that the weld joint position of MO image will change with different magnetic field intensity, and almost not change at different welding speeds.[18] In the laser welding process, the magnetic field usually fluctuates due to various welding environmental disturbances. At the same time, the weld joint width varies because of the high energy of laser resulting in weldment thermal deformation. Based upon the experimental findings, this paper further researches the MO image characteristics of micro weld joint under different magnetic field and different weld joint width. Also, the influence of magnetic field intensity and width of weld joint on detection of weld joint position is studied.
2. Experimental setup
The experimental setup is shown in Fig. 1, which includes a YAG laser welding equipment, MO sensor, movement worktable, jigs, shielding gas (argon) device, and magnetic field excitation means.
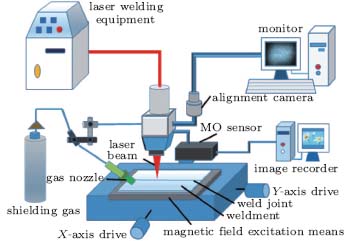 | Fig. 1. Experimental equipment of detecting weld joint using magneto optical imaging. |
The MO sensor is mainly composed by optical system, MO thin films, light-emitting diode (LED) light source, the complementary metal oxide semiconductor (CMOS) image sensor and other components. Detailed parameters of MO sensor are shown by Table 1.
| Table 1. Parameters of MO sensor. λ is the light source wavelength, H is the magnetic field intensity and F is the sampling rate. |
The magnetic field is produced by a magnetic field excitation means which is set under the weldment. The distribution and intensity of magnetic field change through the weld joint, basically according to the shape and joint gap width of weldment. As shown in Fig. 2, the weldment is magnetized by an external magnetic field, and this can cause changes in the incident light polarization direction of MO sensor. According to Faraday magneto-optical effect, change of the incident light polarization direction can be reflected by the MO images sensitively. The MO image characteristic related to the weld joint is different from other regions of weldment, so the weld joint position can be detected by analyzing the MO images.
 | Fig. 2. Schematic diagram of magnetic field distribution on weldment. (a) External magnetic field direction is perpendicular to the joint of the weldment. (b) Schematic diagram overlooking the magnetic field perpendicular to the weldment. |
The magnetic field excitation means is an electromagnet which can produce different and accurate intensity of magnetic field by changing the control voltage. The scope of magnetic field intensity is in MO sensor measuring scope. Low carbon steel is used as the experimental weldment, as its strength, plasticity, and welding performance are desirable and therefore it is widely used for its good comprehensive performance. The heat affected zone of low carbon steel is usually small, so in most cases it is unnecessary to process the material by heat treatment.
The experiments are carried out and 20 groups of data are obtained. These data are measured under the conditions of different magnetic field intensity and different weld joint width. The voltage of magnetic field excitation is set at 16.5 V, 19 V, 21.5 V, and 24 V respectively in order to produce different magnetic field intensity, and the weld joint gap width is set as 0 mm, 0.05 mm, 0.10 mm, 0.15 mm, and 0.20 mm, respectively. Different weld widths are tested to investigate the MO image characteristics of weld joint. The experimental conditions are shown in Table 2.
| Table 2. Experimental conditions of micro weld joint detection. S is the distance between MO sensor and weldment, V is the work table movement speed, U is the magnetic field excitation, and Wg is the weld joint gap width. |
3. MO image processing and analysis
3.1. Transition zone of MO image
When a linear polarized beam passes through an optical rotation medium, the vibration plane rotation of the light will be rotated. If an external magnetic field H is applied on the medium along the direction of light propagation, the rotation angle θ is the effect of Faraday rotation angle
 |
where B is the magnetic induction intensity, V is the Verdet constant, which is related to material properties, temperature, and the frequency (wavelength) of light, and d is the path length of light penetrating through the material.
For most MO medium, the Faraday rotation angle is proportional to the magnetic field intensity. When the magnetic field exceeds a certain limit, the magnetization tends to reach saturation value and Faraday rotation angle θ will become saturated.[13] A photo of weldment whose joint gap width is 0.1 mm is shown in Fig. 3.
 | Fig. 3. A photo of weldment surface. |
The same position of the weld is chosen while the voltage of magnetic field excitation is 16.5 V, and weld joint width is set as 0 mm, 0.05 mm, 0.1 mm, 0.15 mm, and 0.2 mm, respectively. Figure 4 shows the weld joint surface images captured by a microscope. Though the weld joint can be seen clearly, the angle of view and the depth of focus are small, and it is only applicable to a static observation of weld joint. It is difficult to focus on a moving weldment. Thus, it cannot be used to detect and track the weld joint path in laser welding process while the weldment is moving. The MO images of weld joint are shown in Fig. 5, where the original MO images show the same position of the weld joint, while the voltage of the magnetic field excitation is 16.5 V.
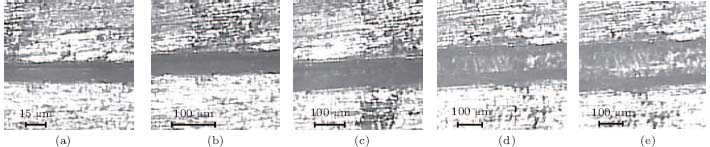 | Fig. 4. Top view of weld joint surface. (a) Weld joint width is close to 0 mm, (b) weld joint width is 0.05 mm, (c) weld joint width is 0.1 mm, (d) weld joint width is 0.15 mm, (e) weld joint width is 0.2 mm. |
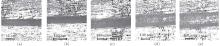
 | Fig. 5. MO images of weld joint. (a) Weld joint width is close to 0 mm, (b) weld joint width is 0.05 mm, (c) weld joint width is 0.1 mm, (d) weld joint width is 0.15 mm, (e) weld joint width is 0.2 mm. |
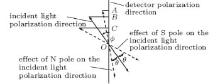
It can be clearly seen from the MO image that there are two different areas, which reflect the two separated steel plates. A magnetic field excitation setup is arranged to make the external magnetic field direction perpendicular to the joint of the weldment. When the magnetic field goes through the weld joint gap in horizontal direction from the N pole to S pole, the weldment is magnetized and the intensity of magnetic field changes due to different magnetic properties between weldment and weld joint gap. This causes corresponding changes in the Faraday rotation angle. Figures 2 and 6 show the magnetized weldment and MO image principle. When the weldment is magnetized by external magnetic field, N pole and S pole are formed on both sides of weld joint respectively, where the N pole magnetic field causes the incident light polarization of MO sensor to rotate clockwise along the plane of polarization for θ angle, and the S pole magnetic field causes a counterclockwise rotation of the incident light polarization angle θ along the plane of polarization. Consequently, the gray scale of a weld joint MO image changes, which produces different colors related to both sides of weld joint, respectively, and the clear weld joint MO images can be obtained.
 | Fig. 6. Schematic diagram of weld joint MO image principle. |
As shown in Fig. 6, when there is no magnetic field, the projection of the incident light polarization direction on the detector polarization direction is OB, and φ is the angle between the incident light and detector polarization direction. When the weldment is magnetized by external magnetic field, as already mentioned above, N pole and S pole are formed on both sides of weld joint respectively. The N pole magnetic field causes the polarization to rotate clockwise along the plane of polarization for θ angle, and the S pole magnetic field causes a counterclockwise rotation of the polarization angle θ along the plane of polarization. The corresponding amplitude components of N pole and S pole are OA and OC respectively. The quantity of θ is based upon the magnetic induction intensity, as shown in Eq. (1). This causes different properties of weldment images with different magnetic field distribution intensities, and has the gray-scale change in an MO image of the weld joint.
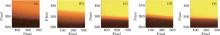
Magnetic property changes along the magnetic field distribution and different gray scales of MO image represent different intensities of magnetic field, as shown in Fig. 7. Also, by using a magnetic field measuring instrument for calibration, the magnetic field intensity corresponding to MO images can be calculated. The weld joint width changes from 0 mm to 0.20 mm with a step of 0.05 mm, and different magnetic field intensities of the same position under different voltages of magnetic field excitation are shown in Figs. 7(e)– 7(i).
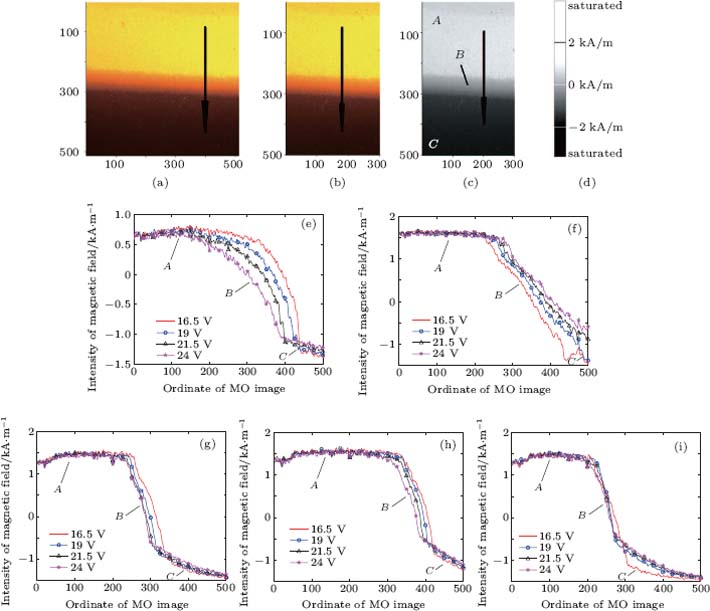 | Fig. 7. Different intensity of magnetic field corresponds to MO images and voltages of magnetic field excitation setup. (a) Original MO image of weld joint, (b) clipped middle 300 columns of the original MO image, (c) grayscale image, (d) grayscale corresponding to the intensity of magnetic field. (e)– (i) Intensity of magnetic field corresponding to ordinate of MO images. Weld joint widths are (e) 0 mm, (f) 0.05 mm, (g) 0.10 mm, (h) 0.15 mm, and (i) 0.20 mm, respectively. |
The region between two areas A and C in an MO image is related to the actual weld joint, which can be deemed as the weld joint transition zone B. In order to extract the weld joint position from an MO image, the characteristic of transition zone B should be analyzed. The width of transition zone B and the centerline of MO images are chosen as the area of research interest. For each experiment, a total of 580 frames of MO images of weld joint are collected by the MO sensor. Here, the 320th frame of the 3rd group of MO images is selected as an example to show the image processing procedure. The size of MO original image is 512× 512 pixel2, the weld joint width is 0.1 mm and the magnetic field excitation voltage is 19 V. The middle 300 columns are clipped as the object for the image processing, and the original MO image is converted to grayscale image. By extracting the edge of the transition zone, the center of MO image of the welding line can be calculated. The image processing procedure is shown in Fig. 8.
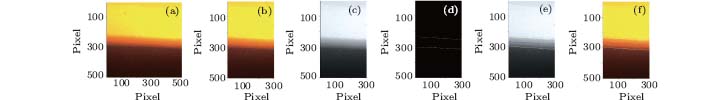 | Fig. 8. Schematic diagram of MO image processing of weld joint. (a) Original image, (b) clipped middle 300 columns of the original image, (c) grayscale image, (d) transitional zone edge, (e) transitional zone and center line of grayscale image, and (f) transitional zone and center line of clipped image. |
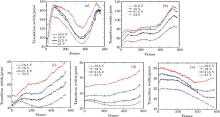
MO images of different magnetic field intensity and different weld joint width are processed respectively. When the weld joint width changes from 0 mm to 0.2 mm with a step of 0.05 mm, the changes of transition zone under different voltages of magnetic field excitation are shown in Fig. 9, where the voltage changes from 16.5 V to 24 V with a step of 2.5 V.
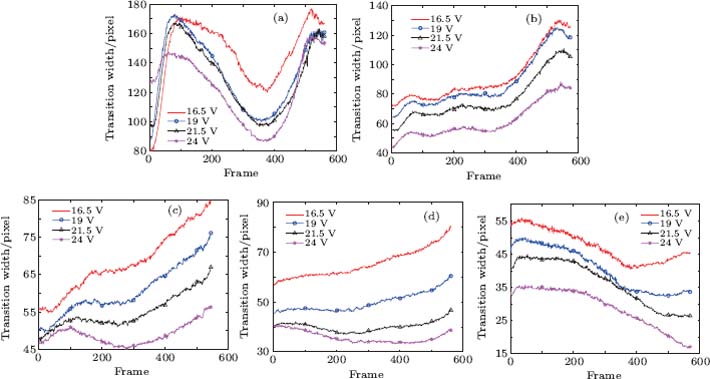 | Fig. 9. Transition zone width of MO images. Weld joint width is (a) 0 mm, (b) 0.05 mm, (c) 0.1 mm, (d) 0.15 mm, and (e) 0.2 mm, respectively. |
In order to clearly observe the changes of transition zone width related to different weld joint width, figure 10 shows another combination of experimental data. Here, the voltage of magnetic field excitation is also changed from 16.5 V to 24 V with a step of 2.5 V, and the weld joint width is changed from 0 mm to 0.2 mm with a step of 0.05 mm. The widths of MO image transition zone under different conditions are shown in Table 3.
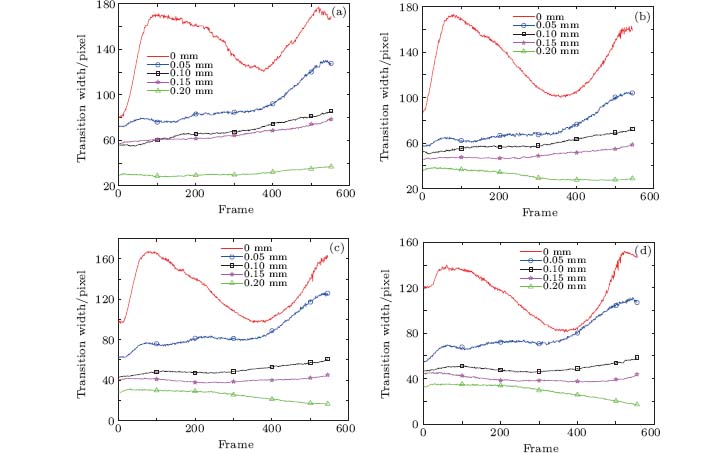 | Fig. 10. Transition zone width of MO images. The voltages of magnetic field excitation are (a) 16.5 V, (b) 19 V, (c) 21.5 V, and (d) 24 V, respectively. |
| Table 3. Width of MO image transition zone (pixel). |
3.2. Measurement of weld joint center
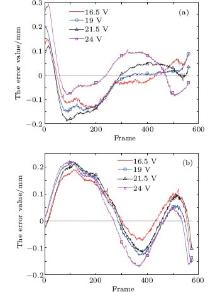
While the weld joint width changes from 0 mm to 0.2 mm with a step of 0.05 mm, different centerline positions of the MO images related to different voltages of magnetic field excitation are shown in Fig. 11. Here, the voltage changes from 16.5 V to 24 V by increasing 2.5 V each time.
 | Fig. 11. Weld joint center of the MO images. Weld joint widths are (a) 0 mm, (b) 0.05 mm, (c) 0.1 mm, (d) 0.15 mm, and (e) 0.2 mm, respectively. |
The calibration value is 100 pixel/mm when the weld joint width is 0 mm, and the calibration value is 140 pixel/mm when the weld joint width is 0.05 mm. The error between the detection values and the actual values of weld joint center under different voltages of magnetic field excitation is shown in Fig. 12.
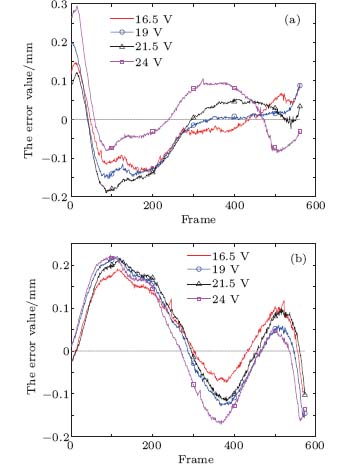 | Fig. 12. Errors of weld joint detection. The weld joint width is (a) 0 mm and (b) 0.05 mm, respectively. |
Tables 4 and 5 show the statistical results of micro weld joint detection when the weld joint widths are 0 mm and 0.05 mm, respectively. The statistical results include the maximum error, minimum error, mean error, variance, and standard deviation of joint detection.
| Table 4. Errors (cm) of detecting weld joint center at a weld joint width of 0 mm. |
| Table 5. Errors (cm) of detecting weld joint center at a weld joint width of 0.05 mm. |
4. Conclusions
A magneto-optical imaging method based on the principle of Faraday magneto effect is studied to measure the micro weld joint whose gap is less than 0.2 mm. The experiments are carried out under the conditions of different magnetic field intensity and the different weld joint width. From the experimental results, the conclusions can be drawn as follows. (i) When the weld joint gap is constant, the width of weld joint transition zone of MO image decreases and the weld center line of MO image moves slightly as the magnetic field strength increases. (ii) When the magnetic field intensity is constant, the width of weld joint transition zone of MO image decreases as the weld joint width increases. (iii) When the weld joint gap is larger than 0.15 mm, the magnetic field intensity variation has less influence on the weld joint center position of MO image. (iv) When the magnetic field intensity increases, the errors of detecting the weld joint position become fewer. The micro weld joint can be detected by using the magneto optical imaging, and experimental results show that this method is effective for accurately measuring the micro weld joint position and seam tracking.
Reference
| 1 |
|
| 2 |
|
| 3 |
|
| 4 |
|
| 5 |
|
| 6 |
|
| 7 |
|
| 8 |
|
| 9 |
|
| 10 |
|
| 11 |
|
| 12 |
|
| 13 |
|
| 14 |
|
| 15 |
|
| 16 |
|
| 17 |
|
| 18 |
|