Measurement of micro weld joint position based on magneto-optical imaging
Measurement of micro weld joint position based on magneto-optical imaging |
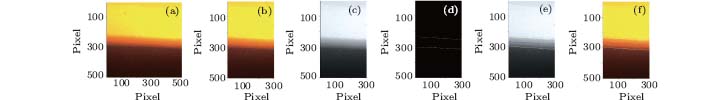
| Fig.#cod#x00A0;8. Schematic diagram of MO image processing of weld joint. a Original image, b clipped middle 300 columns of the original image, c grayscale image, d transitional zone edge, e transitional zone and center line of grayscale image, and f transitional zone and center line of clipped image. |
| |