


Growth of PbS nanoclusters on specific sites of programmed oligodeoxynucleotides*
Cite this Article
Lu Ying, Teng Cui-Juan, Li Ying, Wang Hui, Xu Chun-Hua, Hu Shu-Xin, Li Ming. Growth of PbS nanoclusters on specific sites of programmed oligodeoxynucleotides* . Chinese Physics B, 2014, 24(1): 016101 
Permissions
Growth of PbS nanoclusters on specific sites of programmed oligodeoxynucleotides*
Corresponding author. E-mail: hushuxin@aphy.iphy.ac.cn
Project supported by the National Natural Science Foundation of China (Grant Nos. 11104328, 10904164, and 11004234) and the Knowledge Innovation Program of Chinese Academy of Sciences (Grant No. kjcx3.syw.n8).
Abstract
We develope a method to synthesize PbS nanoclusters (NCs) using guanine-containing oligodeoxynucleotides (ODNs) as templates. The NCs on the ODNs are ultra small (ranging from ∼ 0.5 nm to 2.1 nm) and luminescent in the visible region. They are characterized by photoluminescence (PL) spectra, transmission electron microscopy (TEM), and X-ray powder diffraction (XRD). The ODN–NC complexes can be used as customer-designed fluorophores which do not have the problem of multiple conjugations. The same method enables us to fabricate PbS quantum dot molecules and connect them into nanowires, expanding their potential applications in molecule electronics and quantum computing.
Keyword:
61.46.Bc; 78.67.Bf; 87.85.jf; PbS nanoclusters; quantum dot molecules; oligodeoxynucleotides; photoluminescence
1. Introduction
The unique photophysical properties of quantum dots (QDs) have stimulated intensive research for sensing, labeling, and imaging applications.[1– 3] The florescence-aided biological research, e.g., the single molecule research, has been widely developed, just as fluorescence resonance energy transfer (FRET), fluoroimmuno and surface-plasmon field-enhanced fluorescence spectroscopy.[4– 6] Fluorescent organic molecules, as a fluorescence label, are utilized in a variety of fields in molecule biology, because they have small size, high emission efficiency, and strong covalent coupling with biological molecules. However, they also have some disadvantages: 1) photobleaching disturbs the detecting optical signal; and 2) small stokes shifts (narrow gap between the absorption and the emission peaks) lead to an overlap between the input and the output signals, [7] which can be improved when QDs take the place of the organic dye. In opposition to the organic dye, the QDs have standing photoemission, as well as tunable excitation and emission properties.[8– 10] To make use of these properties, it is usually necessary to modify the QDs’ surfaces to interact specifically with their targets. This is usually a time- and labor-intensive multistep process and thus out of reach of many researchers who wish to use customized fluorophores. Another big problem with the QDs, typically passivated with biological receptor molecules, is their larger sizes compared to those of the typical biomolecules. A conventional QD often conjugates unavoidably with more than one biomolecule, whilst many applications require a one-to-one conjugation. Reducing the size of the QD can partially solve the problem. However, when the size of a nanocluster (NC) is smaller than a nanometer, most atoms are on the surface of the NC. Dangling bonds on the surface render the NC chemically active, making it very difficult to control the size and the stability of the NC because it is self-aggregate readily.
DNA molecules have been used as templates by many researchers to grow semiconductor QDs and/or metal nanoparticles.[11– 15] Herein we modify the technique to solve the problems mentioned above. Our strategy is to use synthetic oligodeoxynucleotides (ODNs) instead of natural DNA for synthesizing NCs. The ODN has a dual functionality: 1) the highly charged ODNs repel each other so that the NCs nailed to them have little chance to collide with each other, avoiding self-aggregation; and 2) the ODN can be programmed to have one or several specific binding sites for biomolecules so that the NC can specifically conjugate with the designed number of interesting targets.
Our interest in DNA-templated growth of NCs is additionally elicited by the fact that many metal ions interact specifically with one of the four nucleotides.[16] For instance, lead ions interact specifically with guanines.[17] We propose that if the ODNs are designed to possess one or several guanines, one or several NCs can be intentionally grown at the desired sites on the ODNs. This will enable us to synthesize PbS quantum dot molecules (QDMs)[18] in copious quantities via a simple chemical approach, while they are often fabricated by complicated techniques such as metallorganic vapor-phase epitaxy and self-assembled epitaxy.[18, 19]
2. Experiment
2.1. Materials and instrumentation
Sodium salts of oligodeoxynucleotides with specific sequences were synthesized by Sangon Biotech (Shanghai) Co., Ltd and were used without any further purification. Pb(NO3)2 (99%) and Na2S· 9H2O (98%) were both purchased from Alfa Aesar. Water was purified with a Milli-Q water purification system.
The photoluminescence (PL) spectra were measured with an F-4500 Hitachi fluorescence spectrophotometer. We used a quartz cuvette to hold the ODN– PbS NC solution during the measurement. Transmission electron micrographs were obtained with a JEM-2010 transmission electron microscope (TEM) operating at 200 kV. The ODN– PbS complexes were dissolved in ethanol in order to be extended evenly onto the copper grid covered with a thin carbon film.
The gel was prepared with 20% acrylamide and N, N’ methylene bis acrylamide in a 1X TBE buffer for polyacrylamide gel electrophoresis. THe gel was run at 85 V/cm for about 3 h. The temperature was kept at 4 ° C during the running.
X-ray powder diffraction spectra were collected on a 6-circle Huber diffractometer on the BL14B1 beam line at the Shanghai Synchrotron Radiation Facility (SSRF). The wavelength of the X-rays is 0.124± 0.001 nm.
2.2. Preparation of ODN– PbS nanoclusters
Syntheses of the PbS NCs on ODN by one step and two steps were performed at room temperature with vortex agitation. In the one-step synthesis, the ODN molecules were dissolved in a 10 mM HEPES solution (from Alfa Aesar, pH = 7.4, containing 100 mM NaCl). The ODNs were incubated for 24 h in a Pb(NO3)2 solution whose concentration may vary from 3.3 mM to 10 mM. The final concentration of the ODN was 10 μ M. The intermediate product was then mixed with an equivalent Na2S solution by vigorous shaking for another 24 h. The resulting ODN– PbS complexes were purified by using a Microcon YM-100 centrifugal filter. In the two-step synthesis, the nucleation of the small NCs on the ODN followed the same procedure as the one step synthesis method described above. The concentration of the salt solution was 20 μ M for both Pb(NO3)2 and Na2S. The second process just repeated the first one except that strong salt solutions of 167 μ M were used in the second process.
3. Results and discussion
PbS is a special semiconductor material which has a narrow band gap (0.41 eV). The excitons in PbS have a large Bohr radius (18 nm)so the optical properties of PbS NCs depend strongly on the size owing to the strong quantum confinement effect. PbS QCs grown on natural DNA have been reported to have large diameters (approximately 4 nm) and luminesce in the near infrared region.[12] The alkanethiolate-passivated PbS QCs, which has luminesce at the edge of the visible region, have also been reported.[20] For practical use, one may need PbS NCs with sizes of the order of 1 nm or even smaller. In this work, we synthesized very small PbS NCs in aqueous solutions using programmed oligodeoxynucleotides as templates. The previous report described PbS quantum dots synthesized in a ligand of GTP with a 4 nm diameter, investigated several functional groups on the GTP, and revealed that the role of the GTP phosphate moiety on the PbS nanoparticles is seeding and controlling the nanoparticle growth.[17] In contrast to three phosphates in the GTP, calf thymus DNA as a ligand with only one phosphate per base did not control the PbS nanoparticle smaller than 4 nm.[12] In this work, the number, the site, and the size of PbS nanoclusters were investigated in the ODN ligand systems. We found that the concentration of the salt solution, rather than the growth time, plays a crucial role in determining the size. We first incubated the ODNs in Pb(NO3)2 solutions with different concentrations from 10 μ M to 330 μ M. The concentration of the ODNs in the mixture was fixed to 10 μ M. The intermediate product was then mixed with an Na2S solution of equivalent molar concentration by vigorous shaking. The final solution was purified using a centrifugal filter to get rid of unwanted precipitations. The length of the ODNs does not affect the optical properties of the NCs, but the sequence of the ODNs does. The ODNs act as traps for the lead ions to increase their local concentration so the PbS NCs nucleates preferentially on the ODNs. It is noteworthy that the ODNs function as pedestals for the ultrasmall NCs in the present work rather than as inert passivators for the large QDs in Refs. [12]– [14]. The resulting NCs are ultra small as can be seen from their photoluminescence (PL) spectra (Fig. 1(a)) with the smallest NCs luminescing violet light. The largest NCs we synthesized are ∼ 2.1 nm in diameter with a corresponding fluorescent peak at ∼ 814 nm (Fig. 1(a)), in accordance with the literature values.[21] In this work, the PbS NCs with different sizes together were difficult to purify due to the complex regime. However, photoluminescence spectra are good at characterising the properties of PbS NCs with different sizes in the same solution because of the relationship between bandgap and size. Here, the excitation wavelengths for different PbS NCs were decided from the photoluminescence excitation spectra (Fig. 2).
 | Fig. 1. (a) PL spectra of the NCs synthesized in low concentration Pb(NO3)2 solutions: (i) 10 μ M, (ii) 40 μ M, (iii) 80 μ M, and (iv) 330 μ M. (b) PL spectra of the PbS NCs synthesized in high concentration Pb(NO3)2 solutions: (i) 1.0 mM, (ii) 2.0 mM, (iii) 2.7 mM, and (iv) 3.3 mM. (c) PL spectra of the homogenous NCs synthesized with a two-step process. Black, gray, and dark gray lines are spectra excited with 300 nm light, 350 nm light, and 470 nm light, respectively. |
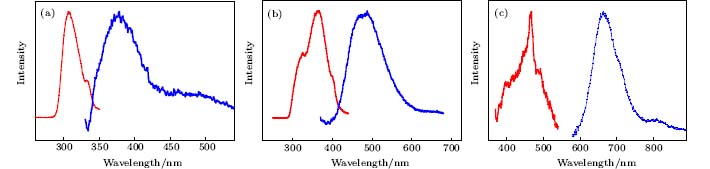 | Fig. 2. PL (blue) and PLE (red) spectra of the PbS QDs synthesized in an 80 μ M salt solution. The spectra are similar to those synthesized in solutions of different concentrations. The wavelength of the excitation light is: (a) 300 nm, (b) 350 nm, and (c) 470 nm. |
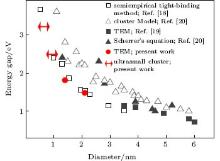
For a semiconductor crystal, the electronic excitation consists of a loosely bounded electron-hole pair, usually delocalized over a length much longer than the lattice constant. As the diameter of the semiconductor crystallite approaches the exciton Bohr diameter, its electronic properties start to change. This is the so-called quantum size effect, [22] which can be observed as a blue shift in the optical bandgap or exciton energy. For PbS, this size effect can be observed for a crystallite as large as 18 nm. The relationship between the energy gap and the size of PbS has been researched both theoretically[21, 23] and experimentally.[23, 24] Moreels et al. and Wang et al. studied PbS down to 3.5 nm and 1.3 nm in size by TEM and Scherrer’ s equation, respectively. In this work (Fig. 3), the larger NCs of ∼ 1.4 nm and ∼ 2.1 nm in the TEM image (Fig. 4) give the fluorescent peaks at 665 nm and 814 nm (Fig. 1(a)), respectively, whereas the smaller NCs which luminesce at 377 nm and 481 nm are too small to be found by TEM. According to the previous theoretical and experimental data, the diameters of the PbS nanoclusters luminescing at 481 nm and 377 nm are deduced to be around 1 nm and between 0.5 nm and 1.0 nm, respectively. The precise size of the ultrasmall PbS nanocluster is difficult to determine, however, it is the smallest cluster found in the experiment up to now. The mere physical presence of the interface between the cluster and the surrounding medium can give other interesting confinement effects. Typically, our PbS clusters are surrounded by dielectrics of the ODN molecule, which have much lower refractive indices than the inorganic semiconductor clusters themselves. Because of this refractive index boundary, the field intensity near, at, and inside the cluster surface can be enhanced considerably compared to the incident intensity. This enhancement in the local field may be considered a result of the dielectric confinement effect and could be an important factor in describing the spectroscopy, photochemistry, and nonlinear optical properties of these semiconductor clusters.[25]
 | Fig. 3. Size versus band gap of the PbS NCs. The theoretical results are obtained by the semiempirical tight-binding method[21] (□ ) and the cluster model[23] (△ ). The previous experiments were carried out by Moreels et al.[24] (■ ) and Wang et al.[23] (▲ ), respectively. The two red dots are of the two large NCs in the present work as measured by TEM (  |
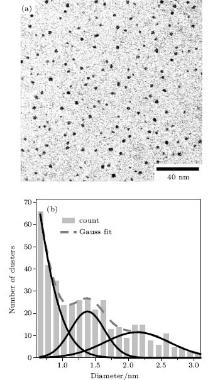
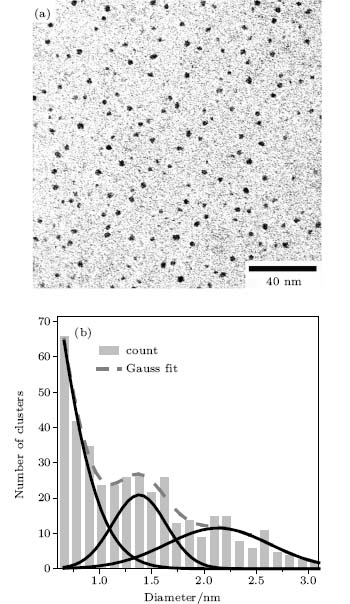 | Fig. 4. (a) TEM micrograph and (b) size distribution of the PbS NCs synthesized in a 170 μ M salt solution. The micrograph is similar than that of the NCs synthesized in other solutions. The TEM micrograph is obtained with a JEM-2010 TEM operating at 200 kV. The dashed blue line in panel (b) is a Gauss fit to the size distribution with two peaks at 1.4 nm and 2.1 nm, respectively. The peak near zero is due to the noisy signal from the carbon support film. |
The PL spectra in Fig. 1 suggest that several stable and discretely sized PbS nanoclusters are formed at different salt concentrations. Physically, the number of atoms in an ultrasmall NC does not vary continuously. These NCs have an exceptionally high stability and would form preferentially over any others of intermediate sizes.[26– 29] The isolated peaks in Fig. 1(a) are direct evidence of the existence of such NCs. The size of the NCs depends on the concentration of the solutions. For example, only the smallest NCs are synthesized when the salt concentration is lower than 40 μ M (curves (i) and (ii) in Fig. 1(a)). NCs of larger sizes emerge when the concentration of the salts is increased. Up to four isolated peaks (377 nm, 481 nm, 662 nm, and 814 nm) are observed as the salt concentration is increased continuously from 10 μ M to 330 μ M. A higher salt concentration results in a large amount of precipitates. Figure 1(b) is the PL spectra of the PbS NCs synthesized in salt solutions of very high concentration. The 377 nm and 481 nm peaks are missing because of the absence of the small NCs in the final products. When the salt concentration is increased from 1 mM to 3.3 mM, the intensity of the 665 nm peak decreases and disappears finally. This process is accompanied with increasing amounts of dark precipitates. When the salt concentration is further increased, the size of the PbS NCs is larger than 2.5 nm, and the PL peak shifts to over 1 μ m.
We noticed that the smallest NCs are homogeneous when the salt concentration is lower than 40 μ M (curves (i) and (ii) in Fig. 1(a)). We proposed that these smallest NCs can be used as seeds for further growth of large NCs, hoping that the product will also be homogeneous. We used a two-step process to synthesize the large NCs. We first let PbS nucleate on the ODNs in a 20 μ M salt solution (Fig. 1(c), lower curve), and then added the intermediate product into a solution of higher concentration (170 μ M) for subsequent growth. Only red photoluminescence peaking at 665 nm is observed (Fig. 1(c), upper curve), indicating that the resulting large NCs are indeed homogeneous. The quantum yield of the NCs is measured to be ∼ 17% using quinine sulfate in 100 mM of vitriol solution as a fluorescence standard.[30] They are bright enough for imaging applications. The luminescence wavelength of the resulting NCs is within the optical window (630– 1100 nm), [31– 33] where there is reduced absorption by biological fluids and the organic dyes emit poorly. The resulting NCs are hence ideal for biological imaging.
The large NCs, for example, those synthesized in the 170 μ M salt solution, can be recognized by TEM (Fig. 4). One sees two peaks at ∼ 1.4 and ∼ 2.1 nm from the size distribution of the NCs in the inset of Fig. 4. The corresponding fluorescent peaks are at 665 nm and 814 nm (Fig. 1(a)), respectively, in accordance with the literature values.[34] The smaller NCs which luminesce at 377 nm and 481 nm are too small to be seen by TEM. However, their existence can be evidenced by X-ray diffraction.
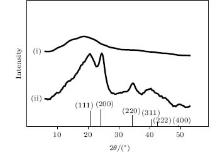
Samples for the X-ray diffraction were prepared by placing a drop of PbS– ODN solution on the surface of a silicon wafer and letting it dry in air. Figure 5 depicts two diffraction patterns of the samples prepared using the two-step process, with curve (i) being of the first step product and curve (ii) of the second step product. The broadening of the Bragg peaks in curve (ii) is inconsistent with the size (∼ 1.4 nm) of the PbS NCs which luminesce at 665 nm, where the size is obtained by Scherrer’ s equation. The scattering pattern of the first step product looks like that of small clusters with only a few atoms, making it difficult to index. As a control, we found that the same amount of ODN on a silicon surface gives no detectable X-ray scattering signals.
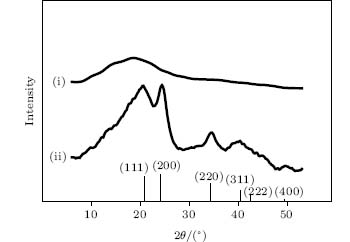 | Fig. 5. X-ray diffraction patterns of atomic clusters of PbS (i) and PbS nanocrystals (ii). The vertical lines are Bragg peaks of bulk PbS with wurtzite structure. The wavelength of X-rays is 1.24 Å . |
In contrast to the previous work where the quantum dots were grown on the natural nucleic acids as the template, [12, 17, 35] it is interesting that the PbS quantum dots are synthesized on the ODN molecules due to their programmable property. To date, several researches have involved the DNA segment as the substrate molecule for constructing the block structure.[36, 37] In the above mentioned researches, the ODN was regarded as the connection part to build the nanostructure material. However, we develop the ODN molecule as a controllable template to synthesize the PbS nanoclusters. Previously, different nucleotides were used as ligands for PbS, and it was found that the GTP produces materials with the highest quantum yields, because G exists with different functionalities.[17] Therefore, it is mainly concerned with the site of G on the sequence of the ODN. To test that the NC can be nailed to a specific site on the ODN, we designed two types of ODNs which contain one and two guanines, respectively. Type I with a sequence of 5′ -TAA AAA TAA AAA AAT ATT AGA AAT ATA ATA ATT TAT ATT-3′ contains a guanine at the center. Type II with a sequence of 5′ -ATT TTA TAA AGA ATT TAT AAA TAT TTA TGA TAT TAT ATT-3′ contains two guanines at the 11th and the 28th bases, respectively. The ODNs were hybridized with their complementary chains before use. Figure 6(a) is the polyacrylamide gel electrophoresis (PAGE) image of the ODN– PbS complexes. Beside the heavy bands which correspond to the naked ODNs, there is one light band in lane 1 with type I ODN and two light bands with type II ODN. The topmost band in lane 2 corresponds to the ODN with a pair of NCs on it, while the central band in lane 2 and the top band in lane 1 correspond to the ODN with a single NC on it. The TEM images confirm the conclusion. For example, only single NCs are observed for type I ODN (Fig. 6(c)), while both single and paired NCs are observed for type II ODN (Fig. 6(d)). The distance between the two NCs in each pair is ∼ 6.5 nm, which agrees well with the distance between the two guanines in type II ODN. We therefore demonstrated that, using the present strategy, one can easily fabricate quantum dot molecules (QDMs)[18, 19] in a controllable manner. The controlled coupling of excitonic states in the QDMs is an important ingredient in quantum computing and quantum communications applications.[38– 42] Measurement on the optical properties of the QDMs at low temperatures is in progress in our laboratory.
 | Fig. 6. (a) PAGE image of the ODN– PbS complexes. Lane 1 is for type I ODN and lane 2 for type II ODN. The white arrow marks the ODN with 1 QD, the black arrow marks the ODN with a pair of QDs, and the grey arrow marks the naked ODN. (b) Structure models of the ODN– PbS complexes. (c) and (d) TEM images of the QDs on type I and type II ODN, respectively. |
The synthesized ODN– NC complexes can be used as biosensors or fluorescent probes. The conjugation sites of our ODN– NC complexes can be specifically designed. For example, one can attach an antigen (e.g., a biotin or a digoxigenin) to one end of the ODN so that it can be conjugated to an antibody-tagged protein. One can also attach two different antigens at the two ends of the ODN so that it can be conjugated to two difference proteins. The problem of uncontrollable multiple conjugation, which has embarrassed researchers for many years, can thus be avoided. Moreover, the ODN itself can serve as a receptor for molecular recognition, [14, 43] further expanding their applications. The ODN– NC complexes can also be used as building blocks for functional nanowires which are potentially useful in molecule electronics. To demonstrate this idea, we programmed double stranded ODNs with sticky ends. The sequences of the four ODNs are listed in Table 1. The double stranded ODN12 molecules were obtained by annealing ODN1 and ODN2, and the double stranded ODN34 were from ODN3 and ODN4. The double stranded ODN12 has 5′ -TTTT sticky ends which are complementary to the 5′ -AAAA sticky ends of the double stranded ODN34. After growing the two types of ODN– NC complexes, they were mixed in a PBS buffer and connected to the ODN– PbS nanowires using T4 DNA ligase. The length of the resulting ODN– PbS nanowires depends on the concentration of the T4 DNA ligase and the reaction time. The TEM image in Fig. 7 clearly shows that an ODN– PbS nanowire is formed.
| Table 1. Sequences of ODNs for the construction of the ODN– PbS nanowires. |
 | Fig. 7. TEM image of a nanowire produced by connecting the ODN– PbS complexes. |
4. Conclusion
We developed a simple method to synthesize PbS nanoclusters using guanine-containing ODNs as templates. The ODN– NC complexes can be used as customer-designed fluorophores which do not have the problem of multiple conjugations. The same method enables us to fabricate quantum dot molecules and connect them into nanowires, expanding their potential applications in molecule electronics and quantum computing. Importantly, many metal ions interact specifically with one of the four nucleotides, [16] making it possible to use as a biological label and generalize the method.
The authors thank beamline BL14B1 (Shanghai Synchrotron Radiation Facility) for providing the beam time.
Reference
| 1 |
|
| 2 |
|
| 3 |
|
| 4 |
|
| 5 |
|
| 6 |
|
| 7 |
|
| 8 |
|
| 9 |
|
| 10 |
|
| 11 |
|
| 12 |
|
| 13 |
|
| 14 |
|
| 15 |
|
| 16 |
|
| 17 |
|
| 18 |
|
| 19 |
|
| 20 |
|
| 21 |
|
| 22 |
|
| 23 |
|
| 24 |
|
| 25 |
|
| 26 |
|
| 27 |
|
| 28 |
|
| 29 |
|
| 30 |
|
| 31 |
|
| 32 |
|
| 33 |
|
| 34 |
|
| 35 |
|
| 36 |
|
| 37 |
|
| 38 |
|
| 39 |
|
| 40 |
|
| 41 |
|
| 42 |
|
| 43 |
|