Growth of PbS nanoclusters on specific sites of programmed oligodeoxynucleotides
Growth of PbS nanoclusters on specific sites of programmed oligodeoxynucleotides |
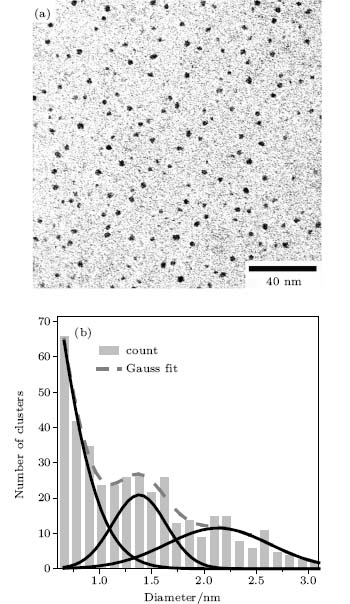
| Fig. 4. a TEM micrograph and b size distribution of the PbS NCs synthesized in a 170 #cod#x03BC;M salt solution. The micrograph is similar than that of the NCs synthesized in other solutions. The TEM micrograph is obtained with a JEM-2010 TEM operating at 200 kV. The dashed blue line in panel b is a Gauss fit to the size distribution with two peaks at 1.4 nm and 2.1 nm, respectively. The peak near zero is due to the noisy signal from the carbon support film. |
| |