1. IntroductionThe emergence of two-dimensional transition metal dichalcogenides (2D-TMDs) offers exciting opportunities for probing new physical phenomena and potential applications in catalysis,[1,2] optoelectronics,[3,4] nanoelectronics,[5–7] etc. For example, Maeso et al.[4] recently investigated the electrical and optical properties of vertical few-layer MoS2 and found that the light absorption can be improved by fabricating vertical photodevices using few-layer flakes, achieving a photoresponse up to 0.11 A⋅W−1 and an external quantum efficiency up to 30%. Shahraki et al.[6] reported that MoS2 multilayers have unique mechanical and electrical properties, which can be a promising channel material for the n-type piezoelectric field-effect transistor. However, considering that the devices constructed of TMDs are often worked under various environments,[8–12] it is necessary to explore the change of related material properties under the external stimulus.
In particular, external pressure provides a viable avenue to modulate the crystal structure and electronic properties in a clean and precisely controllable manner. Currently, a series of experiments[13–19] and theories[20–22] showed that the phase transition of 2Hc-to-2Ha and metallization in MoS2 can be induced by hydrostatic pressure. Especially, the exciting properties of pressure-induced superconductivity emerged in 2Ha-MoS2 and proved that 2Ha-MoS2 is a high-pressure stable phase,[23] while the phase transition of 2Hc-to-2Ha is absent in MoSe2, MoTe2, and WS2 under the condition of hydrostatic pressure.[22,24–27] Therefore, it is an urgent issue to explore the pressure-dependent phase transition of MoS2 from 2Hc-to-2Ha. For the case of bulk MoS2, many experimental measurements showed the transition of 2Hc-to-2Ha, associating with a semiconducting-to-metallic state, but there are large differences in the values of transition pressure measured by different experimental groups (18.5–26 GPa).[13–19] Also, the structural transition of 2Hc-to-2Ha and metallization in bulk MoS2 under pressure have been reported by using first-principle calculations and molecular dynamics simulations and the values of pressure are in the range of 13 GPa to 20 GPa.[13,20–22] In addition, the transition pressure of MoS2 from 2Hc-to-2Ha under hydrostatic pressure increases from 19.0 GPa to 36.0 GPa as the thickness reduces from bulk to bilayer.[19] Meanwhile, MoS2 undergoes a metallization transition upon hydrostatic pressure, while the transition pressure decreases as the number of layers increases.[28,29] However, there are great differences (13–26 GPa) in transition pressure between some experiments and theories for MoS2. Furthermore, the potential mechanisms of structural transition, pressure metallization, and related evolution in MoS2 have not been comprehensively understood. In particular, the pressure-size phase diagram is still unclear.
In this paper, we investigate the structural transition and metallization of MoS2 under pressure based on the bond relaxation method and thermodynamics. It is found that the transition pressures of 2Hc-to-2Ha and metallization increase significantly with a decreasing number of layers, while the change rate of structural transition is greater than that of metallization. Moreover, we establish a size-pressure phase diagram of MoS2, identifying the transition mechanism of the structural properties.
2. Theoretical modelMoS2 consists of intralayer strong covalent bonding and is stacked with interlayer by weak vdW bonding. Noticeably, the structural transition of 2Hc-to-2Ha originates from the interlayer sliding. Conventionally, the Gibbs free energy Gsum (P) of MoS2 under hydrostatic pressure is Gsum (P) = G0 + G(P), where G0 is a reference value at ambient pressure, and G(P) is a part of the pressure-induced energy storage of unit cell. Since G(P) = – ∫ SdT + ∫ V dP and the temperature is almost unchanged under the approach of pressure, the equation can be simplified into G(P) = ∫ V d P.
Under the condition of hydrostatic pressure, the lattice strain can be expressed as ε (x,y,z) = l/l0 – 1, where l and l0 denote the length after and before relaxation along x-, y-, and z-directions. For the intralayer of 2Hc and 2Ha phases, it is feasible to take the elastic modulus as a constant in a small strain range due to the strong ionic-covalent bonds, while assuming that sliding of interlayer does not change the properties with intralayer.[30,31] Therefore, the pressure-dependent strain of intralayer along with x-, y-, and z-directions can be shown as

where
Yx,
Yy, and
Yz are the elastic moduli of intralayer along
x-,
y-, and
z-directions.
v∥ and
v⊥ are the in-plane and out-of-plane Poisson’s ratios, respectively. It should be noted that the elastic moduli in
x-,
y-,
z-directions are 200.3 GPa, 197.8 GPa, and 511 GPa and the in-plane and out-of-plane Poisson’s ratios are 0.21 and 0.27, respectively.
[30,32–34] εx =
a/
a0 – 1,
εy =
b/
b0 – 1, and
εz =
c/
c0 – 1, where
a (
b) and
a0 (
b0) are the strained and the equilibrium lattice parameters, respectively.
c and
c0 correspond to the distances of S–S after and before being compressed. The bond length

, and bond angles

and

.
In general, the interlayer interactions of the adjacent layers in MoS2 include three kinds of modes, i.e., S–S, S–Mo, and Mo–Mo, and the interaction can be described by the Lenard-Jones potential, i.e., U(r) = –Γ [ (σ/rij)12 – (σ/rij)6 ], where rij denotes the distance between i and j atoms. (σ/rij)12 and (σ/rij)6 are the pairwise repulsion and attraction, respectively. For the nearest-neighbor interaction, the equilibrium spacing r0 is related to σ as  .[32,35] Γ corresponds to the depth of the energy well at the equilibrium separation.[32,36] In our case, we take Γ(σ) of S–S, S–Mo, and Mo–Mo as 0.024 eV (3.13 Å), 0.0028 eV (3.67 Å), and 0.00059 eV (4.20 Å), respectively.[32,35,36] The total van der Waals (vdW) interaction energy can be written as
  . Moreover, the average interlayer interaction of unit cell for two phases of 2Hc and 2Ha through taking into account of the nearest neighbor atoms is
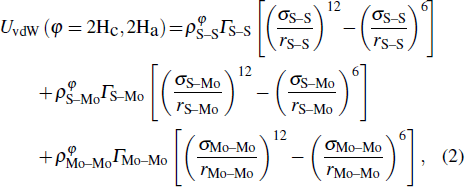
where

,

, and

are the numbers of atom interaction in the unit cell. For the case of 2H
c-MoS
2,

,

,

,

,

, and

. While for 2H
a-MoS
2,

,

,

,

,

, and
rMo-Mo =
t2 +
c.
t1 and
t2 are the pressure-dependent interlayer separations of 2H
c and 2H
a phases, respectively. Conventionally, the equilibrium interlayer distance of the two phases can be obtained by
∂UvdW /
∂t |
t = t01,t02 = 0, where
t01 and
t02 are the interlayer distances at ambient pressure. Also, the interlayer elastic modulus is described by the second derivative of the interlayer interaction energy, namely,
Y(
t) =
N0 ⋅ d
2UvdW / d
t2,
[36] where
N0 = 11 nm
2 is the number of atoms. Thus, the strain in the interlayer under hydrostatic pressure can be obtained as

where
εt =
t/
t0 – 1.
t and
t0 are the interlayer separations after and before being compressed in both 2H
c and 2H
a phases, respectively. Therefore, the pressure-dependent unit volume of bulk MoS
2 can be shown as
V(
P) =
a ⋅
b ⋅ (
c +
t). Combining with the above relationship, we obtain the relative Gibbs free energy of 2H
a- and 2H
c-MoS
2 in bulk,

, where
G01 and
G02 are the energies of 2H
c and 2H
a phases at ambient pressure.
Generally, the thermal stability of a system is determined by the cohesive energy.[37,38] Moreover, the transition pressure (Pc ) of the specimen correlates to the cohesive energy, i.e.,  , where zi and Ei are the coordination number (CN) and the single bond energy for all atoms, respectively. D is the thickness of MoS2. Clearly, the compression of the bond length and the bond strength will be stronger under the condition of pressure, resulting in the increasment of the transition pressure, while decreasing thickness leads to the reduction of the transition pressure because of the lower cohesive energy.[38,40] Therefore, the competition between energy enhancement induced by external pressure and reduction driven by the thickness down to nanoscale determines the transition pressure.
In the case of pressure, the entire atomic bonds of the specimen become shorter and stronger because of volume shrinkage and deformation energy storage. Therefore, according to the integral of the volume-pressure profile, the pressure-induced energy storage is

where
β = d
V / (
V0d
P) and equals to the inverse of bulk modulus. The approximation of

can be as a constant. Therefore, the relative change of transition pressure is

where
PcD and
Pcb are the transition pressures of the film and the bulk counterparts, respectively.
In addition, in light of the atomic-bond-relaxation (ABR) method,[41,42] the atoms located at the edge will relax spontaneously. Therefore, the intra-atomic potential well depresses from Eb to  , where Eb denotes the single bond energy of the bulk counterpart, and the index m is the bond nature factor. ci = 2/( 1 + exp (( 12 – zi)/8zi)) is the bond contraction coefficient.[41,42] Thus, the thickness-dependent transition pressure is

where
zib =
zi/
zb.

is the surface-to-volume (SVR). Combining the pressure-induced magnifying and thickness-induced decreasing of the transition pressure, we obtain

On the other hand, the variation of the bond parameters in MoS2 would induce the change of the system energy, and the interaction potential of intralayer consists of bond-stretching energy Ubond, bond angle variation energy Uangle, and Coulomb electrostatic energy Ucoul,[43,44]

Here
Ubond =
D0 × [ 1 – e
−α (d – d0 )]
2,

,

, where
D0,
α,
kθ, and
kψ are the bond potential parameters. The values of
D0,
α,
kθ, and
kψ are 19.945, 0.858, 0.9387, and 0.8631.
[43,44] qi and
qj are the partial electrostatic charges, which are 0.76
e and –0.38
e for Mo and S atoms, respectively.
Combining the interaction potentials of intralayer and interlayer, the pressure-induced variation of the average single bond energy in MoS2 can be shown as  , where ΔUtra is the single bond energy variation of the intralayer, and
  is the interlayer interaction of an S atom. The superscripts 1 and 2 of the interlayer energy represent the 2Hc and 2Ha phases, respectively. Thus, the cohesive energy of the system under the pressure is

where
EB =
Eb + Δ
EP, and

.
Ni and
N correspond to the atomic number of the
ith surface layer and the total number of the system, respectively. Notably, the bandgap is proportional to the single bond energy, i.e.,
Eg ∝ 〈
E0 〉 =
EC/
N〈
z 〉, where

is the average CN.
[41,42] Consequently, by combining with the relationship shown above, the thickness-dependent bandgap in MoS
2 under hydrostatic pressure is

where
zi b =
zi/
zb, and

denotes the bandgap of bulk 2H
c-MoS
2.
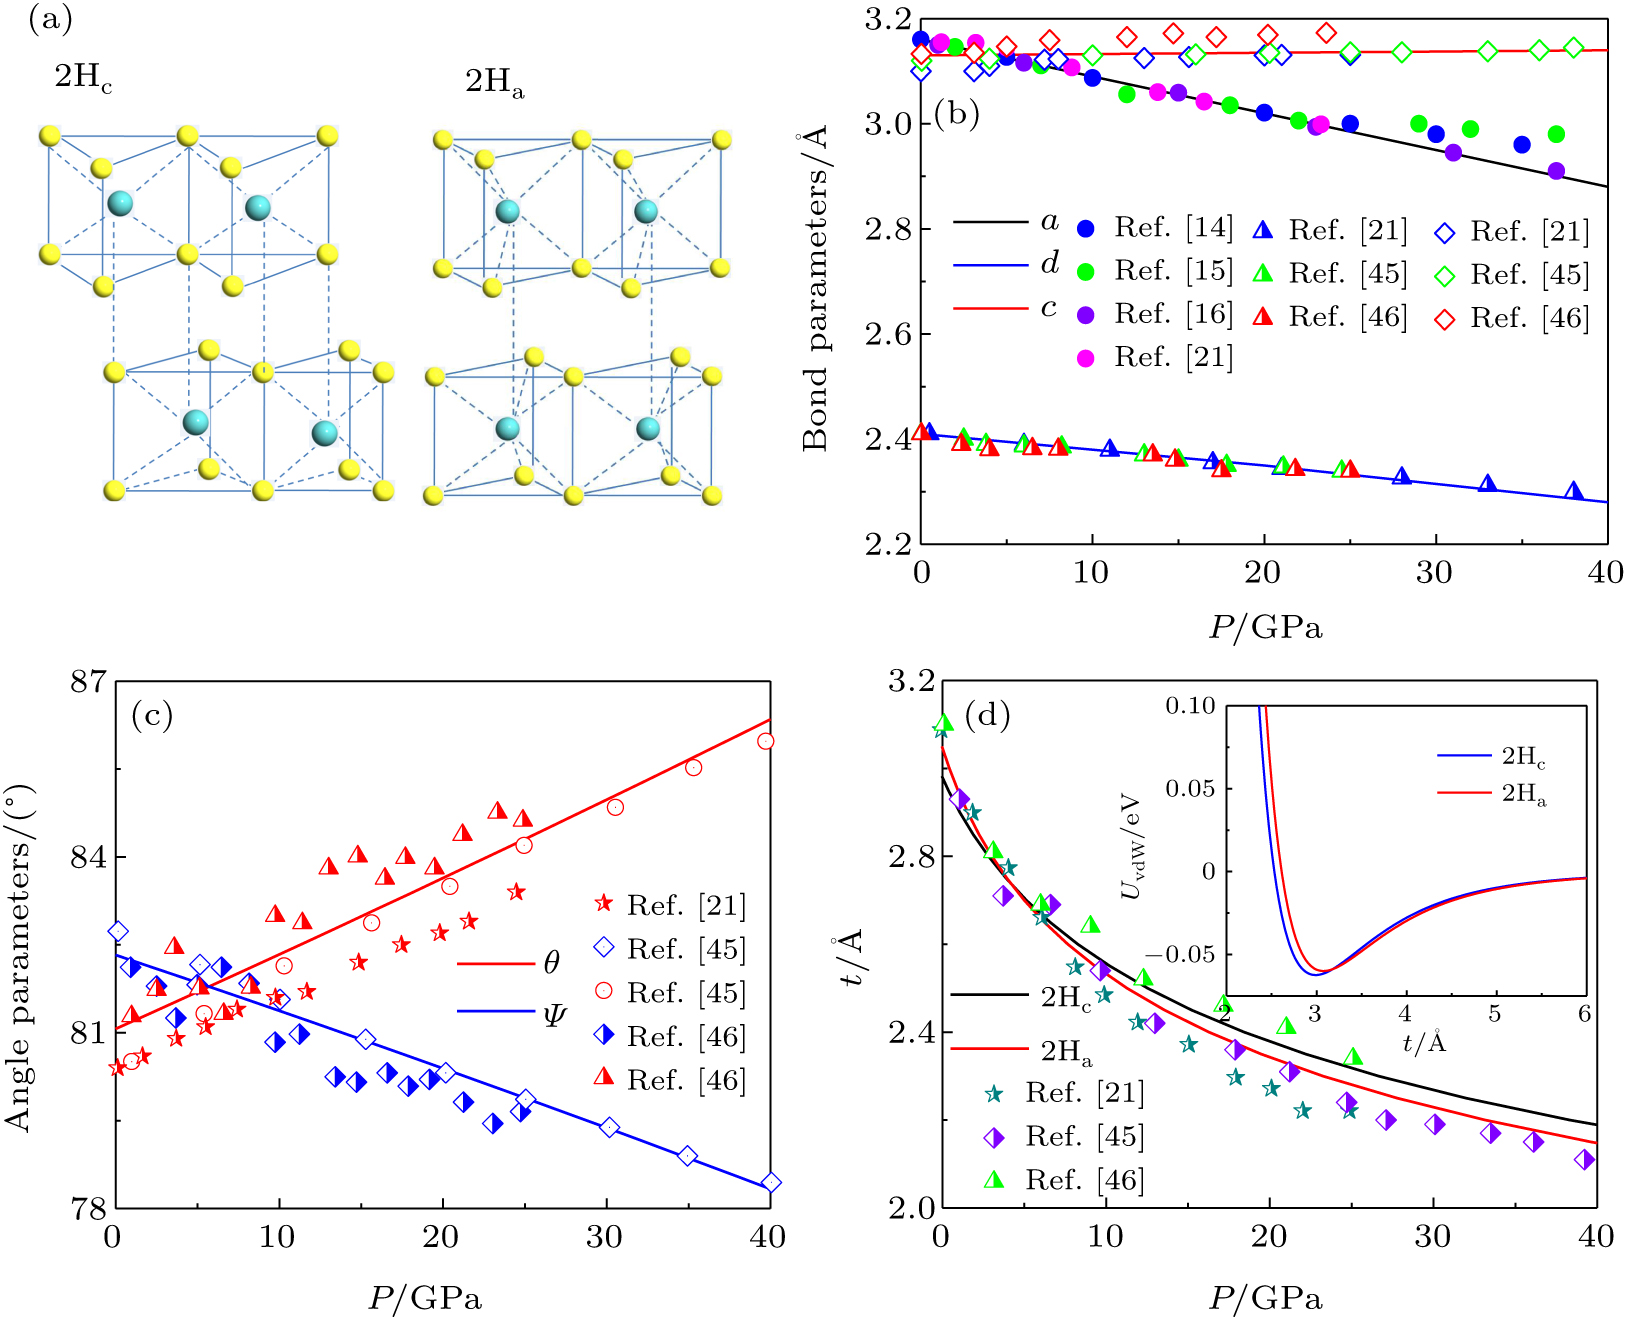
3. Results and discussionFor the case of 2Hc-MoS2, the Mo atoms in one sheet are on the top of the S atoms in the next, while there is a misalignment between S atoms of the adjacent layer for 2Ha-MoS2(Fig. 1(a)). It is found that increasing hydrostatic pressure leads to a decrease of the lattice parameter a (the bond length d) and an increase of the thickness of the intralayer (Fig. 1(b)). The variation trends of bond angle in the opposite directions are the consequence of changes from in-plane θ and out-of-plane ψ with increasing pressure (Fig. 1(c)). The changes of lattice parameter and bond length are approximately linear due to strong covalent bonding between the Mo and S atoms, while an expansion of intralayer with the pressure is due to the effect of negative Poisson’s ratio. In light of the ABR consideration,[41,42] the interlayer distances are 2.99 Å and 3.05 Å for 2Hc and 2Ha phases at ambient pressure, respectively (the inset of Fig. 1(d)). In detail, the phase transition does not change the interaction of S–S, while the interaction distances of Mo–S and Mo–Mo have been changed. Therefore, the interlayer distance is determined by the interactions of Mo–S and Mo–Mo. However, the interactions of Mo–S and Mo–Mo are weak at the interlayer, resulting in a small difference between the two phases. Notably, the interlayer distance of MoS2 decreases significantly and non-linearly with increasing pressure, reflecting that the interlayer is associated with weak vdW bonding (Fig. 1(d)). Importantly, the change rate decreases with reducing interlayer distance due to the strong vdW interaction caused by the reduction of the interlayer distance. Furthermore, the variation range of 2Ha-MoS2 is slightly larger than that of 2Hc-MoS2, suggesting that the stacking order affects the interlayer interaction. Evidently, the changes in bond parameters are consistent with the available results from experimental measurements and theoretical calculations.[21,45,46]
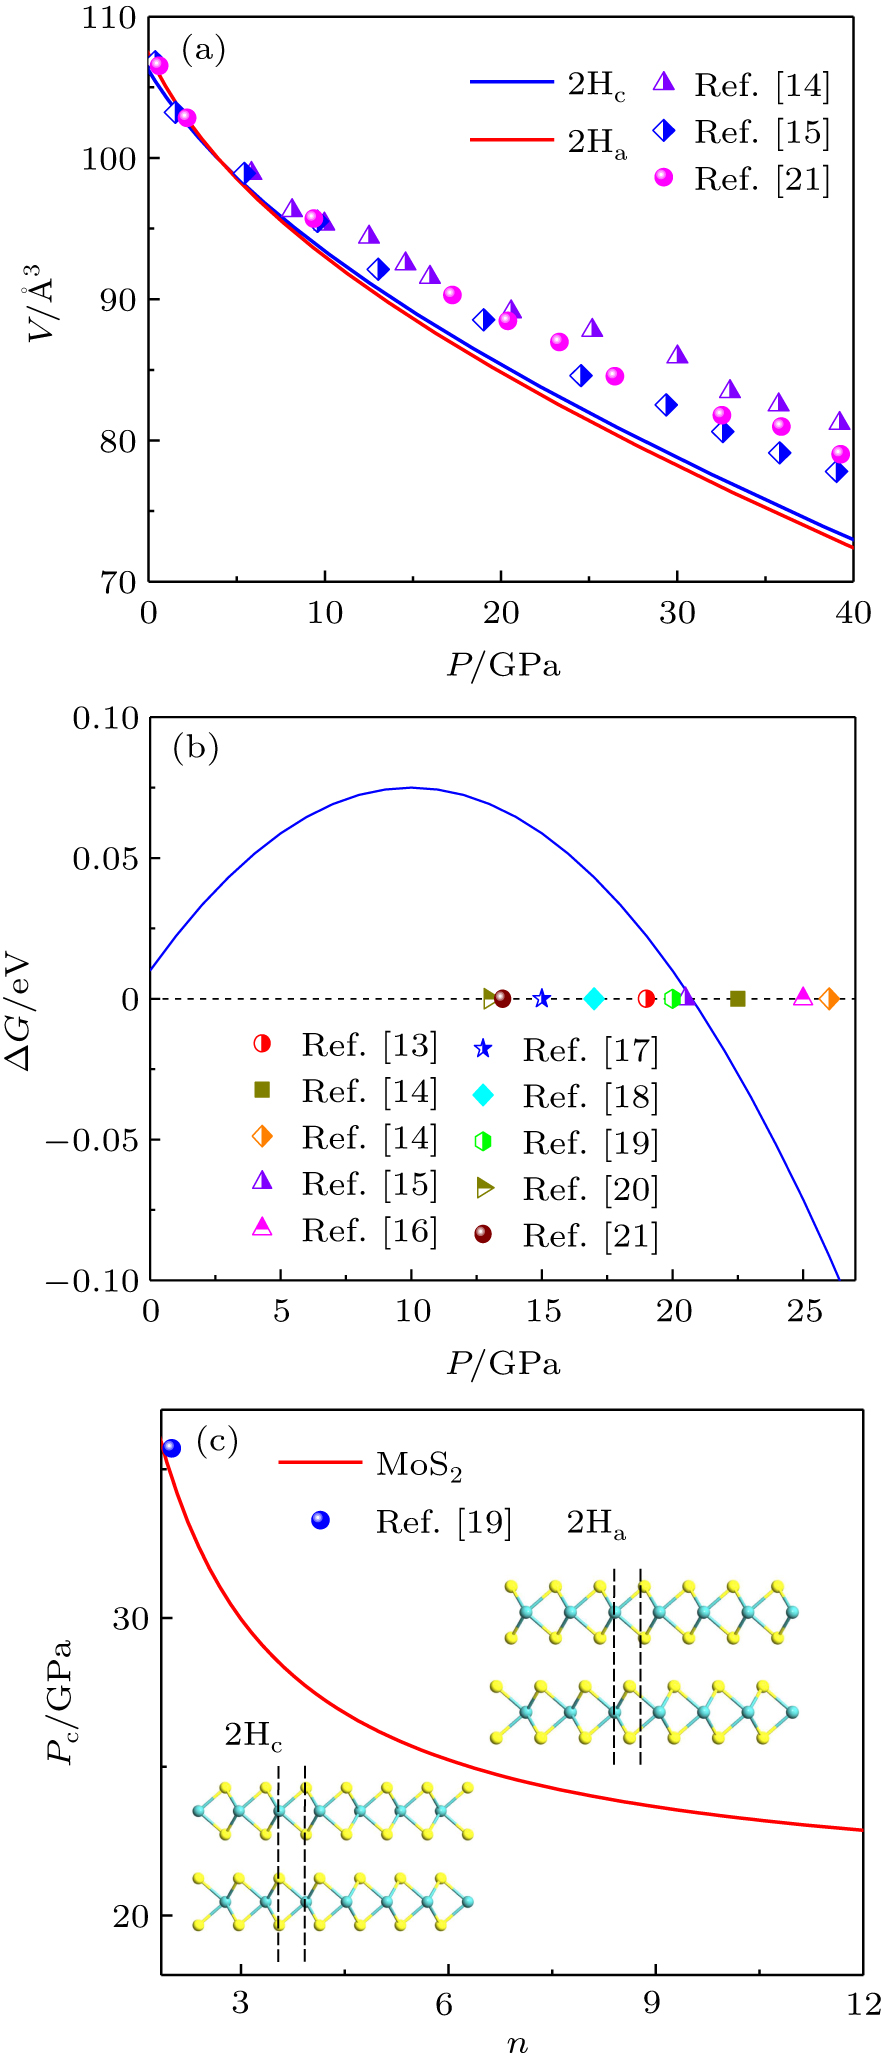
Figure 2(a) shows the relationship between pressure and unit volume of bulk MoS2 in 2Hc and 2Ha phases. It is observed that the volume decreases gradually with increasing pressure and the volume of 2Hc is larger than that of 2Ha under high pressure as the variation of the volume is mainly contributed by the interlayer separation. In addition, fitting the curves of P–V by the third-order Birch–Murnaghan equation of state  ,[47,48] we obtain the bulk moduli of 2Hc and 2Ha phases as B0 = 76.06 ± 0.11 GPa (B’ = 3.12 GPa) and B0 = 85.13 ± 0.21 GPa (B’ = 2.57 GPa), respectively. The bulk moduli obtained in our studies are qualitatively in agreement with the results reported by Aksoy et al.[15] and Bandaru et al.[16] Figure 2(b) shows the pressure-dependent difference of Gibbs free energy of 2Ha- to 2Hc-MoS2. The Gibbs free energies of the two phases cross near 20.6 GPa, indicating that the structural transition will take place. Notably, the large difference of transition pressure in some experiments may be due to two main factors: (1) different types of defects may appear in the samples, such as vacancies or dislocations, which affect the interlayer interaction; (2) different characterized methods, such as Raman spectra and x-ray diffraction, may lead to the differences.[14,17–19] In nature, reducing the size to nanoscale, the surface state of a nanomaterial is different from that of the bulk counterpart due to the low coordination numbers of the surface atoms, which infers that the transition pressure will be significantly affected by the surface effect. Figure 2(c) shows the layer-dependent transition pressure of MoS2 from 2Hc-to-2Ha. Clearly, the transition pressure is significantly enhanced from 20.6 GPa to 34.8 GPa as the thickness reduces from bulk to bilayer. Originally, the increase of the transition pressure can be attributed to the competition between pressure-induced enhancement and thickness-induced reduction of atomic cohesive energy. Similarly, Cheng et al.[19] demonstrated that the transition pressure of 2Hc-to-2Ha in MoS2 can be continuously tuned from 19 GPa to 36 GPa by reducing the thickness from bulk down to bilayer by Raman analysis. As shown in the inset of Fig. 2(c), the phase transition from 2Hc-to-2Ha is through the sliding of the interlayer, which changes the stacking order of the adjacent layer. Generally, this structural transition is absent in the case of monolayer duo to lack of interlayer interaction.
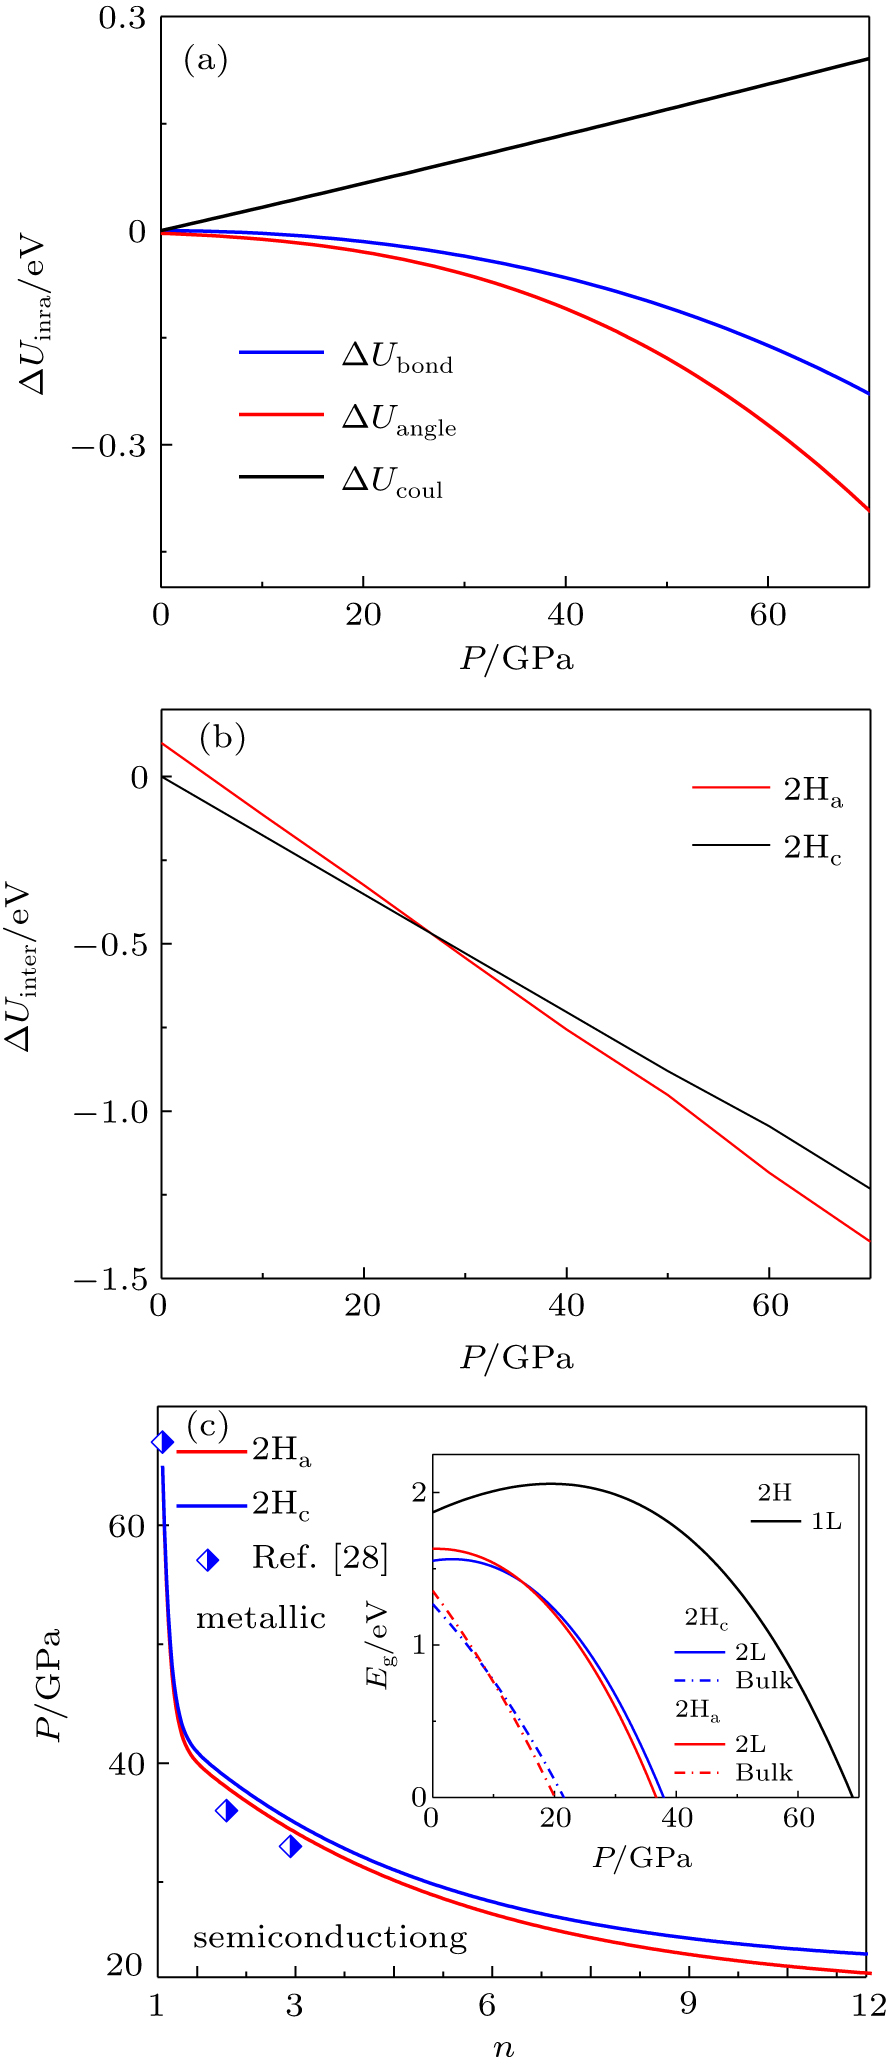
Figure 3 depicts the pressure-dependent energy gain and band shift in MoS2. Especially, the bond stretching and bond angle relaxation are monotonically decreasing, and the electrostatic interaction increases approximately linearly with increasing pressure, as shown in Fig. 3(a). It is obvious that the bond stretching energy and bond angle relaxation energy are negative, while the electrostatic interaction energy is positive. In addition, the interlayer interaction of S atom decreases approximately linearly with increasing pressure (Fig. 3(b)). Notably, the change rate of the interlayer interaction energy of 2Ha with increasing pressure is greater than that of 2Hc. In general, when the system is perturbed by the external environment (such as doping and pressure), the system will relax to a new self-equilibrium state. In our case, the bandgap of bulk MoS2 is red-shift with increasing pressure due to strong interlayer interactions and metallization at pressures of 23 GPa and 21 GPa for the 2Hc and 2Ha phases, respectively.
For the cases of monolayer and bilayer MoS2, the bandgap blue-shifts first and then red-shifts with increasing pressure as shown in the inset of Fig. 3(c). In fact, the physical origin can be ascribed to the limited interlayer interaction and positive electrostatic interaction energy. Interestingly, the metallization of monolayer 2H-MoS2 under pressure emerges at a pressure of 65.0 GPa, while for the bilayer MoS2 with 2Hc and 2Ha phases, the metallization will be observed at 38.7 GPa and 37.9 GPa, respectively. Importantly, it can be clearly seen that the transition pressure of semiconductor-to-metal decreases as the number of layers increases and the metallization of the 2Ha phase is easier to achieve than that of the 2Hc phase (Fig. 3(c)). Similarly, Nayak et al.[28] and Kim et al.[29] found that the transition pressure decreases as the number of layers increases based on the density functional theory. Essentially, for 2H-MoS2, the valence band maximum (VBM) and the conduction band minimum (CBM) are mainly dominated by the d orbitals of the Mo atoms and p orbitals of the S atoms. Under the hydrostatic pressure, the strong hybridization between the d orbitals (mainly dz2, dxy, and dx2 – y2 ) of Mo atoms and p orbitals of S atoms will result in the overlap between VBM and CBM as well as metallization.[28,29] Moreover, the stacking order between layers has a direct relationship with the transition pressure for MoS2. Therefore, the system undergoes a series of phase transitions under pressure, which is from the semiconducting 2Hc-to-2Ha phases and to the metallic 2Ha phase with the pressure up to 70 GPa.
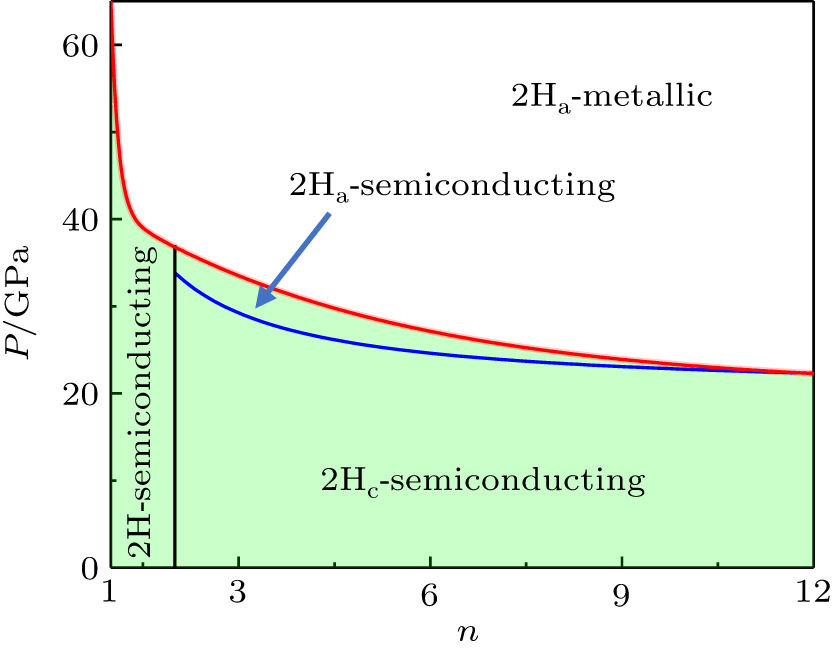
Based on the discussion mentioned above, we further establish a size-pressure phase diagram of 2H-MoS2, as shown in Fig. 4. Also, we obtain the values of two types of phase transitions with different cases, which are in good agreement with the previous results (Table 1). Evidently, the sliding of interlayer takes place at the structural transition from 2Hc-to-2Ha and the transition pressure increases with a decreasing number of layers. In addition, the metallization arises from the overlap of CBM and VBM owing to the variation of the crystal potential induced by the change of bond identities. For multilayer and bulk MoS2, the interlayer interaction is found to control the electronic structure, while for the case of monolayer MoS2, the changes in the electronic structure under pressure are mainly controlled by the bond length and bond angle. Notably, for n > 10 layers, the structural transition and metallization in MoS2 are almost complete simultaneously and the transition pressures are 20.6 GPa and 21 GPa, respectively. However, for n < 10 layers, the material becomes metallic when the structural transition is complete.
Table 1.
Table 1.
 Table 1. Calculated transition pressure (in GPa) of two types of phase transitions of MoS2 for different cases. .
| Phase transition types |
|
Monolayer |
Bilayer |
Trilayer |
Bulk |
| 2Hc-to-2Ha |
our results |
– |
34.8 |
30.6 |
20.6 |
|
previous results |
– |
36.0d |
– |
19.0a, 23.0b, 26.6b, 20.5c |
| Semiconducting-to-metallic |
our results |
65.0 |
37.9 |
33.4 |
21.0 |
|
previous results |
67.9e |
39.2e |
29.5e |
19.0a, 22.3e |
a Ref. [13],
b Ref. [14],
c Ref. [15],
d Ref. [19],
e Ref. [28].
| Table 1. Calculated transition pressure (in GPa) of two types of phase transitions of MoS2 for different cases. . |


