Scaling behavior of thermal conductivity in single-crystalline α-Fe2O3 nanowires
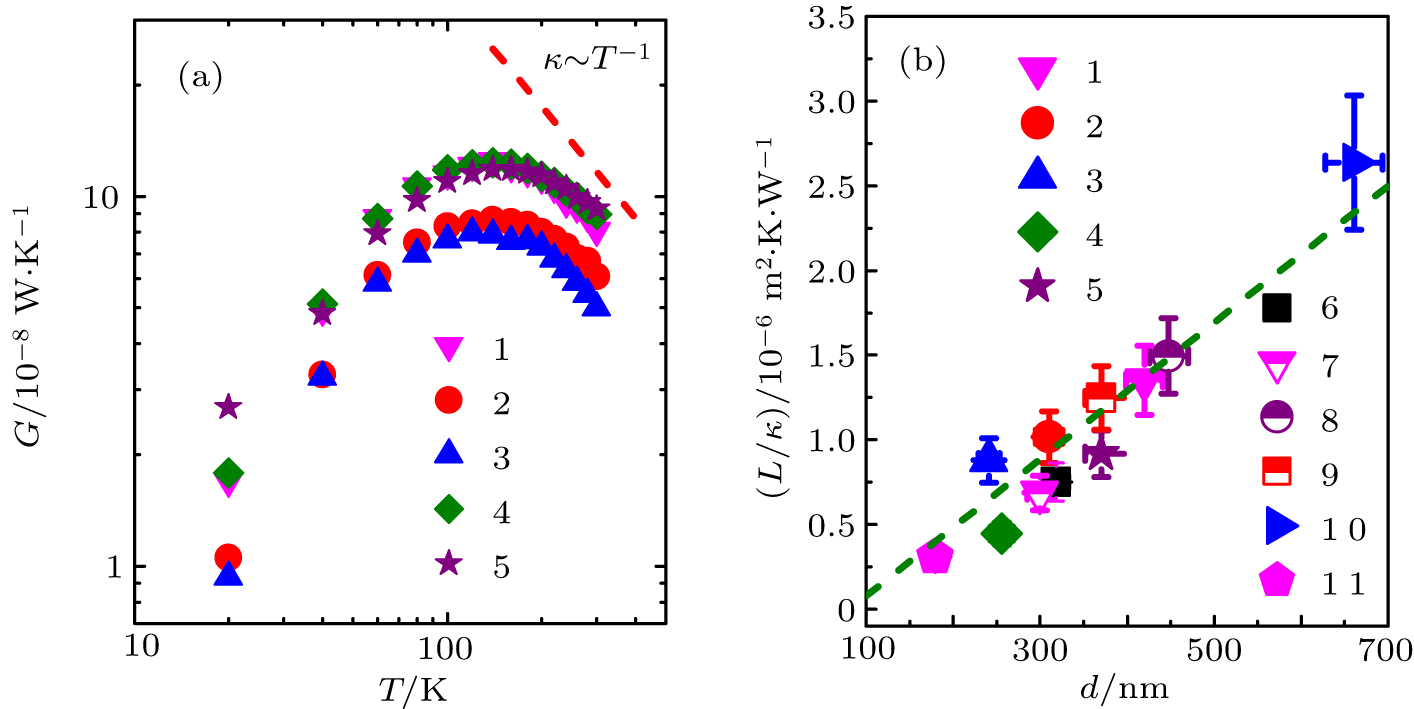
Temperature and size dependent thermal conductivity of the individual nanowires. (a) G vs. T. The red dash line shows the T−1 dependency. (b) L/κ vs. d at T = 300 K, the green dashed line is a guide to the eyes.
