Measurement and verification of concentration-dependent diffusion coefficient: Ray tracing imagery of diffusion process
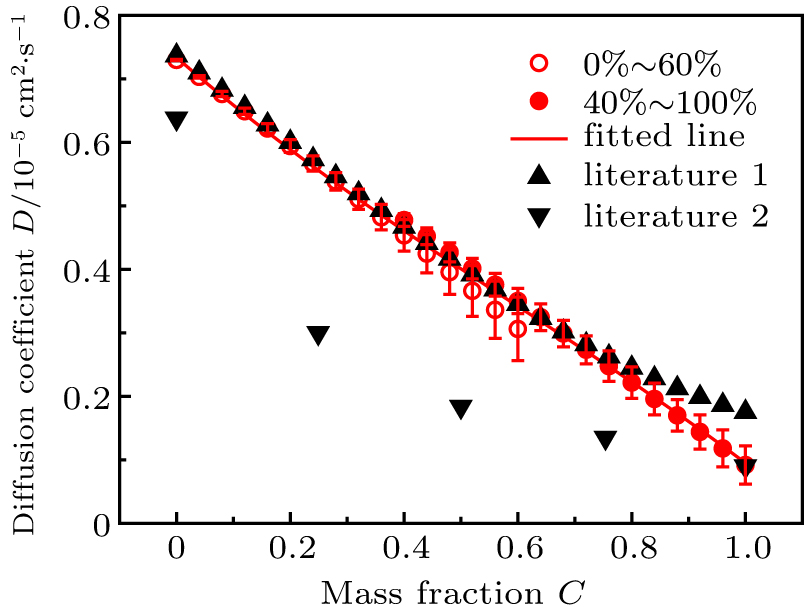
Comparison of D(C) between measured values and literature values. Red empty circle represents measured value of D1(C) in concentration range of 0%–60%. Solid red circle denotes measured value of D2(C) in concentration range of 40%–100%. Solid line refers to fitting curve D(C) in concentration range of 0%–100%. Upper triangle represents measured values of literature 1. Lower triangles are for measured values of literature 2. Error bars, which are magnified 5 times for the sake of clarity, are determined by ten-time independent measurements.
