Measurement and verification of concentration-dependent diffusion coefficient: Ray tracing imagery of diffusion process
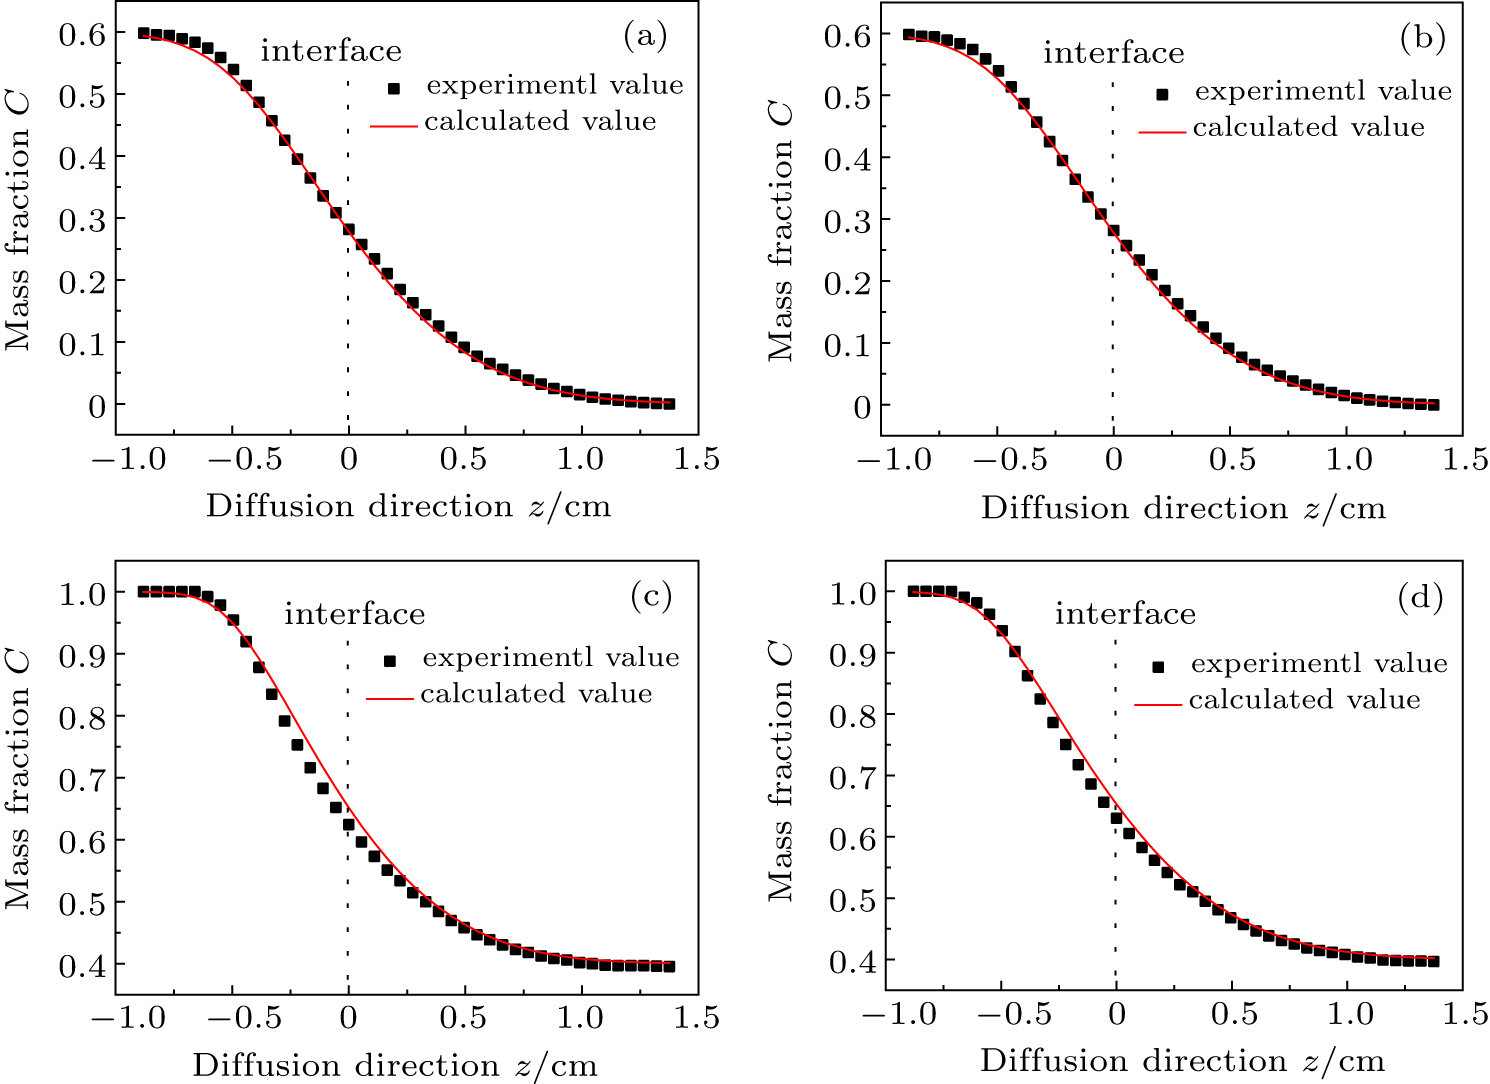
Spatial and temporal concentration profiles Ce(zj, t)s corresponding to Fig.

Measurement and verification of concentration-dependent diffusion coefficient: Ray tracing imagery of diffusion process |
Spatial and temporal concentration profiles Ce(zj, t)s corresponding to Fig. |
 |