Patterns of cross-correlation in time series: A case study of gait trails
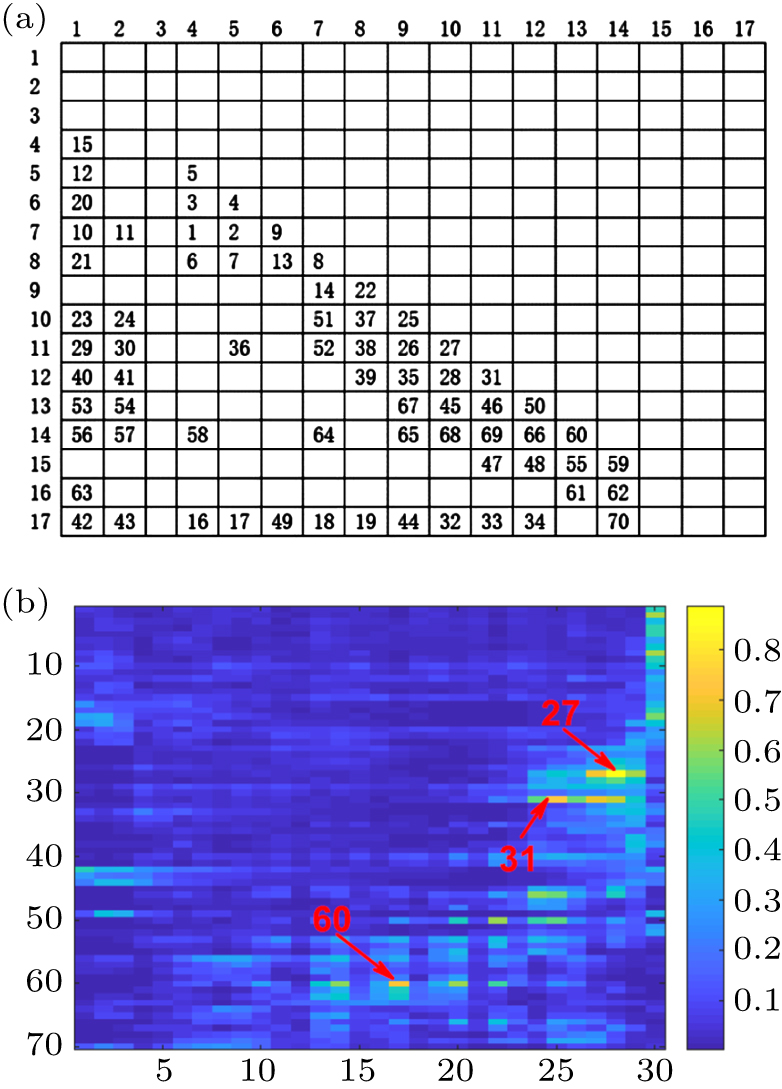
Evolution of the linkages. (a) Each pair of modes is labeled with a specific identification number from 1 to 70, as described in the text part. (b) The evolution of linkage’s weights is displayed with a heat map. The horizontal and vertical axes represent the mode network series