New measuring method of fiber alignment in precision torsion pendulum experiments
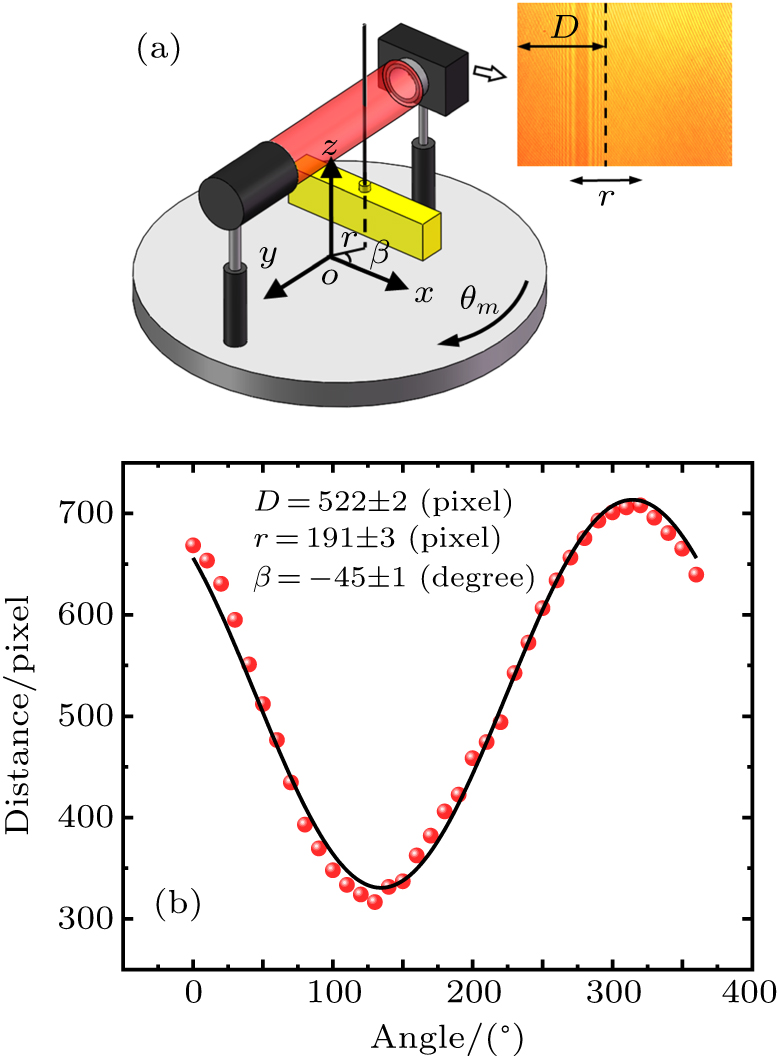
(a) Schematic diagram of the system. By means of 36 images, the deviation result can be calculated. (b) The circle dots represent the deviation in each image obtained by the CCD camera in different angle locations. A sinusoidal curve function is used to fitting the data well. One can get more images in each angle to make the fitting result more precisely, but it is not improved significantly.
