Quantum to classical transition induced by a classically small influence
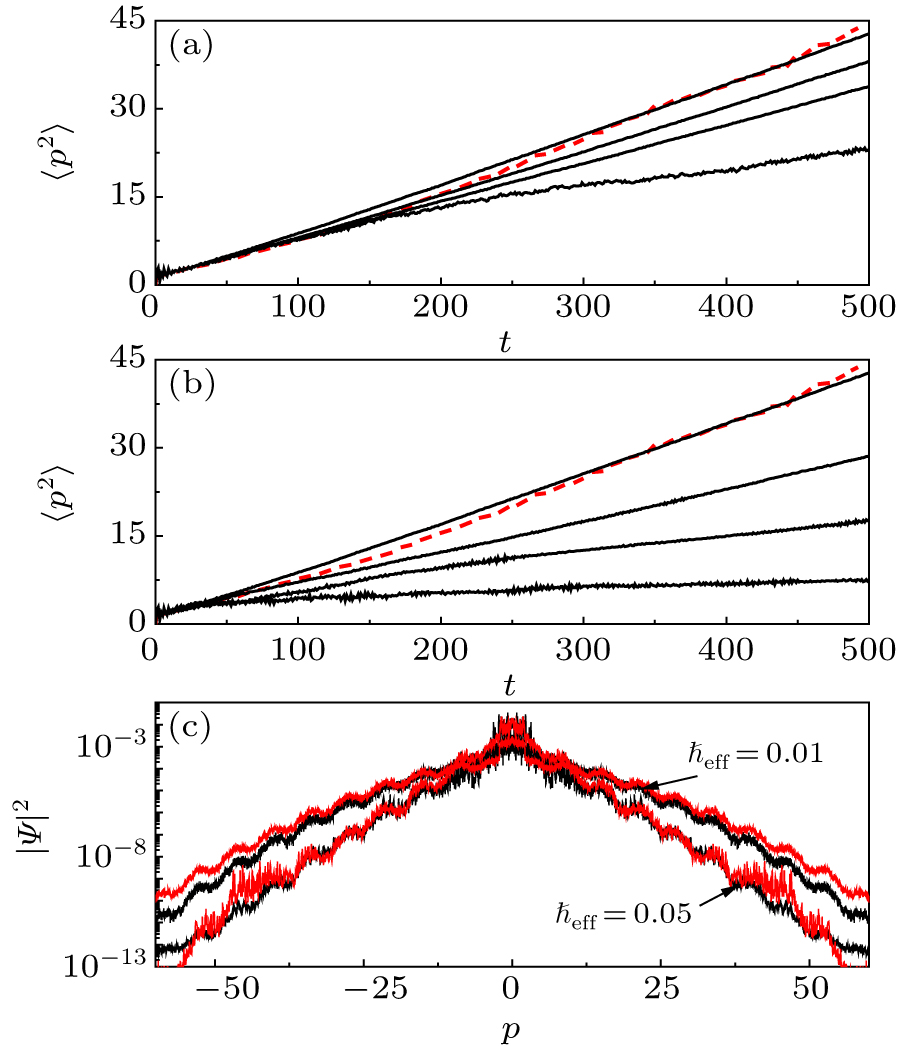
(a), (b) Time dependence of the mean energy. In (a), ℏeff = 0.01, from top to bottom solid lines correspond to
Quantum to classical transition induced by a classically small influence |
(a), (b) Time dependence of the mean energy. In (a), ℏeff = 0.01, from top to bottom solid lines correspond to |
| |