Quantum to classical transition induced by a classically small influence
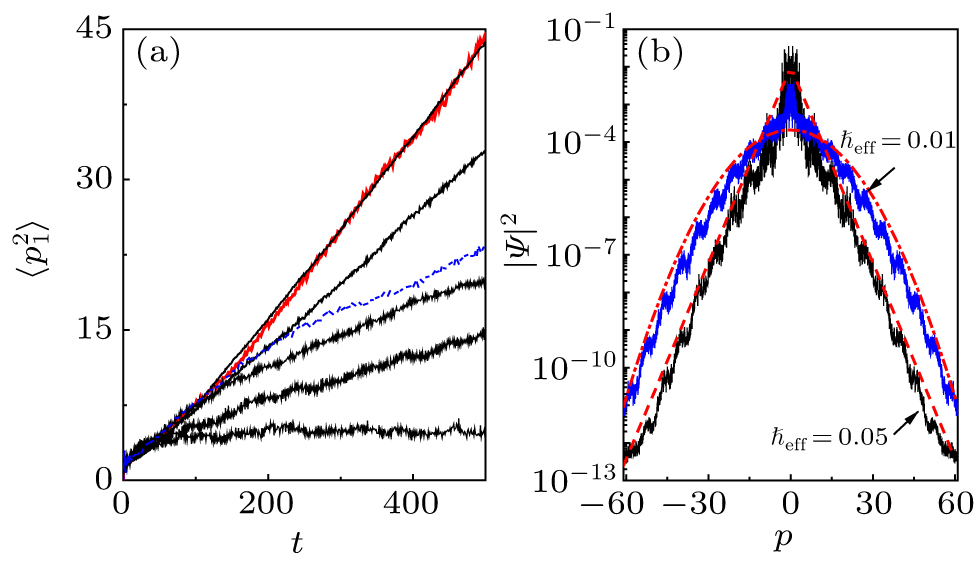
(a) Time dependence of the classical (red line) mean energy and quantum mean energy (black lines) of particle 1. From top to bottom, black solid lines correspond to ℏeff = 0.01, 0.02, 0.03, 0.04, and 0.05, respectively. The parameters are K1 = 1.8, K2 = 0, m = 0.001, ε = 2, λ = 10, and L = π. For comparison, the dashed line (in blue) denotes the quantum mean energy of the unperturbed case, i.e., ε = 0 with K = 1.8 and ℏeff = 0.01. (b) Momentum distribution at the time t = 500 with ℏeff = 0.01 (blue curve) and 0.05 (black curve). Dash-dotted line (in red) indicates the fitting function of the Gaussian form |ψ1(p)|2∝ e−p2/ζ. Dashed line (in red) denotes the exponential fitting |ψ1(p)|2∝ e−|p|/ξ.
