Modeling of microporosity formation and hydrogen concentration evolution during solidification of an Al–Si alloy
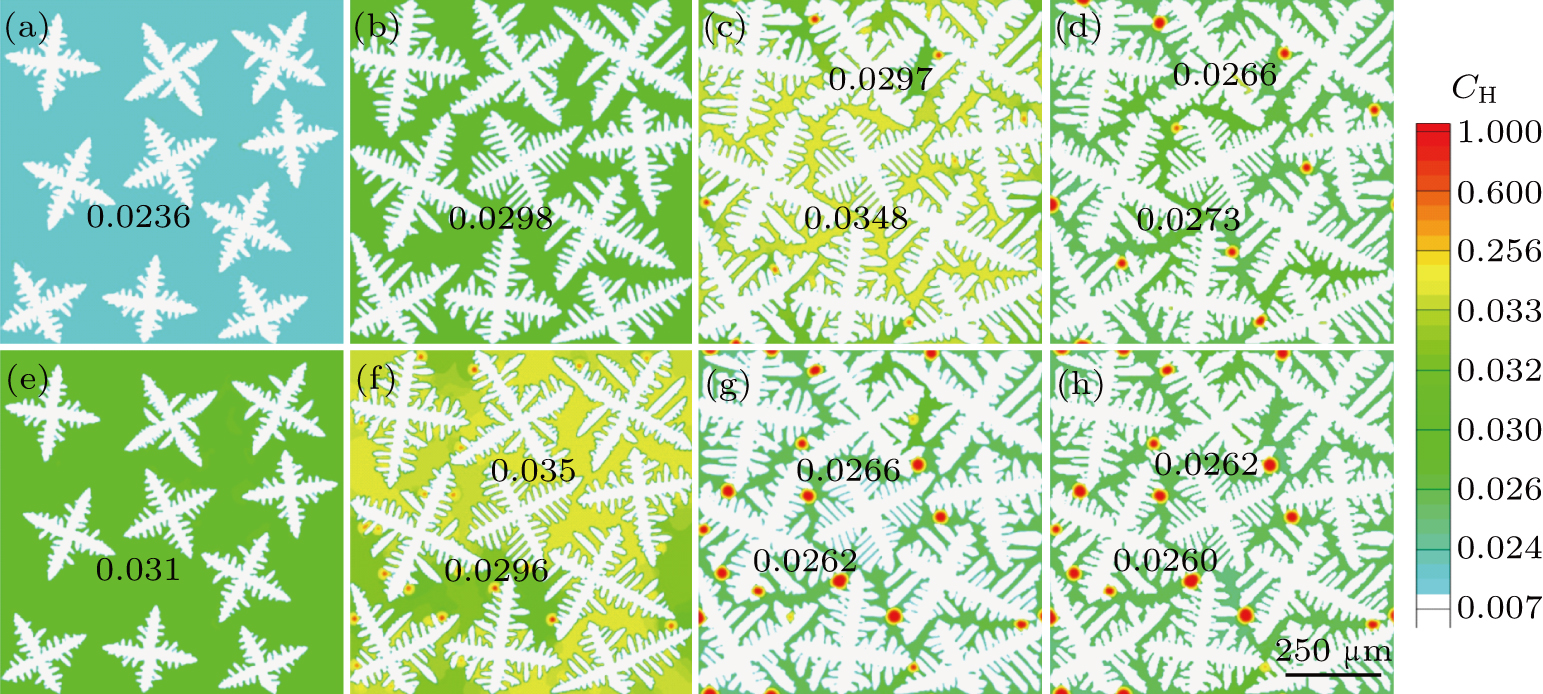
Simulated equiaxed dendrite growth and gas pore formation for an Al–(5 wt.%)Si alloy with different initial hydrogen concentrations (CH0): (a)–(d) CH0 = 0.02; (a) fg = 0%, fs = 0.21, T = 613.7 °C; (b) fg = 0%, fs = 0.43, T = 608.0 °C; (c) fg = 0.09%, fs = 0.65, T = 586.4 °C; (d) fg = 0.66%, fs = 0.68, T = 570.9 °C; (e)–(h) CH0 = 0.026; (e) fg = 0%, fs = 0.21, T = 613.7 °C; (f) fg = 0.11%, fs = 0.43, T = 608.0 °C; (g) fg = 1.86%, fs = 0.65, T = 586.4 °C; (h) fg = 1.91%, fs = 0.68, T = 570.9 °C. fg, fs, and T are the total porosity percentage, solid fraction, and temperature in the domain, respectively. The numbers in the panels indicate the local concentrations of hydrogen in the melt.
