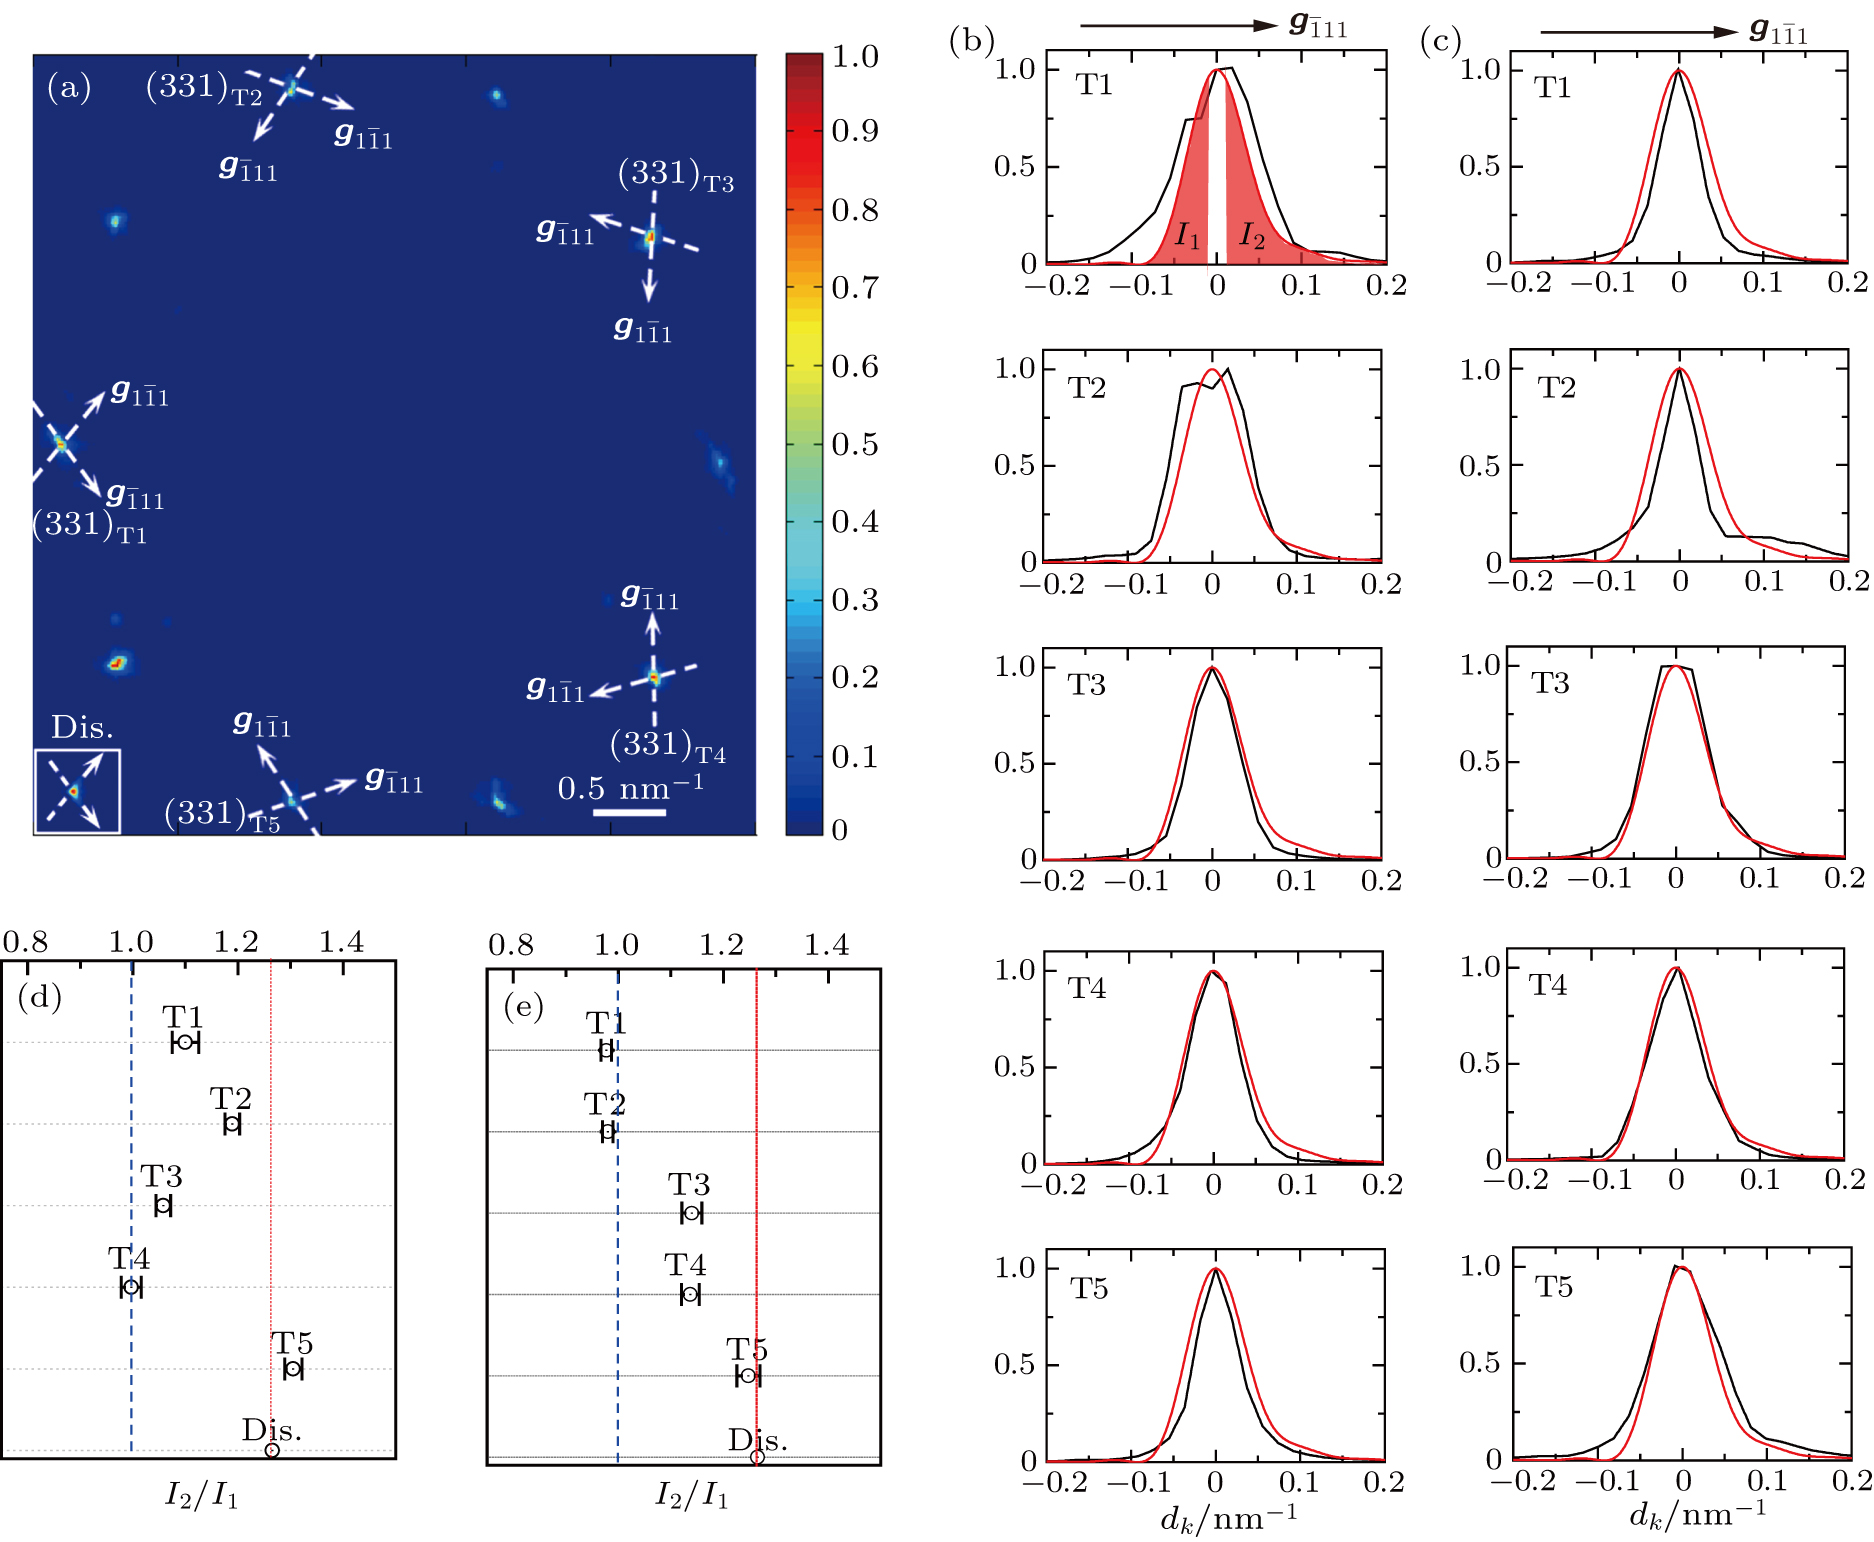
(a) The 2D intensity distribution of (331) and
(331¯)
reflections in the plane perpendicular to the twinning axis of the Ag FTNW (i.e., the Z axis as shown in Fig. 7(b)). The data are extracted from Fig. 7(b). In the left bottom corner, the kinematic electron diffraction simulation result of (331) reflection is demonstrated. The simulation is based on the pure star-disclination model (Dis.) of a Ag FTNW with diameter of 55 nm. The simulated (331) reflection is oriented as the experimentally reconstructed (331)T1 reflection. Panels (b) and (c) show the experimental intensity profiles (black curves) for the T1∼ T5 segments compared with the simulated result (red curves) of the pure star-disclination model (Dis.) along the direction of
g(1¯11)
and
g(11¯1)
reciprocal vector, respectively. The experimental line profiles shown in panels (b) and (c) are normalized for comparison with the kinematic simulation result of the pure star-disclination model (Dis.). Panels (d) and (e) illustrate the intensity ratios of I2/I1 for the
g(1¯11)
and
g(11¯1)
line-profiles shown in panels (b) and (c), respectively. |

