High-resolution angle-resolved photoemission study of oxygen adsorbed Fe/MgO(001)
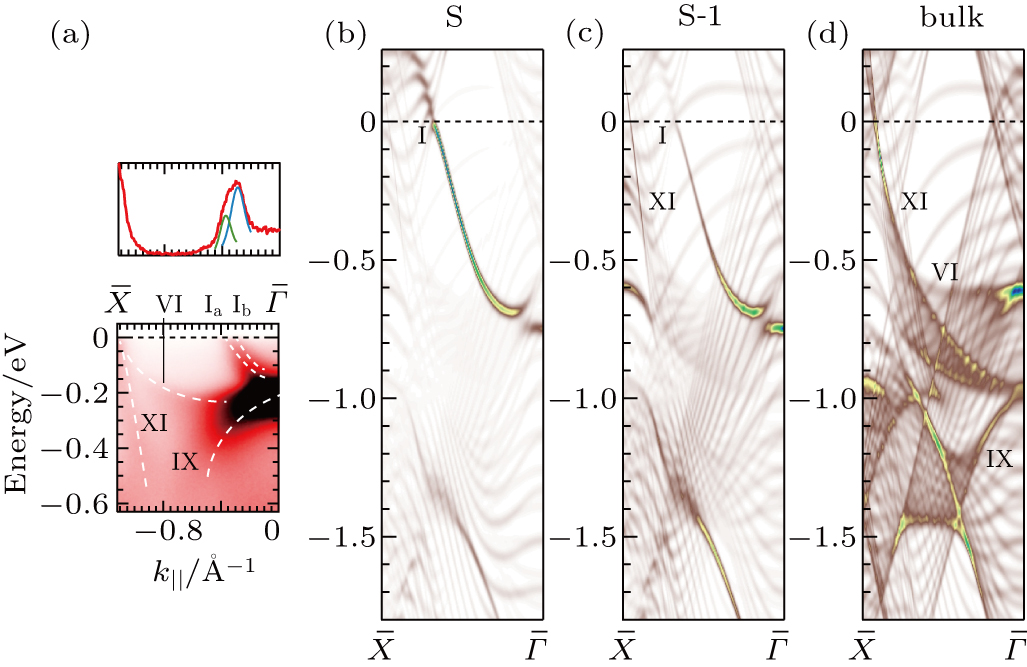
(a) The experimental ARPES image plot and MDC at EF of Fe(001)–p(1 × 1)-O along the

High-resolution angle-resolved photoemission study of oxygen adsorbed Fe/MgO(001) |
(a) The experimental ARPES image plot and MDC at EF of Fe(001)–p(1 × 1)-O along the |
 |