1. IntroductionThe layered perovskite ruthenate Sr2RuO4 has long been the focus of intense research because it is one of the rare candidates of topological superconductors. Early measurements of nuclear magnetic resonance (NMR)[1–4] and spin polarized neutron scattering[5] show an absence of drop in the spin susceptibility across Tc, providing identification of spin-triplet pairing in Sr2RuO4. μSR[6] and the polar Kerr effect[7] reveal that the time reversal (TR) symmetry is spontaneously broken below Tc, suggesting chiral p-wave triplet pairing. The d-vector of the triplet pairing is proposed as  ,[8,9] which is analogous to that in the superfluid 3He-A phase.[10] On the other hand, abundant of low-energy quasiparticle excitations are observed in specific heat,[11–13] superfluid density,[14] the spin-lattice relaxation rate,[15] thermal conductivity,[16–18] and ultrasound attenuation[19] deep in the superconducting (SC) state, indicating gap nodes on the Fermi surface (FS) (forming nodal lines along the direction perpendicular to the RuO2 plane). To explain the nodal-like behavior, a simple scenario is to assume symmetry protected d-wave pairing.
However, the scenario of d-wave pairing is inconsistent with the signatures of the chiral p-wave triplet. An alternative scenario is that the chiral p-wave gap function may have deep minima or accidental nodes.[20–27] Recently, functional renormalization group (FRG) study of Sr2RuO4 with spin–orbital coupling (SOC) finds that the pairing symmetry of Sr2RuO4 is chiral p-wave, but the atomic SOC induces near nodes for quasiparticle excitations, which explains the experimental puzzle between the d-wave-like feature observed in thermal experiments and the chiral p-wave triplet pairing revealed in NMR and Kerr effect.[28] But, very recently, in-plane 17O NMR measurements reveal a very substantial drop of the Knight shift below Tc,[29,30] and current-field inversion experiments using Josephson tunnel junctions indicate that the TR symmetry is preserved in Sr2RuO4.[31] Those phenomena are in sharp contradistinction to the early NMR and Kerr effect experiments. Therefore, extensive reassessment of the pairing symmetry of Sr2RuO4 has quickly materialized.
The scanning tunneling microscopy (STM) technique is a powerful method to determine the pairing symmetry of unconventional superconductors. The determination of the tunneling conductance map on a finite surface area leads, via Fourier transformation, to the quasiparticle interference (QPI) pattern that is caused by impurity scattering on the surface. This pattern contains information on the normal-state conduction band FS as well as on the pairing gaps of the SC state.[32–34] Early theoretical studies of QPI patterns of the SC state in Sr2RuO4 find clear QPI peaks evolving with energy for chiral p-wave pairing state based on the model without SOC.[35,36] However, angular-resolved photo-emission spectroscopy (ARPES) measurements[37–42] and FRG study[28] show that SOC plays an important role in the properties of the SC state in Sr2RuO4. Thus, we may need to reconsider the QPI patterns of Sr2RuO4 with the effect of SOC.
In this paper, we therefore investigate the expected QPI structure of Sr2RuO4 with SOC and two possible pairing modes, chiral p-wave pairing and equal d-wave pairing proposed by FRG calculations[28] and thermal conductivity experiments,[18] respectively, to propose an experimental method to test them. We find that the QPI spectra have clearly peaks evolving with energy for both of the two pairing modes. But there are five main peaks for chiral p-wave pairing and six main peaks for equal d-wave pairing, and the location and evolution of those peaks with energy are different between the two pairing modes. These features, if compared to experimental determination of QPI, may be used to further quantify the pairing symmetry of Sr2RuO4.
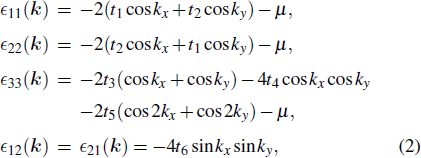
2. Model and methodWe start with the three-orbital model with the effect of SOC proposed in Ref. [41]. The normal state part of the Hamiltonian can be written as

Here,
ψk = (
ck 1 ↑,
ck 2 ↑,
ck 3 ↑,
ck 1↓,
ck 2 ↓,
ck 3↓)
T is the fermion spinor, with
ckas annihilating an electron of momentum
k and spin
s ∈ (↑,↓) on orbital
a ∈ (1,2,3) ↔ (d
xz,d
yz, d
xy). The nonzero elements of the spin-invariant part
ϵk are (in the orbital basis)

where
μ is the chemical potential. The parameter
λ in
hk is the SOC,
L = (
Lx,
Ly,
Lz) is the orbital angular momentum operator, with

and
σ/2 is the spin angular momentum. The parameters that best fit the ARPES experiment of Sr
2RuO
4 are (
t1,
t2,
t3,
t4,
t5,
t6,
λ,
μ) = (0.145,0.016,0.081,0.039,0.005,0.000,0.032,0.122) eV.
[41] TR and inversion symmetries dictate Kramers degeneracy in the eigenstates of
hk, which in our case can be written in the form

where
n ∈ (
α,
β,
γ) labels the band,
ν = ± the pseudo-spin, and
T = i
σy K is the TR operator. Notice spin SU(2) is violated by SOC, so singlet and triplet pairings can mix.
The total Hamiltonian for the SC state can be written as

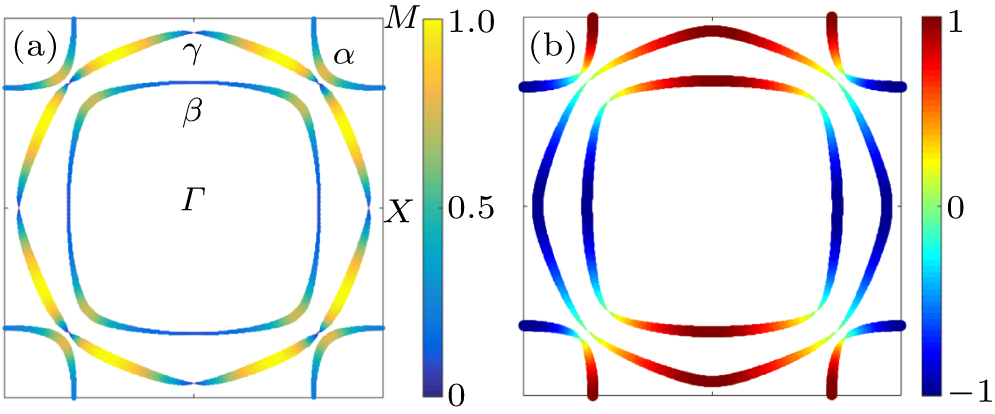
For the chiral p-wave pairing proposed in Ref. [
28], we have

where
σ are the Pauli matrices acting on the spin bases. Each
pi-complex transforms as
px/y in
Px/y under combined symmetry operations on (spin, orbital, lattice). The
σ0-part is the spin singlet and the
σx/y/z-parts are triplets. The relative ratio between the coefficients
p1,…,6 is given by

To clear see the gap structure on the Fermi surface, we project the pairing matrix onto the normal state band basis as, with pseudo-spin
ν = ± and band label
n ∈ (
α,
β,
γ),

we have applied |−
knν⟩ =
T|
knν⟩ in the second line. We find that in our case

,

, and the inter-band part

. (The inter-band pairing is unimportant since
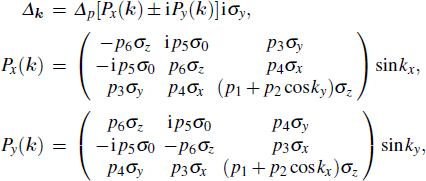
Tc is low and the three bands are nondegenerate at the same momentum.) Figure
1(a) shows the resulting gap structure |
Δn(
k)| (normalized by the maximum gap
Δ0 on the
γ pocket) on the FS, we can clear see two sets of near nodes along
Γ–
X and
Γ–
M directions on the
γ pocket, and one set of gap minimum along
M–
X (
Γ–
X) direction on the
α (
β) pocket.
For equal d-wave pairing suggested by Ref. [18], the pairing matrix in the band basis with pseudo-spin is given by

with the relative ratio of
Δdn as (
Δdα :
Δdβ:
Δdγ) = (1.67:0.671:0.5068) to make sure the maximum gap
Δ0 on each band be equal. Figure
1(b) shows the corresponding

(normalized by
Δ0) on the Fermi surface. In both models, we set the maximum gap
Δ0 = 0.004 eV.
When a single impurity is located at the origin, the impurity Hamiltonian can be written as

with
N being the system size (512 × 512 throughout the paper). We consider the nonmagnetic impurity only, diagonal in the orbital basis and with a scattering strength
Vs = 4
Δ0 for definiteness. Following the standard
T-matrix procedure,
[32] the Green’s function matrix is defined as

and

Here
g0(
k,
ω) is the Green’s function in the absence of the impurity

where
I is a 12 × 12 unit matrix and

The experimentally measured LDOS is expressed as

and its Fourier transform is defined as
ρ(
q,
ω) = ∑
r ρ(
r,
ω)e
iq · r, which can be expressed as

3. ResultsFor the chiral p-wave pairing, we plot |ρ(q,ω)| in Fig. 2, and five main scattering wave vectors q1,2,3,4,5 can be identified [see the arrows in Figs. 2(a) and 2(g)]. The wave vector q1 is along qx/y = 0 directions, q2,3 are along qx = ± qy directions, while the directions of q4,5 are dependent on the bias ω. With the increase of |ω|, q1 moves away from the origin, q2,3 move towards the origin, q4 moves towards the origin with the orientation close to qx = ± qy directions, while q5 moves towards (π, 0)/(0,π).
The ω dependence of q can be understood from the evolution of the constant-energy contour (CEC).[32–35] In the normal state, the CEC of the three bands shows little variation when |ω| ≤ Δ0 since Δ0 ≪ W, where W is the band width, thus in this energy range |ρ(q, ω)| scarcely evolves with ω. On the contrary, in the SC state, the superconductivity gaps the entire FS with strong anisotropy and leads to complicated structure of deep minima on all of the three Fermi pockets as shown in Fig. 1(a). From Fig. 3 we can find that, around each gap minima, the CEC evolves from a single point at the gap minima to a banana-shaped closed contour at higher energies and the size of the banana increases with |ω| until its tips trace the normal state FS. By carefully examine the locations of these banana tips, we conclude that the scattering wave vectors q1,2,3,4,5 in Fig. 2 should correspond to the wave vectors connecting the banana tips (see the solid arrows in Fig. 3(a)). For example, in Fig. 2(b), at ω/Δ0 = 0.4, q1/π ∼ (± 0.24,0)/(0, ± 0.24), q3/π ∼(± 0.96, ± 0.96), q4/π ∼ (± 0.71, ± 0.26)/(± 0.26, ± 0.71), and q5/π ∼ (± 0.95, ± 0.26)/(± 0.26, ± 0.95). At the same ω, the related {CEC} tips on γ and α pockets in Fig. 3(a) are located at (± 0.91, ± 0.12)π/(± 0.12, ± 0.91)π and (± 0.83, ± 0.64)π/(± 0.64, ± 0.83)π, respectively. The derived q1,3,4,5/π are (± 0.24, 0)/(0, ± 0.24), (± 1.03, ± 1.03), (± 0.71, ± 0.27)/(± 0.27, ± 0.71), and (± 0.95, ± 0.27)/(± 0.27, ± 0.95), respectively, which agree fairly well with those in Fig. 2(b). Notice that q3 in Fig. 2(b) is located at (± 0.96, ± 0.96)π and that derived from Fig. 3(a) is at (± 1.03, ± 1.03)π, they differ by a reciprocal lattice constant, suggesting that q3 is an umklapp process. As ω/Δ0 changes from 0.3 to 0.8, the sizes of all bananas increase, thus from Fig. 3(a), q1 should move away from origin, q3 should move toward origin (since it is umklapp process), q4 should be close to origin, and q5 should be close to (π,0)/(0,π). As we can see from Figs. 2(a)–2(f), the evolution of q1,3,4,5 indeed follows this trend. On the other hand, at ω/Δ0 = −0.4, q2 in Fig. 2(h) is located at (± 0.79, ± 0.79)π and that derived from Fig. 3(a) is also at (± 0.79, ± 0.79)π, as |ω| increases, |q2| should decrease, as shown in Figs. 2(g)–2(i). We also find that the spectra are asymmetrical with respect to positive and negative ω. Furthermore, q2 and q3,4,5 are invisible for positive and negative ω, respectively.
In addition, apart from the above mentioned q1,2,3,4,5, naively we would expect more QPI wave vectors connecting other tips of the CEC. For example, from Fig. 3(b), we can see that there should exist QPI wave vectors like q6,7,8,9,10 and others (not shown). However, in Fig. 2 we cannot clearly find such wave vectors evolving with energy. In order to verify this, we repeated the above calculations for Vs = 8Δ0 and the results remain qualitatively the same. The reason may be that the intensity of the scattering wave vectors is determined not only by the SC coherence factors,[33] but also by the matrix elements effect of the unitary transformation between the orbital and band bases. In Sr2RuO4, all the three bands are coupled by SOC, it is very likely that the matrix elements associated with the above mentioned processes q6,7,8,9,10 are vanishingly small, thus those QPI wave vectors cannot be detected experimentally.
For the equal d-wave pairing, different from chiral p-wave pairing discussed above, six main scattering wave vectors  can be identified [see the arrows in Figs. 4(a) and 4(g)]. The wave vectors
  are along qx = ± qy directions,
  is along qx/y = 0 directions, while the direction of
  is dependent on the bias ω.
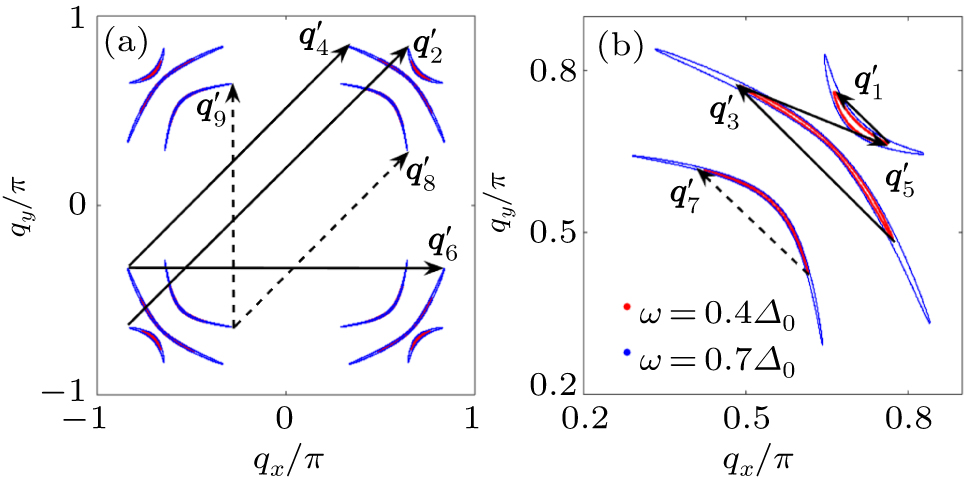
As in the chiral p-wave case discussed above, the ω dependence of q can also be understood from the evolution of the CEC. Figure 5 shows the CEC of equal d-wave pairing at ω = 0.4 Δ0 and 0.7 Δ0. By carefully examining the locations of the tip, we can also conclude that the scattering vectors  in Fig. 4 should correspond to the wave vectors connecting the tips. For example, in Fig. 4(b), at ω = 0.4 Δ0,
  ,
,  ,
,  ,
,  , and
, and  . At the same ω, the related CEC tips on α and γ pockets in Fig. 5 are located at (± 0.76, ± 0.66)π/(± 0.66, ± 0.76)/π and (± 0.77, ± 0.49)π/(± 0.49, ± 0.77)π, respectively. The derived
  are (± 0.10, ± 0.10), (± 1.42, ± 1.42), (± 0.28, ± 0.28), (± 0.11, ± 0.27)/(± 0.27, ± 0.11), and (± 1.54, 0)/(0, ± 1.54), respectively. Agree well with those in Fig. 4(b) with
  being umklapp processes. As ω/Δ0 changes from 0.3 to 0.8, the sizes of all bananas increase, thus from Fig. 5,
  should move away from origin, while
  should move toward origin (since they are umklapp processes). This trend is clearly shown in Figs. 4(a)–4(f). On the other hand, at ω = −0.4Δ0,
  in Fig. 4(h) is located at (± 0.74, ± 0.74)π and that derived from Fig. 5(a) is at (± 1.26, ± 1.26)π, suggesting that
  is an umklapp process, as |ω| increases,
  should increase, as shown in Figs. 4(g)–4(l). As in the chiral p-wave pairing, the spectra of d-wave pairing are also asymmetric with respect to positive and negative ω, and some expect QPI wave vectors connecting other tips are unclear, such as
  shown by the dashed arrows in Figs. 5(a) and 5(b).
In Table. 1, the main difference between the chiral p-wave pairing and equal d-wave pairing is summarized.
Table 1.
Table 1.
 Table 1. The main difference of the quasiparticle interference patterns between the chiral p-wave pairing and equal d-wave pairing. Notice that each peak includes its symmetric images. .
| Pairing symmetry |
Chiral p-wave |
Equal d-wave |
| Number of peaks |
5 |
6 |
| Location of each peak at ω = 0.4|Δ0| and its evolution with the increase of the bias |ω|. (in units of π) |
(0.24,0) → (1,0) |
(0.10,0.10) → (1,1) |
| (0.79,0.79) → (0,0) |
(0.58,0.58) → (0,0) |
| (0.96,0.96) → (0,0) |
(0.30,0.30) → (1,1) |
| (0.71,0.26) → (0,0) |
(0.74,0.74) → (1,1) |
| (0.95,0.26) → (1,0) |
(0.28,0.11) → (1,0.3) |
|
(0.44,0) → (0,0) |
| Table 1. The main difference of the quasiparticle interference patterns between the chiral p-wave pairing and equal d-wave pairing. Notice that each peak includes its symmetric images. . |
4. SummaryWe have studied the QPI in Sr2RuO4 with SOC based on two pairing modes in order to propose an experimental method to test them. Both of the QPI spectra for chiral p-wave pairing and equal d-wave pairing have clear peaks evolving with energy, and their locations can be determined from the tips of the CEC. But the spectra for the two pairing modes are different: (i) for chiral p-wave pairing, there are five main scattering wave vectors, while six main scattering wave vectors can be seen for equal d-wave pairing. (ii) the location and the evolution of those peaks with bias ω are different between the two pairing modes. The main difference between them is summarized in Table. 1. Since the QPI spectrum can be directly measured by STM, the differences of the QPI spectrum between the two pairing modes can used to judge the pairing symmetry for Sr2RuO4 and resolve whether Sr2RuO4 is a chiral p-wave or d-wave superconductor. In addition, for both models, we repeated the above calculations for Vs = 8 Δ0 and the results remain qualitatively the same, indicating the robustness of the QPI spectra presented in this paper.


