Significant role of nanoscale Bi-rich phase in optimizing thermoelectric performance of Mg3Sb2
Wang Yang1, Zhang Xin1, †, Liu Yan-Qin1, Zhang Jiu-Xing2, Yue Ming1
Key Laboratory of Advanced Functional Materials, Ministry of Education, College of Materials Science and Engineering, Beijing University of Technology, Beijing 100124, China
School of Materials Science and Engineering, Hefei University of Technology, Hefei 230009, China


† Corresponding author. E-mail: zhxin@bjut.edu.cn

Project supported by the National Natural Science Foundation of China (Grant Nos. 51371010, 51572066, and 50801002), the Beijing Municipal Natural Science Foundation, China (Grant No. 2112007), the Fundamental Research Funds for the Central Universities (Grant No. PXM2019-014204-500032), and the Science Fund from the Advanced Space Propulsion Laboratory of BICE and Beijing Engineering Research Center of Efficient and Green Aerospace Propulsion Technology, China (Grant No. LabASP-2018-09).

Abstract

Mg3Sb1.5Bi0.5-based alloys have received much attention, and current reports on this system mainly focus on the modulation of doping. However, there lacks the explanation for the choice of Mg3Sb1.5Bi0.5 as matrix. Here in this work, the thermoelectric properties of Mg3Sb2−xBix (0.4 ≤ x ≤ 0.55) compounds are systematically investigated by using the first principles calculation combined with experiment. The calculated results show that the band gap decreases after Bi has been substituted for Sb site, which makes the thermal activation easier. The maximum figure of merit (ZT) is 0.27 at 773 K, which is attributed to the ultra-low thermal conductivity 0.53 W·m−1·K−1 for x = 0.5. The large mass difference between Bi and Sb atoms, the lattice distortion induced by substituting Bi for Sb, and the nanoscale Bi-rich particles distributed on the matrix are responsible for the reduction of thermal conductivity. The introduction of Bi into Mg3Sb2-based materials plays a vital role in regulating the transport performance of thermoelectric materials.

PACS: ;72.20.Pa;;73.50.Lw;
1. Introduction

Thermoelectric devices have received much attention due to the fact that the solid-state conversion process has no mechanical transmission parts, quiet, and friendly to environment.[15] Thermoelectric conversion efficiency is the decisive factor to expand the application of thermoelectric technology. The conversion efficiency is critically related to the dimensionless figure of merit, ZT = α2T/(ρκ), where α is the Seebeck coefficient, T is the absolute temperature, ρ is the electrical resistivity, and κ is the thermal conductivity of the thermoelectric materials.[6] Satisfactory ZT will be achieved with low thermal conductivity and favorable electrical transport properties, which can be realized in the so-called phonon–glass–electron–crystal (PGEC) materials. Zintl phase compounds are ideal candidates for the thermoelectric materials due to their complex structure conforming to PGEC concept.[714]

The Mg3Sb2-based thermoelectric materials are typical zintl compounds, which consist of nontoxic, earth abundant, and inexpensive elements and have received much attention.[1519] Strategies for enhancing ZT mainly focus on two directions: increase the power factor (PF = α2/ρ), and reduce the lattice thermal conductivity. Band engineering approaches, such as carrier filtering effect and modulation doping, are employed to optimize the power factor.[2022] Phonon scattering mechanisms, including defect engineering and nanostructuring, are employed to reduce the lattice thermal conductivity.[23,24] Among the reported Mg3Sb2-based thermoelectric materials, single p-type doping, such as Li,[25] Na,[26] Ag[27] in Mg site, and Pb,[28] Bi[29] in Sb site, can enhance the electrical performances through increasing the carrier concentration. The highest power factor 7.5 μW·cm−1·K−1 was obtained in Na-doped Mg3Sb2 alloys.[26] Compared with p-type Mg3Sb2-based materials, n-type doping is very efficient to enhance the thermoelectric performance, especially in Mg3Sb1.5Bi0.5-based compounds. Shi et al.[30] and Imasato et al.[31] have investigated La doping in Mg site, and Se,[19] Te[16] doping in Sb site to optimize the thermoelectric performances of Mg3Sb1.5Bi0.5-based materials. Among them, Te-doped Mg3Sb1.5Bi0.5 owns the highest ZT of 1.65 at 725 K.[16] However, the role of Bi in Mg3Sb2−xBix (0.4 ≤ x ≤ 0.55) still lacks systematic investigation.

Here in this work, the effects of Bi on electrical and thermal transport performance in Mg3Sb2−xBix (0.4 ≤ x ≤ 0.55) compounds are studied by combining the theoretical study with experimental research. The electronic structures of pure and Bi-doped Mg3Sb2 are calculated based on the density functional theory (DFT). Bulk Mg3Sb2−xBix (0.4 ≤ x ≤ 0.55) samples are synthesized by combining the suspension induction melting method with spark plasma sintering (SPS) method. The phase, microstructure, and thermoelectric properties of the samples are analyzed.

2. Theory and experiment

Density function theory (DFT) calculations of pure and Bi-doped Mg3Sb2 were carried out on the Cambridge Serial Total Energy Package (CASTEP). The band structures of undoped and Bi-doped Mg3Sb2 were calculated in a 2 × 2 × 1 supercell by the generalized-gradient approximation of Perdew–Burke–Ernzerhof (GGA-PBE) functional for comparison. The plane-wave cut off energy was set to be 700 eV, and the Brillouin zone k-point mesh density was 4 × 4 × 4. All samples were synthesized by combining the suspension induction melting method with spark plasma sintering (SPS) method. Magnesium grains (99.9 wt%, Alfa Aesar), antimony chunks (99.99 wt%, Alfa Aesar), and bismuth pieces (99.999 wt%, Alfa Aesar) were weighed according to the nominal compositions of Mg3Sb2−xBix (x = 0.4, 0.45, 0.5, 0.55), which will sustained suspension induction melting three times. The graphite die loaded with powder, obtained from crushing the melted ingot, was sintered by SPS at 953 K under a pressure of 50 MPa for 10 min.

The x-ray diffraction (XRD) analysis of the sintered Mg3Sb2−xBix (0.4 ≤ x ≤ 0.55) samples was performed on DMAX-IIIB equipped with Cu anode target ( ray, λ = 1.5418 Å). The microstructure of fresh fractured surface with x = 0.5 was observed on filed-emission scanning electron microscopy (SEM, FEI NANO200). The transmission electron microscopy (TEM, Tecnai F30) and high angle annular dark field scanning transmission electron microscope (HAADF-STEM) were employed to investigate the detailed microstructure features. The actual compositions of Mg3Sb2−xBix (0.4 ≤ x ≤ 0.55) samples were confirmed by x-ray fluorescence spectrometer (XRF, XRF-1800). Carrier concentration and mobility were measured on a physical property measurement system (PPMS, Accent HL5500 Hall System) at room temperature. The measurement of electrical resistivity (ρ) and Seebeck coefficient (α) were carried out in a helium atmosphere (ULVAC ZEM-2). Thermal conductivity (κ = λ Cpd) was calculated by using the measured thermal diffusivity (λ) and specific heat (Cp) by laser thermal conductivity detector (ULVACTC-7000), density (d) by Archimedes method.

3. Results and discussion
3.1. Electronic structure

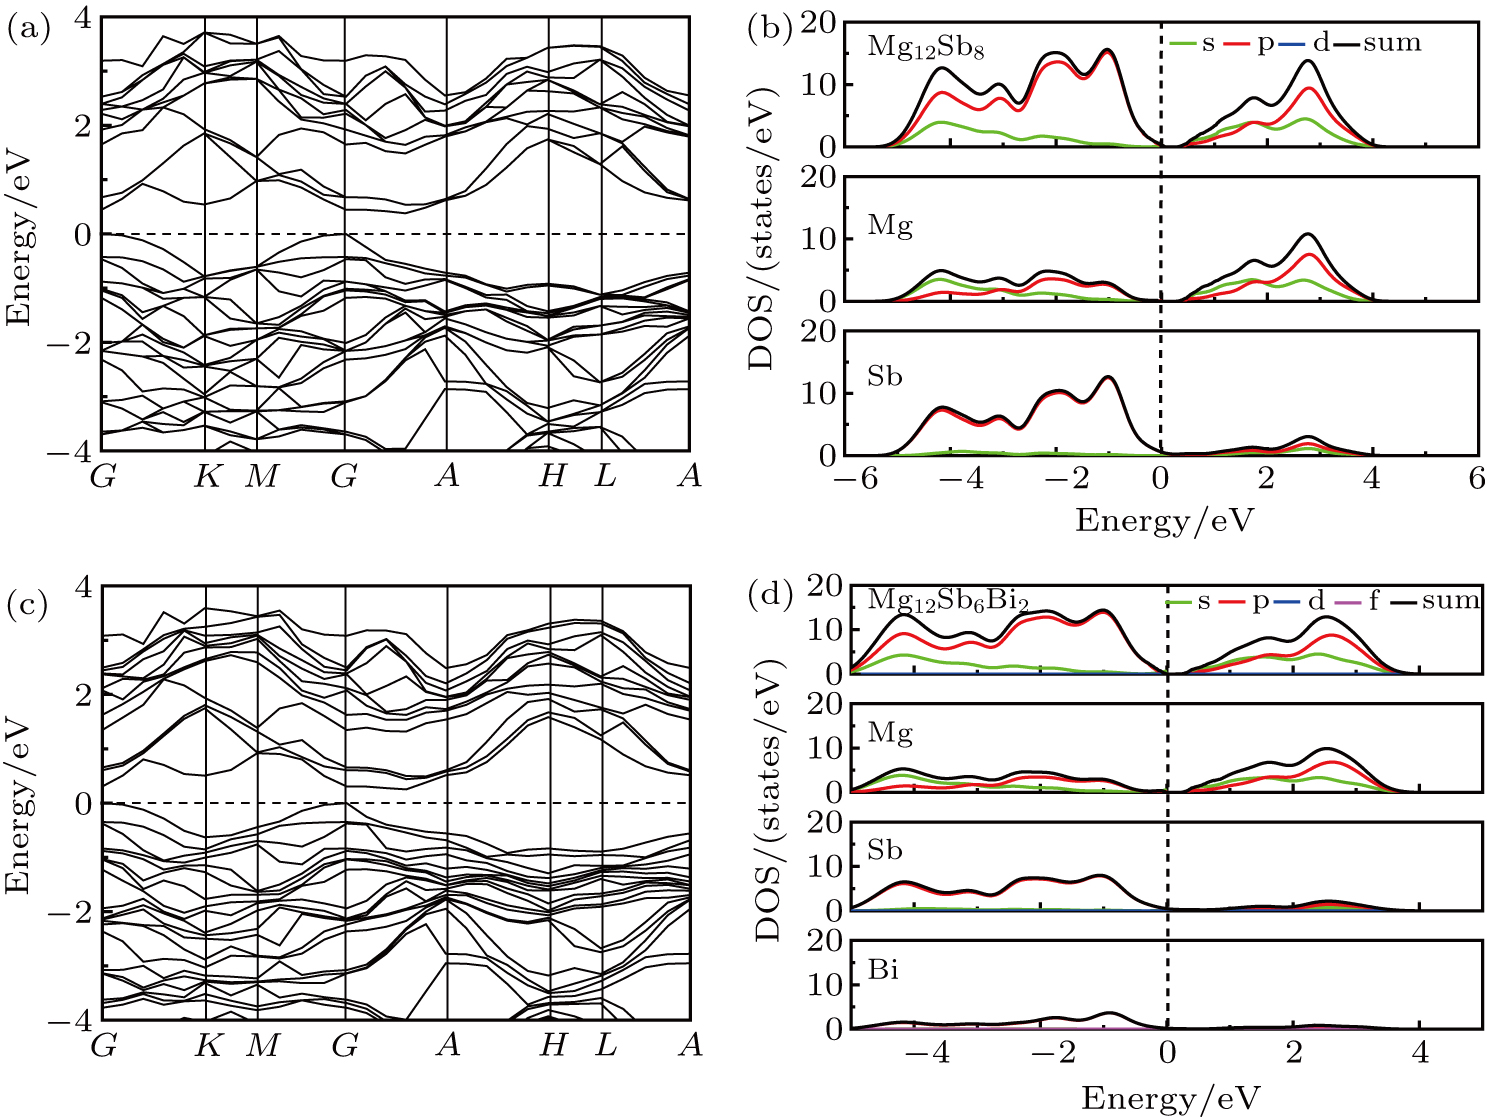
The calculated electronic band structure and density of states (DOS) of Mg12Sb8 and Mg12Sb6Bi2 are shown in Fig. 1. There is no obvious difference in the shape of energy band between the undoped and doped compound shown in Figs. 1(a) and 1(c). Moreover, the doped sample still presents a p-type conductivity mechanism. The reduced band gap inducing by Bi alloying makes it easier for electrons to tranform their thermal excitation from valence band to conduction band, which will increase the carrier concentration. Compared with those of Mg12Sb8 displayed in Fig. 1(b), the corresponding total and partial DOS of Bi-p state electrons in Mg12Sb6Bi2 (see Fig. 1(d)) contribute to the valence band, which is also beneficial to the improvement of carrier concentration. According to the calculated results, the introduction of Bi has a positive influence on electrical transport performance.

Fig. 1. Calculated electronic structures of Mg3Sb2-based alloys, showing (a) band structure and (b) DOS of Mg12Sb8; (c) band structure and (d) DOS of Mg12Sb6Bi2.
3.2. X-ray diffraction structure

The XRD patterns of Mg3Sb2−xBix (0.4 ≤ x ≤ 0.55) samples with α-La2O3 (space group P-3m1, No. 164) are shown in Fig. 2(a). The main indexed peaks match well with the structure of Mg3Sb2 (PDF#03-0735) and there is no detectable second phase or other impurities within the detection accuracy of XRD. Compared with the positions of main peaks of different compositions, the position of the diffraction peak shifts leftwards with Bi doping concentration increasing. Figure 2(b) displays the trend of lattice parameter with the change of Bi concentration. Since the covalent radius of Bi is larger than that of Sb, the parameters a and c show the increasing trend with Bi concentration rising, which is in agreement with the leftward shift of the XRD diffraction peak position. Because of the large doping amount of Bi, the increase of lattice constants is obvious, demonstrating that the Bi occupies the lattice position and forms a series of solid solutions, which is beneficial to the electrical transport properties and the lattice thermal conductivity.

Fig. 2. (a) The x-ray diffraction patterns of Mg3Sb2−xBix (0.4 ≤ x ≤ 0.55), with (hkl) indices of diffraction peaks being marked at the bottom of the PDF card, and (b) lattice parameter varying with Bi concentrations.
3.3. Scanning microscopy

The SEM image of the fracture parallel to the pressing direction of Mg3Sb1.5Bi0.5 sample is shown in Fig. 3(a), confirming that the samples prepared by combining the suspension induction melting method with SPS method own high densities and no obvious holes. The detailed microstructures of the Mg3Sb1.5Bi0.5 sample are further investigated by the TEM. As shown in Fig. 3(b), the low-magnification TEM image clearly presents a number of nanoscaled precipitates segregating on the matrix. The high-angle annular dark-field (HADDF) image of the same region is shown in Fig. 3(c). The element composition of the matrix and white region precipitates are detected by TEM-EDS and the results are displayed in Figs. 3(d) and 3(e), respectively. The analysis results indicate that for Bi-doped Mg3Sb2 alloys, part of Bi atoms enter into the lattice positions to form solid solution, while the remaining Bi atoms are distributed on the matrix in the form of Bi-rich participates. The nanoscaled particles introducing a high density of grain boundaries can effectively enhance the middle wavelength phonon scattering, which is beneficial for reducing the lattice thermal conductivity.

Fig. 3. SEM and TEM analyses of the Mg3Sb1.5Bi0.5 sample:, displaying (a) SEM image for typical fracture morphology, (b) low-magnification TEM image, (c) corresponding HADDF-STEM image, (d) EDS spectrum with the elemental composition analysis of the matrix, and (e) EDS spectrum with the elemental composition analysis of the white region.
3.4. Electrical transport properties

To identify the doping efficiency of Bi in Mg3Sb2, the physical parameters of Mg3Sb2−xBix (0.4 ≤ x ≤ 0.55) alloys are measured on PPMS at room temperature and the results are listed in Table 1. It can be seen that the carrier concentrations of the Mg3Sb2−xBix (0.4 ≤ x ≤ 0.55) samples show little variation from 1.57 × 1019 cm−3 to 2.65 × 1019 cm−3, lower than those of the Li-doped and Na-doped samples, which is caused by substituting Bi for isoelectronic Sb.[25,26] The carrier mobility displays a decreasing trend with Bi concentration increasing, which is due to the enhanced scattering of the carrier by the distributed nanoscaled precipitates on the matrix. The increased density of grain boundaries strengthens the barrier effect on the carrier shifting, resulting in the decrease of the carrier mobility. The temperature-dependent resistivity values of Mg3Sb2−xBix (0.4 ≤ x ≤ 0.55) alloys are shown in Fig. 4(a). The resistivity curves of Bi-doped samples show characteristics in three regions: first slowly decreasing trend until 475 K, then a relatively fast drop with the enhancing of the thermal excitation of the carrier, finally, the decrease of the resistivity slows down because the concentration of thermally excited carriers tends to be saturated. In addition to the temperature, the resistivity follows a slightly decreasing trend with the increasing of the Bi content, which is most likely caused by the nanoscaled Bi-rich particles distributed on the matrix acting as additional carrier reservoirs. The carrier concentrations of the p-type Mg3Sb2-based materials are limited due to the existence of the opposite type carrier donors, so the further modulating of the doping is needed to optimize the electrical performance of the p-type Mg3Sb2−xBix-based materials.

Fig. 4. The temperature-dependent electronic transport properties of the Mg3Sb2−xBix (0.4 ≤ x ≤ 0.55) samples, showing (a) electrical resistivity ρ(T), (b) Seebeck coefficient α(T), and (c) power factor α2/ρ(T).
Table 1.

Room-temperature Hall measurement data and XRF composition of Mg3Sb2−xBix (0.4 ≤ x ≤ 0.55) samples.

.

Figure 4(b) displays the temperature-dependent Seebeck coefficients of the Bi-doped samples. The variation trends of Seebeck coefficients of Mg3Sb2−xBix (0.4 ≤ x ≤ 0.55) compounds are similar to those of resistivity values. The positive values of Seebeck coefficients indicate that the conduction mechanisms of all samples are still of p-type semiconductor. The variation of the Seebeck values of Bi-doped samples is in a small range of 300 μV·K−1–360 μV·K−1, and the values are higher than those of other n-type and p-type doping Mg3Sb2 material. Due to the slight increasing of electrical conductivity and the little variation of Seebeck coefficient, the power factors of Mg3Sb2−xBix (0.4 ≤ x ≤ 0.55) samples are improved over the measured temperature region as shown in Fig. 4(c). Compared with the optimized composition reported previously, the improvement of electrical transport performance of Bi doping sample is limited by the electrical conductivity which is determined by carrier concentration and mobility. Consequently, the electrical transport properties of Mg3Sb1.5Bi0.5-based materials are further tuned through n-type doping, such as group-3[30,31] and chalcogen[16,19] doping.

3.5. Thermal transport properties and ZT

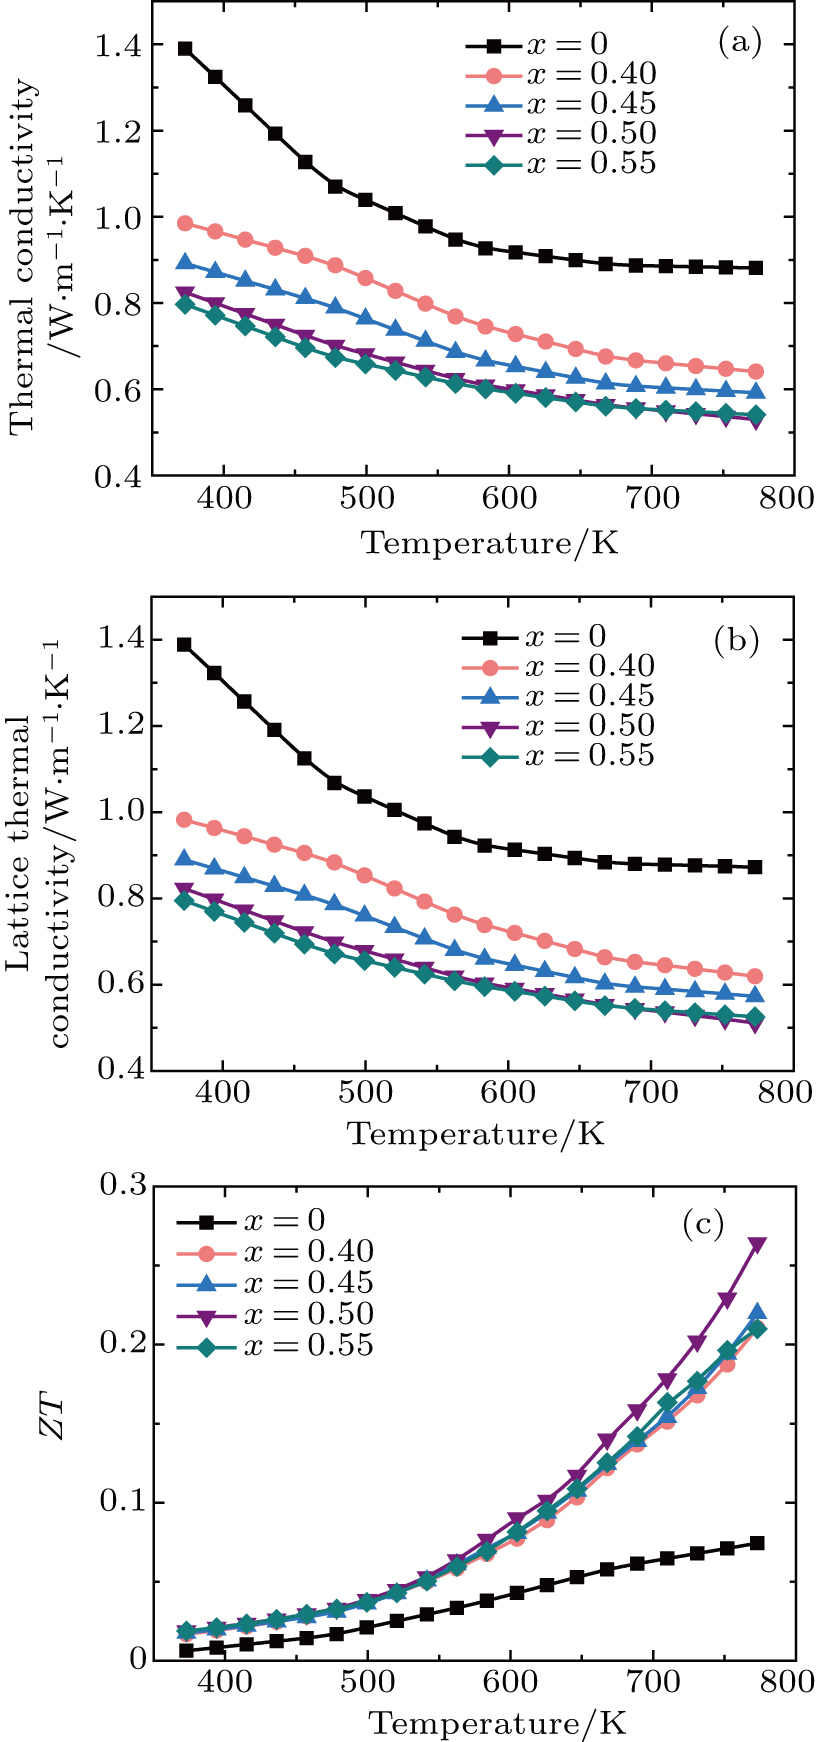
The temperature dependence of total thermal conductivity of Mg3Sb2−xBix (0.4 ≤ x ≤ 0.55) samples is displayed in Fig. 5(a). The total thermal conductivity values of Bi-doped samples show that they decrease significantly with Bi concentration increasing, and decease with temperature rising. Generally, the lattice thermal conductivity (κL) is calculated by subtracting the electronic thermal conductivity (κe) from the total thermal conductivity (κ), where κe can be estimated by Wiedemann–Franz law κe = LT/ρ, and L is the Lorentz number. The calculated temperature dependence of lattice thermal conductivity is shown in Fig. 5(b). There is no significant difference between the total thermal conductivity and the lattice thermal conductivity due to the low electrical thermal conductivity. Hence, the lattice thermal conductivity is dominant and shows a relative low value that is ascribed to the introducing of Bi. The relative atomic mass of the Bi atom is about twice that of the Sb atom. The substitution of Bi atom for Sb sets up the heavy atom doping effect, which can slow down the thermal vibration of the lattice. The lattice distortion induced by Bi atom replacing Sb atom enhances the scattering of short wavelength phonons. On the other hand, the nanoscaled Bi-rich particles distributed on the matrix increase the density of grain boundaries, which can scatter long wavelength phonons efficiently. Therefore, the Bi doping brings about multi-scale phonon scattering mechanism, which can greatly reduce the lattice thermal conductivity.

Fig. 5. The temperature-dependent thermal transport properties and ZTs of the Mg3Sb2−xBix (0.4 ≤ x ≤ 0.55), showing (a) total thermal conductivity κ(T), (b) lattice thermal conductivity κL (T), and (c) ZT(T).

The dimensionless figures of merit ZT of Mg3Sb2−xBix (0.4 ≤ x ≤ 0.55) compounds are shown in Fig. 5(c). The maximum value is 0.27 at 773 K for x = 0.5, about 5 times higher than that of undoped Mg3Sb2. Compared with other single p-type doping Mg3Sb2-based alloys, such as Li-doped Mg3Sb2,[25] Na-doped Mg3Sb2,[26] and Ag-doped Mg3Sb2,[27] Bi-doped Mg3Sb2 exhibits a very low thermal conductivity over the measurement temperature range due to the large mass difference between Sb and Bi atoms, and the enhanced scattering by point defect and the nanoscaled particles on the matrix. Therefore, limited by carrier concentration and mobility, the comprehensive electrical performance needs to be further improved by doping the acceptors.

4. Conclusions

In summary, according to the first-principles calculation results, the band gap decreases when Bi is substituted for Sb site, which is conductive to the improvement of carrier concentration. The Mg3Sb2−xBix (0.4 ≤ x ≤ 0.55) samples are successfully synthesized through combining the suspension induction melting method with the SPS method. A peak ZT of 0.27 is obtained at 773 K for x = 0.5. In comparison with that of other single doping Mg3Sb2 materials, the thermoelectric performance of Bi-doped samples is improved primarily by reducing the thermal conductivity, which is due to the enhanced scattering for phonons from the heavier Bi atoms substituted for Sb site and the nanoscaled particles on the matrix. The ultra-low thermal conductivity makes the Mg3Sb1.5Bi0.5-based materials receive much attention for the applications in thermoelectric devices.

Reference
[1] Chen X X Wu H J Cui J Xiao Y Zhang Y He J Q Chen Y Cao J Cai W Pennycook S J Liu Z H Zhao L D Sui J H 2018 Nano Energy 52 246
[2] Condron C L Kauzlarich S M Gascoin F Snyder G J 2006 J. Solid State Chem. 179 2252
[3] Shi X M Wang X Li W Pei Y Z 2018 Small Methods 2 18000022
[4] Liu W S Hu J Z Zhang S M Deng M J Han C G Liu Y 2017 Mater. Today Phys. 1 50
[5] Champier D 2017 Energy Convers. Manag. 140 167
[6] Snyder G J Toberer E S 2008 Nat. Mater. 7 105
[7] Shi X Kong H Li C P Uher C Yang J Salvador J R Wang H Chen L Zhang W 2008 Appl. Phys. Lett. 92 182101
[8] Zhao W Y Wei P Zhang Q J Dong C L Liu L S Tang X F 2009 J. Am. Chem. Soc. 131 3713
[9] Beekman M Nolas G S 2008 J. Mater. Chem. 18 842
[10] Kim J H Okamoto N L Kishida K Tanaka K Inui H 2006 Acta Mater. 54 2057
[11] Madsen G K H Schwarz K Blaha P Singh D 2003 Phys. Rev. 68 125212
[12] Bux S K Zevalkink A Janka O Uhl D Kauzlarich S Snyder J G Fleurial J P 2014 J. Mater. Chem. 2 215
[13] Kauzlarich S M Brown S R Snyder G J 2007 Dalton Trans. 21 2099
[14] Toberer E S May A F Snyder G J 2010 Chem. Mater. 22 624
[15] Tamaki H Sato H K Kanno T 2016 Adv. Mater. 28 10182
[16] Zhang J W Song L R Pedersen S H Yin H Hung L T Iversen B B 2017 Nat. Commun. 8 13901
[17] Imasato K Ohno S Kang S D Snyder G J 2018 APL Mater. 6 016106
[18] Kanno T Tamaki H Sato H K Kang S D Ohno S Imasato K Kuo J J Snyder G J Miyazaki Y 2018 Appl. Phys. Lett. 112 033903
[19] Zhang J W Song L R Mamakhel A Jørgensen M R V Iversen B B 2017 Chem. Mater. 29 5371
[20] Pei Y Z Shi X Y Lalonde A D Wang H Chen L D Snyder G J 2011 Nature 473 66
[21] Liu W Tan X J Yin K Liu H J Tang X F Shi J Zhang Q J Uher C 2012 Phys. Rev. Lett. 108 166601
[22] Pei Y Z Lalonde A D Wang H Snyder G J 2012 Energy Environ. Sci. 5 7963
[23] Imasato K Kang S D Ohno S Snyder G J 2018 Mater. Horiz. 5 59
[24] Mao J Wu Y X Song S W Zhu Q Shuai J Liu Z H Pei Y Z Ren Z F 2017 ACS Energy Lett. 2 2245
[25] Wang H Chen J Lu T Q Zhu K J Li S Liu J Zhao H Z 2018 Chin. Phys. B. 27 047212
[26] Shuai J Wang Y M Kim H S Liu Z H Sun J Y Chen S Sui J H Ren Z F 2015 Acta Materialia 93 187
[27] Song L R Zhang J W Iversen B B 2017 J. Mater. Chem. 5 4932
[28] Bhardwaj A Misra D K 2014 RSC Adv. 4 34552
[29] Bhardwaj A Rajput A Shukla A K Pulikkotil J J Srivastava A K Dhar A Gupta G Auluck S Misra D K Budhani R C 2013 RSC Adv. 3 8504
[30] Shi X M Zhao T T Zhang X Y Sun C Chen Z W Lin S Q Li W Gu H Pei Y Z 2019 Adv. Mater. 31 1903387
[31] Imasato K Wood M Kuo J J Snyder G J 2018 J. Mater. Chem. 6 19941