Asynchronism of the spreading dynamics underlying the bursty pattern
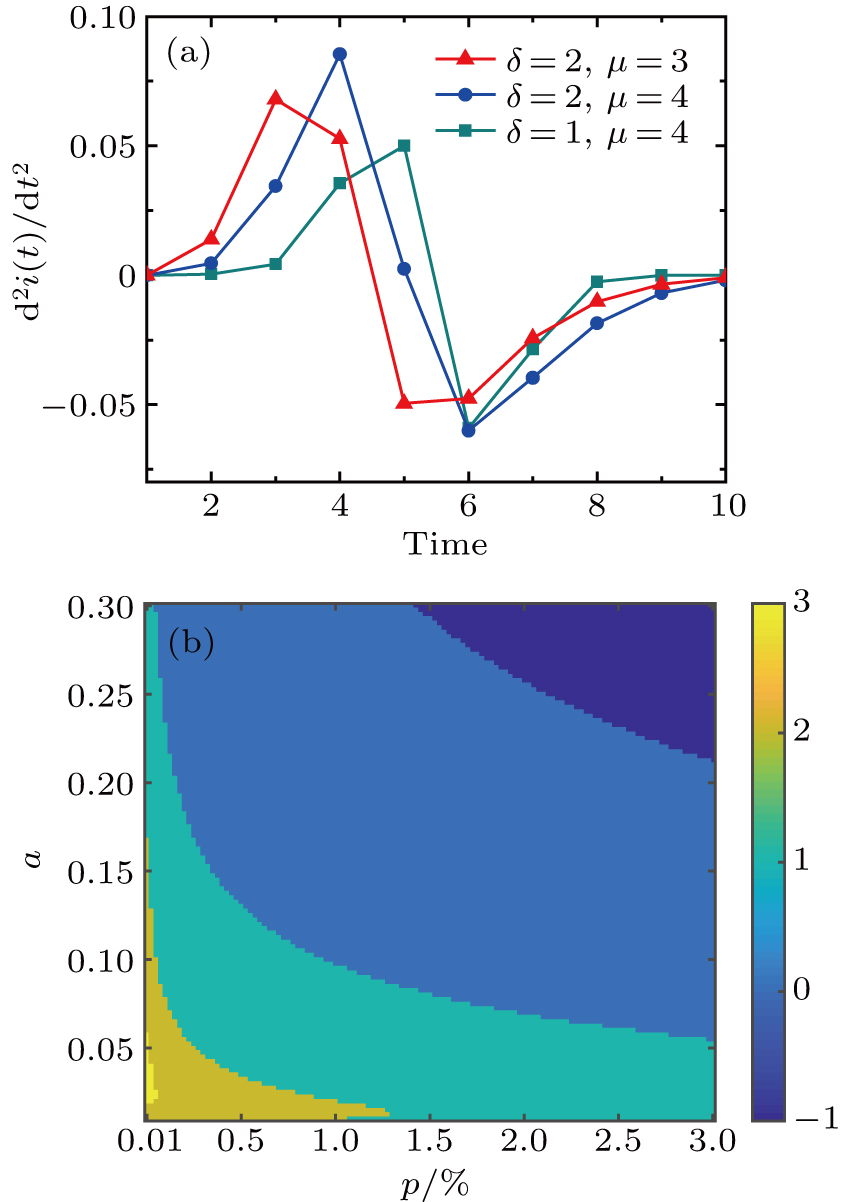
Numerical simulations of the advanced SI model. The spreading probability follows different Gaussian-like distributions. Panel (a) plots the change rate in the spreading velocity on Twitter as functions of δ and μ, where the initial infected density p = 0.1 % and a = 0.1. Panel (b) plots the time gap δ t for different a and p on Brightkite.
