Asynchronism of the spreading dynamics underlying the bursty pattern
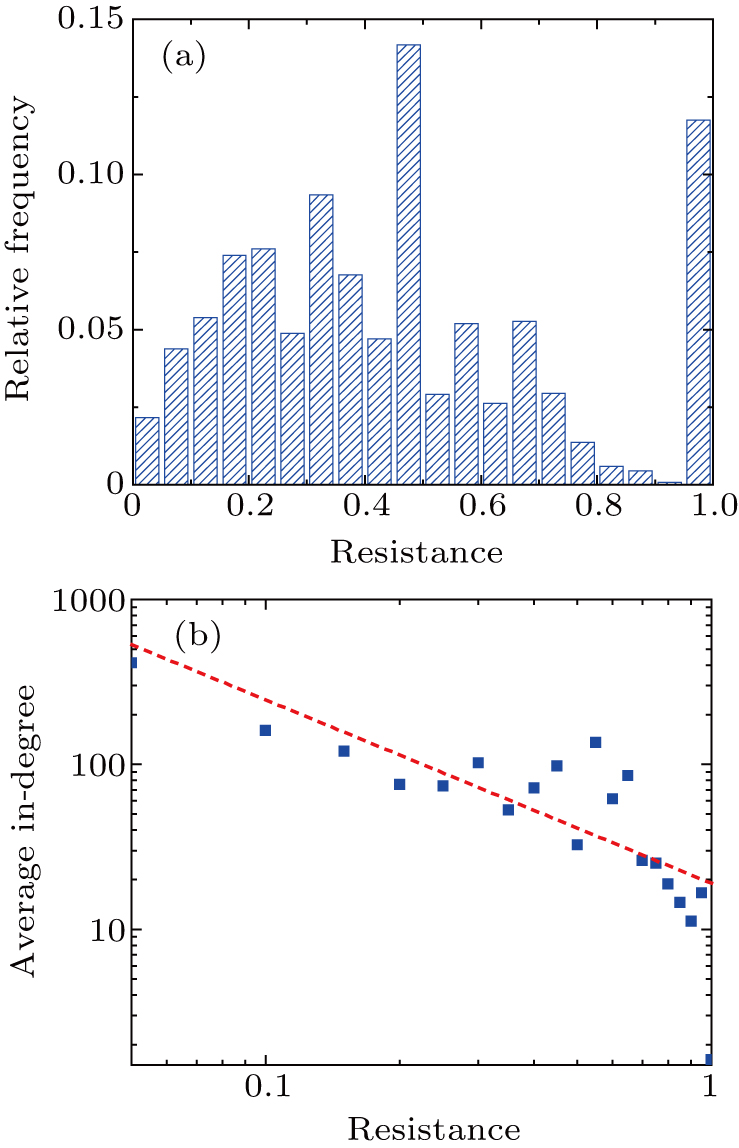
The resistance distribution and the average in-degree versus the resistance. Panel (a) shows the histogram of the resistance distribution with the bin width 0.05. Panel (b) shows the average in-degree of nodes in the corresponding resistance intervals. The fitted curve reflects the negative correlation between the average in-degree and resistance of nodes.