Generating mechanism of pathological beta oscillations in STN–GPe circuit model: A bifurcation study
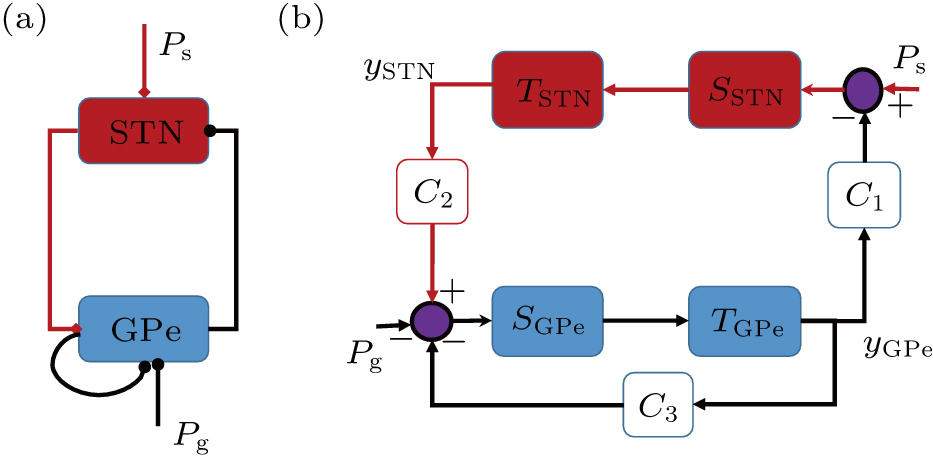
(a) Schematic diagram of STN–GPe circuit model. Red lines with rhombus represent the excitatory projections and black lines with round heads denote inhibitory projections. (b) Block diagram of STN–GPe circuit model, where C1 and C2 are the inter-coupling strengths between STN and GPe populations, and C3 represents the intra-coupling (self-feedback) strength of GPe population, and ySTN and yGPe are the outputs of STN and GPe populations, respectively. Both STN and GPe populations are denoted by their linear convolution operators (TSTN and TGPe) and sigmoid nonlinear elements (SSTN and SGPe).
