


Effect of heating time on structural, morphology, optical, and photocatalytic properties of g-C3N4 nanosheets
Cite this Article
Hung Nguyen Manh, Mai Oanh Le Thi, Hang Lam Thi, Chung Pham Do, Duyen Pham Thi, Thang Dao Viet, Van Minh Nguyen. Effect of heating time on structural, morphology, optical, and photocatalytic properties of g-C3N4 nanosheets. Chinese Physics B, 2020, 29(5): 057801 
Permissions
Effect of heating time on structural, morphology, optical, and photocatalytic properties of g-C3N4 nanosheets
† Corresponding author. E-mail:
Project supported by the scientific and technological project at the level of Ministry of Education, Vietnam (Grant No. B2018-SPH-06-CTrVL).
Abstract
Effect of heating time on the structural, morphology, optical, and photocatalytic properties of graphitic carbon nitride (g-C3N4) nanosheets prepared at 550 °C in Ar atmosphere is studied. The investigations are carried out by using x-ray diffraction (XRD), scanning electron microscopy (SEM), Fourier-transform infrared spectroscopy (FTIR), UV–vis absorption, and photoluminescence (PL). At a heating temperature of 550 °C, g-C3N4 nanocrystals are formed after 0.5 h and become more orderly as the heating time increases. The surface area of the g-C3N4 nanosheets significantly increases as the preparation time increases. The g-C3N4 prepared in 2.5 h shows the highest photocatalytic performance, decomposing completely 10 ppm RhB solution under xenon lamp irradiation for 2.0 h.
1. Introduction
Facing the exhaustion of fossil fuel resources and serious environmental pollution due to industrial and domestic wastes, scientists are actively looking for efficient photocatalysts which can convert solar energy into chemical energy and be used in the photodegradation of environmental pollutants, hydrogen production via water splitting, air treatment, and CO2 conversion to hydrocarbon fuel.[1–5] In the last few years, graphitic carbon nitride (g-C3N4), as a new material, has come into being in this area, and it is a non-metallic semiconductor with a band gap energy of about 2.7 eV (λ ∼ 460 nm), durable, non-toxic, highly recyclable and exhibits superior photocatalytic ability.[2,6–10] Therefore, g-C3N4 has become an attractive research object in the field of photocatalyst.
To obtain g-C3N4, it is necessary to use carbon and nitrogen-rich precursors such as urea,[11,12] thiourea,[11] melamine,[13,14] cyanamide,[15] dicyandiamide,[16] etc. Common methods for preparing g-C3N4 include high-pressure pyrolysis,[17] thermal polymerization,[14] hydrothermal,[18,19] etc. One of the C and N-rich precursors, not expensive and easy to find, is urea. Our previous study showed that with a heating time of 2 h, g-C3N4 nanosheets prepared by thermal polymerization in Ar atmosphere at 550 °C exhibited the highest photocatalytic efficiency.[20] In the present work, the heating temperature is fixed at 550 °C while the heating time is changed from 0.5 to 2.5 h to study the effect of the heating time on the formation of crystal structure, optical property, and photocatalytic performance of g-C3N4 nanosheets.
2. Experiment
2.1. Preparation of g-C3N4
Thermal polymerization in inert Ar atmosphere was adopted to synthesize g-C3N4. Firstly, 5 g urea (≥ 97.0%, Sigma-Aldrich) was mixed with ethanol solution, ground for 1 h, and transferred into an alumina crucible. Thermal polymerization process took place at the heating temperature of 550 °C for different time from 0.5 h to 2.5 h in Ar atmosphere by using a tubular furnace. The samples are denoted as CN-x (x = 0.5, 1.0, 1.5, 2.0, and 2.5) according to their preparation time.
2.2. Photocatalytic degradation experiment
The 10 ppm Rhodamine B (RhB) solution was used as a reagent to determine the photocatalytic activity of the as-synthesized g-C3N4. Initial RhB solution was prepared at a concentration of 20 ppm. As the first step, 0.06 g g-C3N4 nanosheets was dispersed in 30 ml distilled water under ultrasonic vibration for 1 h. In the second step, 30 ml g-C3N4-containing solution was mixed with 30 ml 20-ppm RhB solution to obtain 60 ml 10-ppm RhB solution containing g-C3N4.
Firstly, the RhB adsorption experiment was carried out to assess the adsorption ability of g-C3N4. The 10 ppm RhB solution containing g-C3N4 was stirred in a dark chamber for 30 min to reach an adsorption–desorption equilibrium. The solution was then illuminated by a 300 mW xenon lamp. The xenon lamp was placed at a distance of 6 cm from the surface of the RhB solution. After every 15 min of illumination, an amount of 3 ml of the suspension was taken and centrifuged to remove g-C3N4 for UV–vis absorption measurement. The intensity of the 552 nm absorption peak was used to determine the remaining RhB concentration in the solution from which the C/C0 ratio was calculated.
2.3. Characterizations
The D8 Advance diffractometer (Bruker) with Cu-Kα radiation was used to record the x-ray diffraction (XRD) patterns of the as-synthesized g-C3N4 nanosheets. The morphologies of the as-synthesized g-C3N4 nanosheets were observed by using a scanning electron microscopy (SEM) (S-4800 NIHE microscope, Hitachi). The Brunauer–Emmett–Teller (BET) surface area was measured by a Micromeritics 3Flex. Ultraviolet–visible (UV–vis) absorption spectra were measured by a Jasco V670 UV–vis spectrophotometer through the diffuse reflectance spectroscopy (DRS) technique for the g-C3N4 powder. Fourier transform infrared spectra (FTIR) were measured by an IR Prestige-21 FTIR/NIR spectrometer (Shimadzu). Photoluminescence (PL) spectra were also measured by a fluorescence spectrophotometer (Nanolog iHR 320, Horiba) at the excitation wavelength of 350 nm.
3. Results and discussion
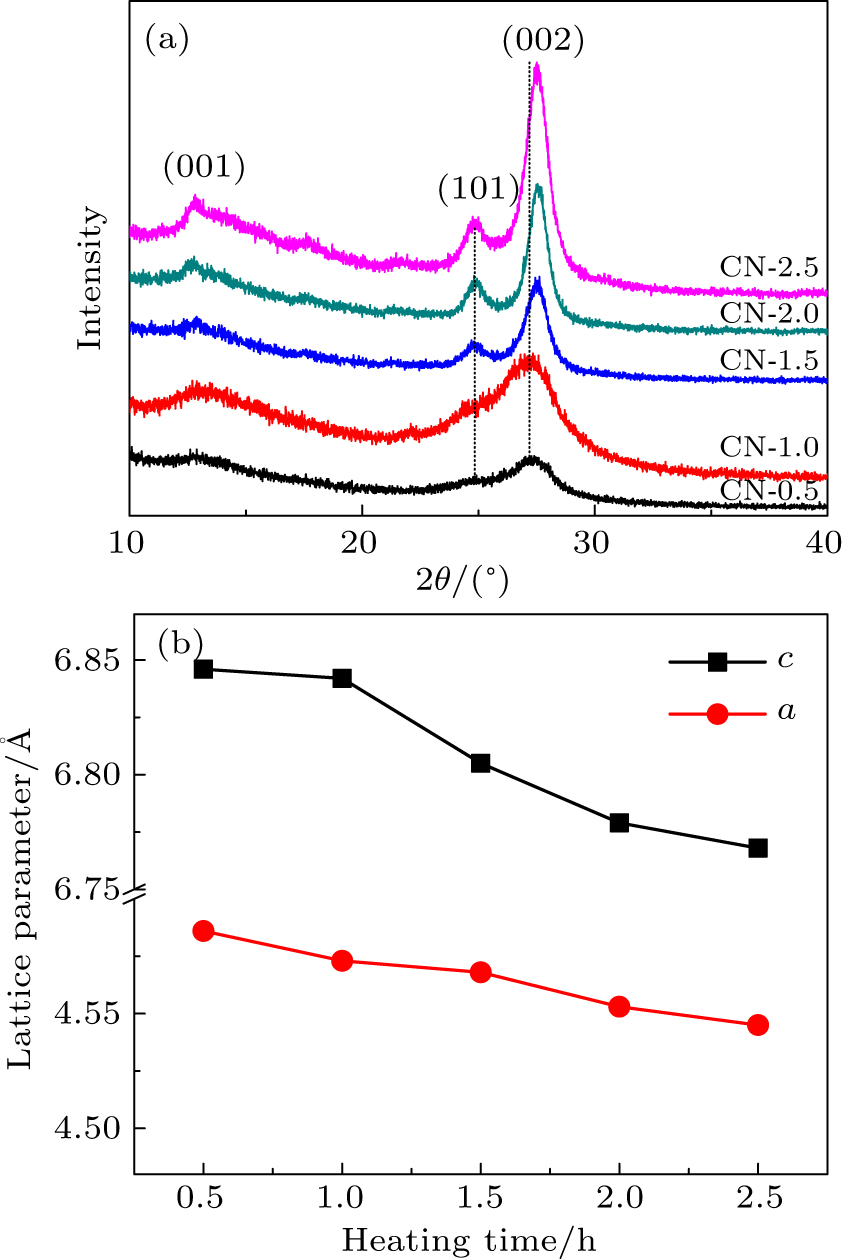
The XRD patterns of the g-C3N4 samples prepared at the heating temperature of 550 °C for different time are shown in Fig.
 | Fig. 1. (a) XRD patterns of g-C3N4 samples heated at 550 °C for different heating time and (b) lattice parameters varying with heating time. |
| Table 1. Peak positions, heights, and full widths at half maximum (FWHM) of (002) XRD peaks, and lattice parameters a and c of as-prepared samples. . |
Figure
 | Fig. 2. (a) FTIR spectra of g-C3N4 samples prepared at 550 °C with different preparation time and (b) FTIR peak positions varying with wavelength. |
The SEM images of g-C3N4 synthesized with different heating time are shown in Fig.
 | Fig. 3. FE-SEM images of g-C3N4 nanosheets synthesized at 550 °C with different preparation time: (a) 0.5 h, (b) 1.0 h, (c) 2.0 h, and (d) 2.5 h. |
The BET technique is used to measure the specific surface area and pore size distributions of the as-prepared g-C3N4 samples with heating time of 1.0 h, 2.0 h, and 2.5 h as shown in Fig.
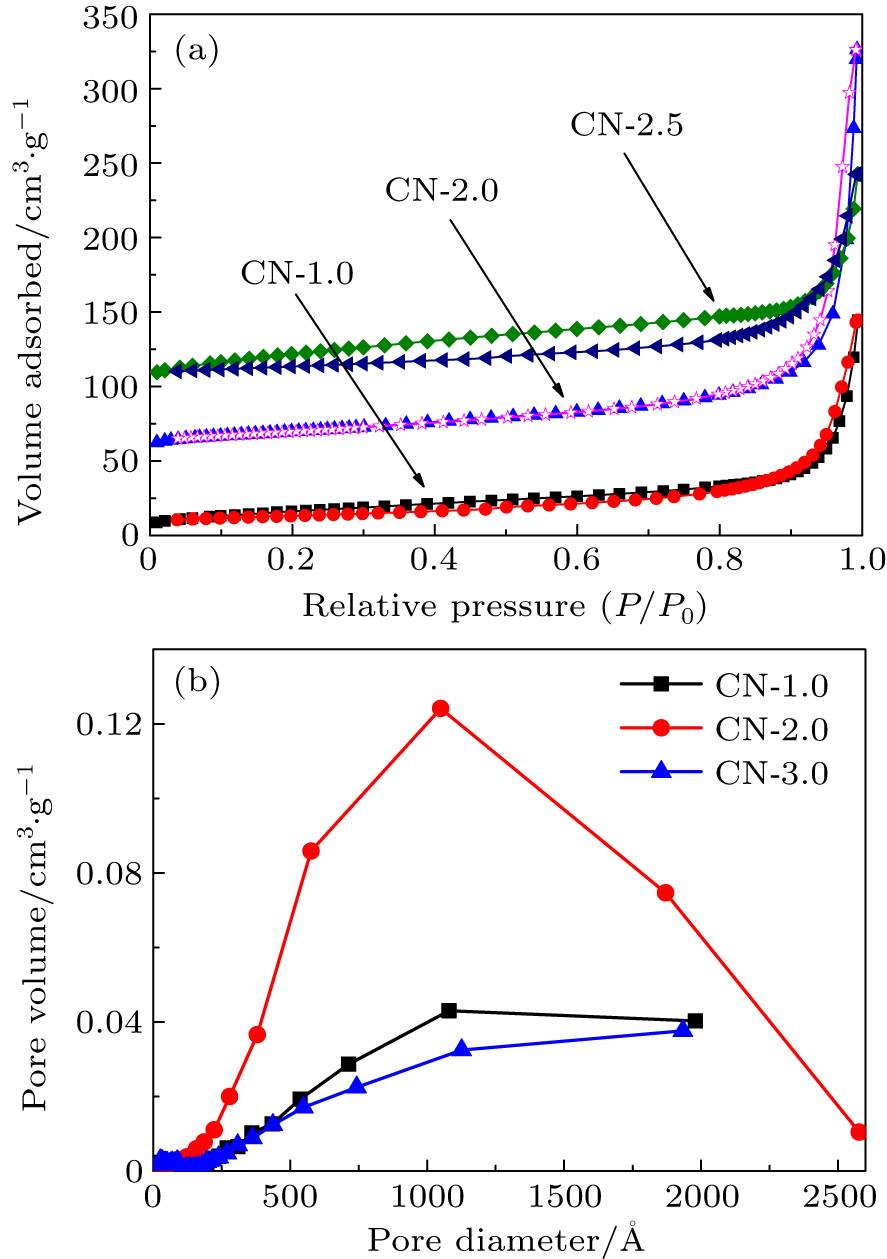 | Fig. 4. (a) N2 adsorption–desorption isotherms of g-C3N4 heated for 1.0 h, 2.0 h, and 2.5 h and (b) plots of BJH pore volume versus pore diameter. |
| Table 2. Surface areas, pore volumes, and pore sizes of the as-prepared samples. . |
UV–vis diffuse reflectance spectra (DRS) of g-C3N4 obtained with different preparation time in Fig.
 | Fig. 5. (a) Absorption spectra of g-C3N4 nanosheets obtained at 550 °C with different preparation time and (b) Wood–Tauc method determining band gap energy of indirect semiconductor. |
Figure
 | Fig. 6. (a) Photoluminescence spectra of g-C3N4 nanosheets obtained at 550 °C with different preparation time, with inset showing the normalized PL spectra and dot lines being Gaussian fitting for CN-2.0 sample, and (b) PL peak positions varying with heating time. |
The photocatalytic activity of the g-C3N4 sample is assessed through the degradation of Rhodamine B (RhB) solution under the irradiation of xenon lamp in which the UV–vis absorption technique was used to indirectly measure the concentration of remaining RhB. Figure
 | Fig. 7. Adsorption and photocatalytic activities of the g-C3N4 prepared at 550 °C with different preparation time in decomposition of RhB solution under xenon lamp irradiation. |
4. Conclusion
The structural and physical properties of g-C3N4 nanosheets are greatly influenced by the heating time. The crystal lattice is formed more orderly and packed more densely as the heating time increases. The increase in fabrication time also causes the g-C3N4 nanosheets to be slightly torn, making them more porous and the specific surface area increase. The energy band gap changes negligibly as the processing time increases. However, the photoluminescence peaks shift slightly toward longer wavelength. The changes in structure, morphology, and physical properties determine the change in the photocatalytic performance of the g-C3N4 nanosheets. The g-C3N4 nanosheets obtained in long heating time, greater than 2.0 h, possess high photocatalytic activities: the RhB decomposed after 2.0 h of xenon lamp irradiating is accounted for 95%.
Reference
| [1] | |
| [2] | |
| [3] | |
| [4] | |
| [5] | |
| [6] | |
| [7] | |
| [8] | |
| [9] | |
| [10] | |
| [11] | |
| [12] | |
| [13] | |
| [14] | |
| [15] | |
| [16] | |
| [17] | |
| [18] | |
| [19] | |
| [20] | |
| [21] | |
| [22] | |
| [23] | |
| [24] | |
| [25] |