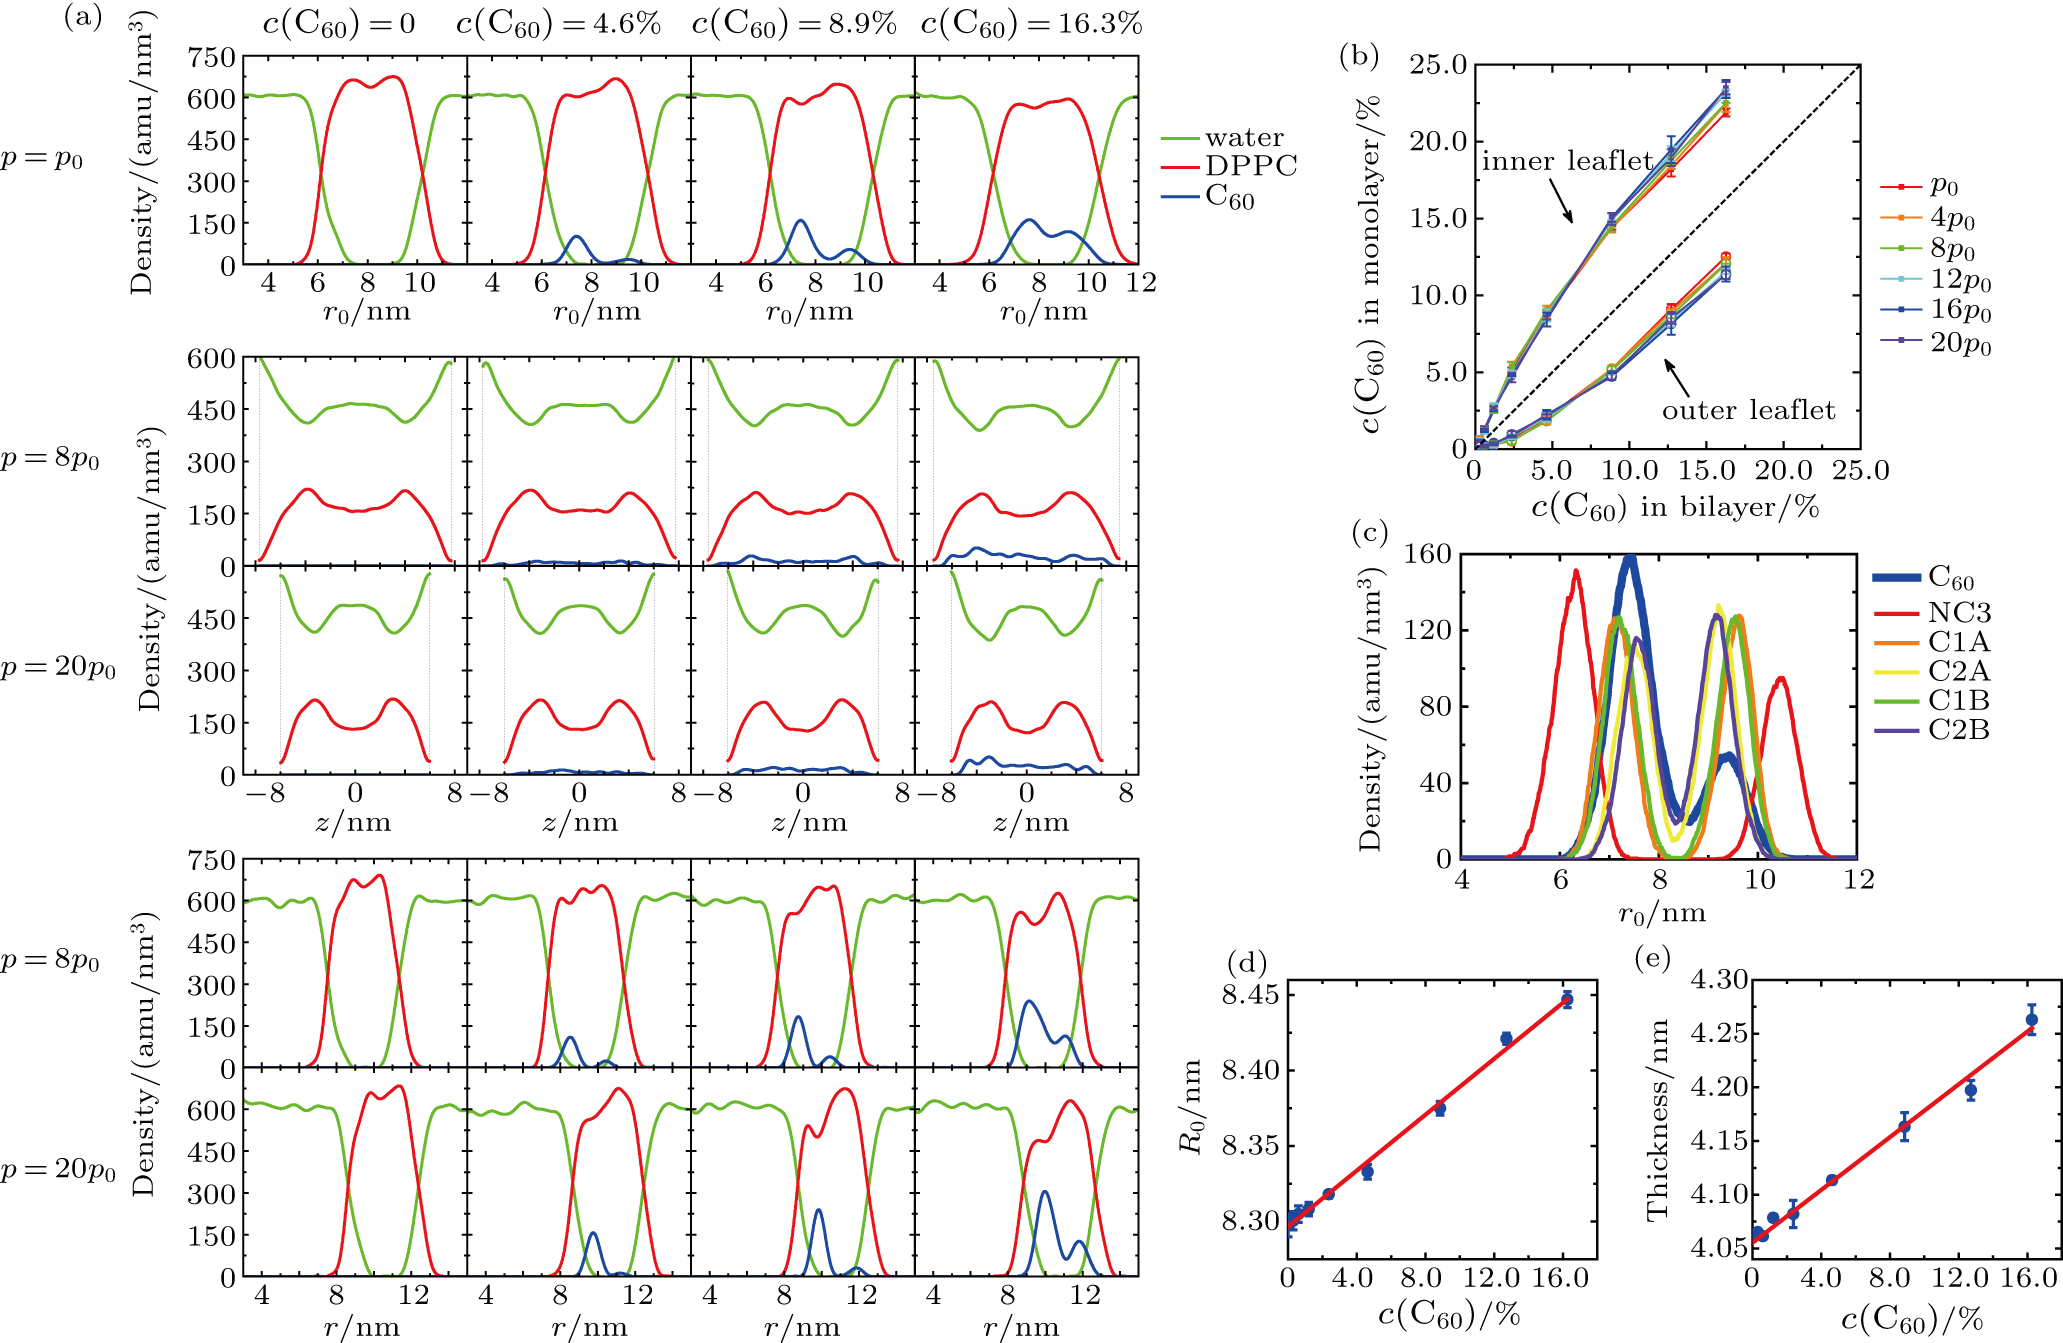
(a) Density profiles of water, DPPC and C60 in the vesicles at different vertical pressures (annotated on the left) and C60 concentrations (annotated at top). The radial density profiles under ambient pressure (1st row) are depicted by density vs distance from the center of the spherical vesicle, r0. The density profiles under pressurization are depicted by the density distributions along the z axis (2nd and 3rd rows, where the vertical dashed lines indicate the boundary of systems) and the radial density distributions in the xy plane (4th and 5th rows, where r is the distance from the center of the vesicle in the xy plane). (b) Distribution of C60 concentration in the inner (solid cubic symbols, all above the dashed line) and outer (open circle symbols, all below the dashed line) leaflets at different vertical pressures and total concentrations in the bilayers, plotted with the solid lines as guides to the eyes. The dashed black line with a slope of 1 is drawn as a reference. (c) Radial density profiles of some CG beads under ambient pressure in the system with C60 concentration of 8.9%. (d) Radius of the initial vesicles as a function of the C60 concentration. (e) Thickness of DPPC bilayers as a function of the C60 concentration. In (d) and (e), symbols are the measured data from our simulations, and solid lines indicate the results of linear fitting. |
