1. IntroductionThe NiAl intermetallic compound has attracted extensive attention as the high-temperature structural material due to its advantages such as high melting point, low density, high thermal conductivity, good oxidation resistance, etc.[1–4] Whereas NiAl exhibits the poor ductility at room temperature. The B2 NiAl alloy is composed of Ni atoms and Al atoms with a simple cubic shifted by 1/2 along the diagonal direction, with the mixed metallic and covalent bonding. Different from NiAl, the B2 NiTi alloy has been widely applied in the industry as the functional material due to its excellent shape memory effect.[5] However, the oxidation resistance at high temperature is not good and its low hardness is also a factor restricting its further extensive application. In theoretical and experimental sides, extensive works focus on the mechanical properties of NiAl and NiTi.[6–11] For instance, the shear deformation of NiAl occurs prior to tensile deformation according to the ideal tensile and shear deformation. The B2 NiAl exhibits strongly intrinsic brittleness.[12] The study of the Fe and Mn metal elements doped NiAl alloy indicated that Fe improves the ductility of NiAl.[13,14] The elastics in NiTi alloy suggested that the shear modulus  at high temperature is involved in the martensitic transformation.[15]
As one of the most important physical parameters, the elastic constants are often used to evaluate the response of the material to various internal and external stresses.[16,17] When the strain of the material is small, the relationship of stress–strain satisfies the Hooke’s law as follows:

where

represents the tensile stress,

for the shear stress,

for the tensile strain, and

represents the shear strain. The elastic constants are crucial for a sound understanding of the mechanical properties of the relevant materials. Mouhat
[18] et al. studied the necessary and sufficient elastic stability conditions in various crystal systems. Although many works on B2 NiAl and NiTi were done, the physical mechanism of stress–strain images generated by the tension and shear deformation is still unclear. The accurate calculation of the ideal strength is necessary for the theoretical study of the inherent mechanical properties of NiAl and NiTi.
First-principles method is a powerful tool to predict the atomic physical properties of materials.[19–23] It has been widely used in the past decades to calculate the elastic modulus, ideal tensile, and shear strength of pure metals and intermetallic compounds.[8,12,15,24–28] The purpose of this paper is to give a physical interpretation of the stress–strain images of NiAl and NiTi from the perspective elastic coefficients by using the first-principles calculation.
3. Results and discussionTable 1 lists the calculated equilibrium lattice parameter, three independent elastic constants for the cubic crystal, and derived elastic moduli as well as the available experimental results including bulk modulus  , shear modulus
  , and Young′s modulus
  . Our theoretical lattice parameters
  for NiAl and
  for NiTi) are in excellent agreement with the experimental results
  for NiAl and
  for NiTi.[38,39] The present calculated elastic constants of NiAl are in good agreement with the experiments, while for NiTi the calculated elastic constants are slightly larger than the experimental results. Note that the shear constant
  is consistent with the experimental result for NiTi. From Table 1, we can find that the elastically anisotropic parameters
  for NiAl and NiTi are close to each other. It indicates that the Young’s modulus along
  crystal direction is the largest among all crystal directions of B2 NiAl and NiTi. The calculated elastic moduli
  and Poisson ratio
  are very close to the experimental results. The elastic moduli of NiAl are larger than those of NiTi. According to the following equations:[40]


we calculated Young’s moduli of NiAl and NiTi along the three typical crystal directions (see Table
1). The Young’s moduli of NiAl and NiTi are both arranged in the order of

. It suggests that the tensile deformation along

crystal direction is easy with respect to other crystal directions. NiTi has smaller Young’s modulus in the three crystal directions compared to NiAl.
Table 1.
Table 1.
 Table 1. The lattice parameter a (in Å), elastic constants C11, C12, C44 (in GPa), elastic moduli B, G, E (in GPa), Poisson ratio ν, and Young’s moduli along different crystal directions. .
|
a
|
C
11
|
C
12
|
C
44
|
C′ |
C44/C′ |
B
|
G
|
E
|
E〈001〉 |
E〈110〉 |
E〈111〉 |
ν |
| NiAl |
2.893 |
208.2 |
134.5 |
118.4 |
36.9 |
3.2 |
159.1 |
74.3 |
192 |
102.6 |
197.2 |
284.6 |
0.30 |
| Expt. |
2.89 |
199 |
137 |
116 |
31 |
3.7 |
158 |
76 |
188 |
87 |
180 |
279 |
0.31 |
| NiTi |
3.003 |
181.5 |
152.3 |
50.2 |
14.6 |
3.5 |
162 |
30.7 |
86.6 |
42.5 |
87.9 |
136.5 |
0.41 |
| Expt. |
3.01 |
162 |
132 |
36 |
15 |
2.4 |
159 |
32 |
90 |
43 |
75 |
100 |
0.41 |
| Table 1. The lattice parameter a (in Å), elastic constants C11, C12, C44 (in GPa), elastic moduli B, G, E (in GPa), Poisson ratio ν, and Young’s moduli along different crystal directions. . |
For the energy–strain and stress–strain relationships, a series of incremental strains were applied to the crystal, and the total energy and stress were firstly calculated as a function of the strain. At each step of the strain, the atomic position and structural parameters were fully relaxed while keeping the applied strain fixed. Along the  crystal direction, the uniaxial tension along the body centered tetragonal (bct) path, the cell deformation from bcc to face centered cubic (fcc) is shown in Fig. 1(a). Considering that the orthogonal strain path may occur before the ideal strength up to maximum along the bct path, we define the orthorhombic strain path as the face centered orthogonality (fco) path (shown in Fig. 1(b)). The configurations of tensile deformation along
  crystal directions are shown in Figs. 1(c) and 1(d). The
  shear deformations are shown in Figs. 1(e) and 1(f).
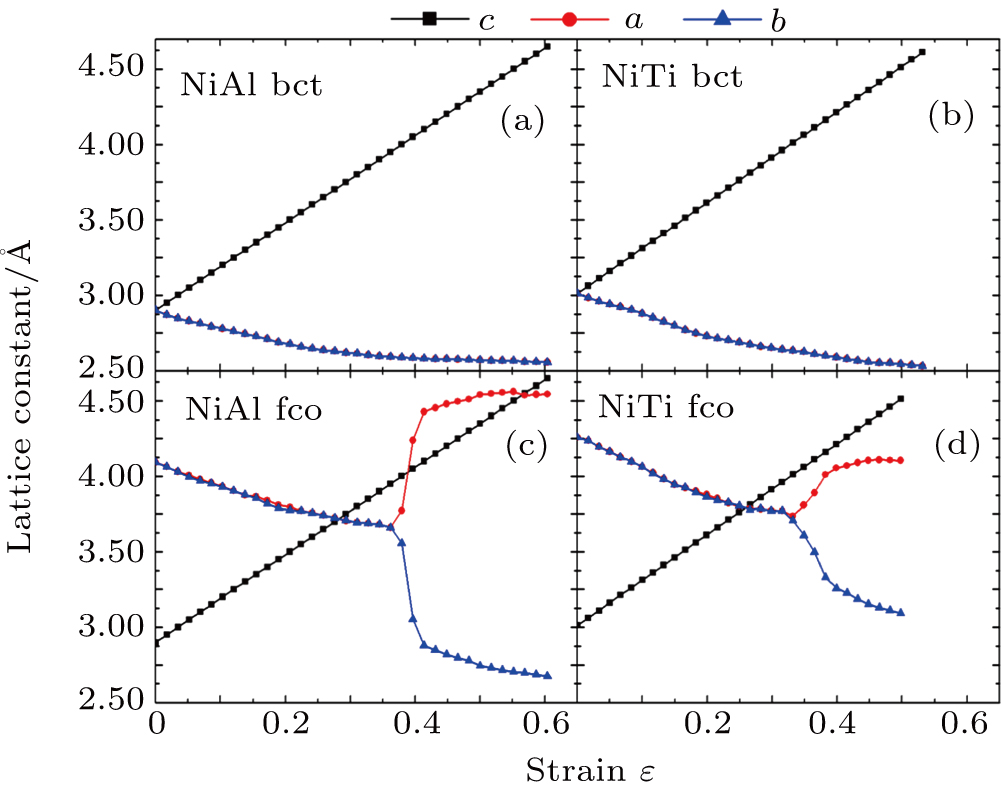
The relationships between the structural parameters, energy vs. strain, and stress vs. strain in the tensile and shear processes are shown in Figs. 2–4. For the tensile along the bct path, we show in Figs. 2(a) and 2(b) the lattice parameters as a function of the tensile strain. The lattice parameters  are fully relaxed under the tensile load. Both
  decrease with increasing strain, and remain equal with each other. For the fco path,
  shown in Figs. 2(c) and 2(d) are equal and decrease linearly in the range
 for NiTi, with the increase of the tensile strain. Beyond
 for NiTi, a bifurcation occurs because of lattice parameter
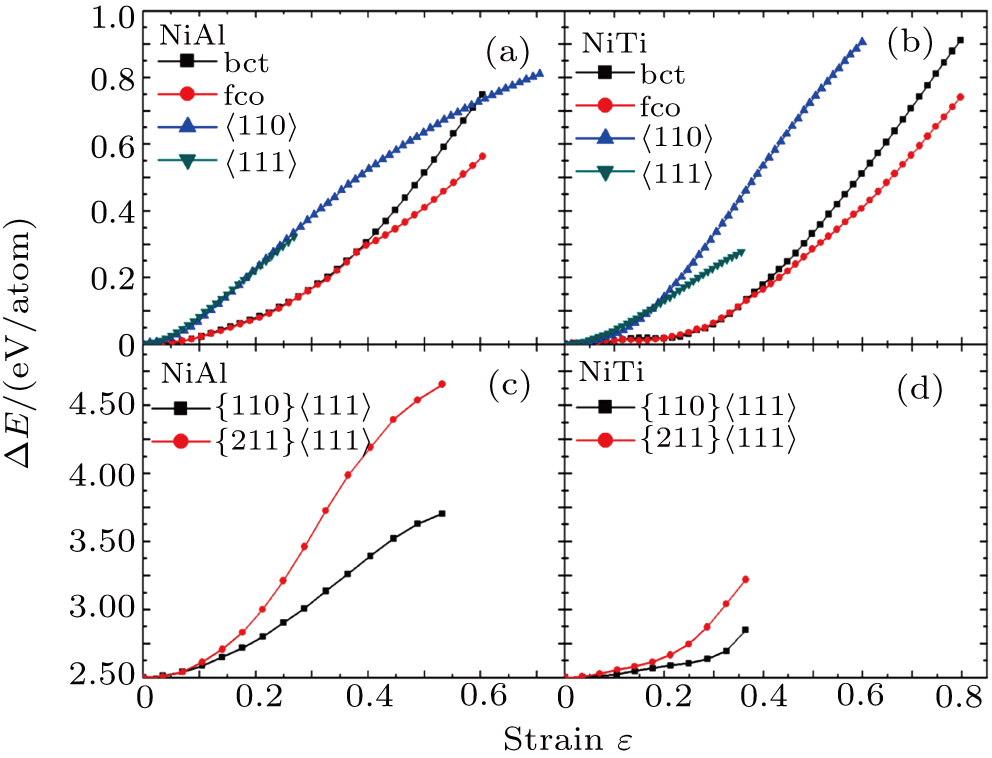
Figure 3 shows the energy difference  as a function of the strain. It can be seen that the energy goes up as the strain increases. For NiAl and NiTi, the initial growth rate of energy along the
  crystal direction is the largest during the tensile process (see Figs. 3(a) and 3(b)). In the
  crystal direction, the energy difference
  along the bct path is the same as that in the fco path (
 for NiAl and
  for NiTi). The overall trend of energy vs. strain image of NiAl is very similar to that of NiTi, except that when the strain
  , the energy of NiTi increases slowly and the energy starts to increase significantly beyond
  .
.
For the shear deformation, we can find from Fig. 3(c) (Fig. 3(d)) that the  under
under  shear deformation in NiTi increases linearly as a function of shear strain
  , whereas the corresponding shear stain
  occurs in NiAl. It may suggest that NiTi has good elastically deformed behavior and shape memory effect. The energy difference under
  shear deformation is larger compared to that under {110}
 .
.
The variation of the ideal tensile strength is shown in Figs. 4(a) and 4(b). Table 2 summarizes the ideal strength and the corresponding strain under different deformations. The order of the initial slope value of the image is  , which is consistent with the data of Young’s modulus listed in Table (1). The overall trend of the stress–strain image under tensile load for NiAl is very similar to that for NiTi, except that there is a small peak along
  tension for NiTi before the bifurcation
  . The stress–strain image along the bct path is almost the same as that along the fco path before the bifurcation (
 for NiAl,
  for NiTi) occurs. The lowest ideal tensile strength of NiAl is along the
  crystal direction, which is different from the lowest strength of NiTi along the
  crystal direction. The ideal shear strength is shown in Figs. 4(c) and 4(d). The ideal strength under
  shear is much greater than that under
  , indicating an anisotropic characteristics along the
  crystal direction.
Table 2.
Table 2.
 Table 2. Ideal tensile and shear strain e and strength s of NiAl and NiTi. .
|
Deformation |
ε |
γ |
| NiAl |
〈001〉 bct |
0.55 |
24.9 |
| 〈001〉 fco |
0.36 |
18.1 |
| 〈110〉 |
0.19 |
19.2 |
| 〈111〉 |
0.19 |
17.3 |
| {110}〈111〉 |
0.36 |
8.6 |
| {211}〈111〉 |
0.29 |
16.2 |
| NiTi |
〈001〉 bct |
0.08 |
2.2 |
| 〈001〉 fco |
0.08 |
2 |
| 〈110〉 |
0.33 |
21.1 |
| 〈111〉 |
0.22 |
11 |
| {110}〈111〉 |
0.14 |
1.4 |
| {211}〈111〉 |
0.32 |
10.5 |
| Table 2. Ideal tensile and shear strain e and strength s of NiAl and NiTi. . |
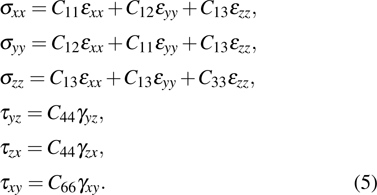
In order to better understand the tensile and shear behaviors, we study the elastic constants under tensile and shear loads. There are 21 independent constants in the generalized elastic tensor which relates stress and strain in an anisotropic medium. The number of independent elastic constants depends on the lattice symmetry. For NiAl and NiTi, we calculated the elastic coefficients during tension along the bct (the tetragonal lattice is observed) path. Due to the lattice parameter  and the basic vector’s orthogonality in the tetragonal crystal system, we can derive the following equations from Eq. (1):

There are only 6 independent elastic constants in Eq. (
5) for the tetragonal lattice.

, and

) represent the tensile stress (strain) along the

-axis,

-axis, and

-axis.

),

), and

) represent the shear stress (strain) along the

–

plane,

–

plane, and

–

plane, respectively. Figure (
5) shows the variation of the elastic coefficients for NiAl and NiTi under uniaxial strain along the bct path. From the strain of

for NiAl and

for NiTi, we can find the elastic constant

0 from Fig.
6, which results in the

plane shear failure according to Eq. (
5). Because of the
x–
y plane shear failure, we can observe that both
a 
and bifurcation occur when the tension is along the fco path. Our calculations at the deformation (

for NiAl and

for NiTi) are in good agreement with the tensile strains shown in Figs.
2(c) and
2(d) (

for NiAl) and

for NiTi). From Eq. (
5), we can see that

are the first partial derivative of

with respect to

. Figure
6 shows

0 at the strain

for NiAl and

for NiTi, which indicates that the slope of the stress–strain image of the bct path should be negative or zero. The results are consistent with the conclusion shown Figs.
4(a) and
4(b).

is the necessary and sufficient conditions for the elastic stability in tetragonal classes,
[18] violating this condition occurs at the strain of

for NiTi in Fig.
5. This may be the reason why there is a small wave peak along

tension (

of NiTi. By analyzing the NiTi structure when it is stretched along the path of

to reach the ideal strength, we speculate that it might be caused by the shear failure under {110}

during the stretching process.
Figure 7 shows the charge density difference in the {110} plane family under tensile and shear loads. We can see that the charge density near Ni atoms is larger than that near Al and Ti. It suggests that the charge transfers from Al and Ti to Ni, i.e., Ni atoms obtain charge from Al and Ni. The charge density locates on the Al and Ni atoms in NiAl, while the charge density is slightly delocalized in NiTi. It may indicate that the metallic bonding exits in NiAl alloys. With the increase of the tensile and shear loads, the image of charge difference near Ti and Ni extremely changes, while the image of charge difference keeps unchanged in NiAl. The bonding direction between Ni and Ti extremely changes, which may indicate that the bonding is relatively weak between Ni and Ti, then the tensile and shear deformation occurs easily in NiTi.


